. 2016 Jan;278(1):135-45.
doi: 10.1148/radiol.2015142856. Epub 2015 Jul 17.

Computer-extracted Features Can Distinguish Noncancerous Confounding Disease from Prostatic Adenocarcinoma at Multiparametric MR Imaging

Affiliations

Computer-extracted Features Can Distinguish Noncancerous Confounding Disease from Prostatic Adenocarcinoma at Multiparametric MR Imaging

Geert J S Litjens et al. Radiology. 2016 Jan.

Abstract

Purpose: To determine the best features to discriminate prostate cancer from benign disease and its relationship to benign disease class and cancer grade.

Materials and methods: The institutional review board approved this study and waived the need for informed consent. A retrospective cohort of 70 patients (age range, 48-70 years; median, 62 years), all of whom were scheduled to undergo radical prostatectomy and underwent preoperative 3-T multiparametric magnetic resonance (MR) imaging, including T2-weighted, diffusion-weighted, and dynamic contrast material-enhanced imaging, were included. The digitized prostatectomy slides were annotated for cancer and noncancerous disease and coregistered to MR imaging with an interactive deformable coregistration scheme. Computer-identified features for each of the noncancerous disease categories (eg, benign prostatic hyperplasia [BPH], prostatic intraepithelial neoplasia [PIN], inflammation, and atrophy) and prostate cancer were extracted. Feature selection was performed to identify the features with the highest discriminatory power. The performance of these five features was evaluated by using the area under the receiver operating characteristic curve (AUC).

Results: High-b-value diffusion-weighted images were more discriminative in distinguishing BPH from prostate cancer than apparent diffusion coefficient, which was most suitable for distinguishing PIN from prostate cancer. The focal appearance of lesions on dynamic contrast-enhanced images may help discriminate atrophy and inflammation from cancer. Which imaging features are discriminative for different benign lesions is influenced by cancer grade. The apparent diffusion coefficient appeared to be the most discriminative feature in identifying high-grade cancer. Classification results showed increased performance by taking into account specific benign types (AUC = 0.70) compared with grouping all noncancerous findings together (AUC = 0.62).

Conclusion: The best features with which to discriminate prostate cancer from noncancerous benign disease depend on the type of benign disease and cancer grade. Use of the best features may result in better diagnostic performance.


Figures

Figure 1a:
Figure 1a:
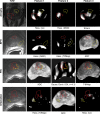
Pathologic-MR imaging mapping procedure in two patients. (a) MR image (left), pathologic image (center), and MR image overlaid with pathologic image (right) show prostate cancer (yellow line). The large lesion has a Gleason score of 3 + 4, and the other two lesions have a Gleason score of 3 + 3. Inflammation (green line), PIN (blue line), and atrophy (orange line) are also seen. (b) MR image (left), pathologic image (center), and MR image overlaid with pathologic image (right) show a lesion with a Gleason score of 3 + 4 (yellow line), atrophy (orange line), and BPH (blue line).
Figure 1b:
Figure 1b:
Pathologic-MR imaging mapping procedure in two patients. (a) MR image (left), pathologic image (center), and MR image overlaid with pathologic image (right) show prostate cancer (yellow line). The large lesion has a Gleason score of 3 + 4, and the other two lesions have a Gleason score of 3 + 3. Inflammation (green line), PIN (blue line), and atrophy (orange line) are also seen. (b) MR image (left), pathologic image (center), and MR image overlaid with pathologic image (right) show a lesion with a Gleason score of 3 + 4 (yellow line), atrophy (orange line), and BPH (blue line).
Figure 2:
Figure 2:
Feature maps of the top three selected features for atrophy, BPH, PIN, and inflammation (cf Table 6) show cancer, with low, intermediate, and high grades grouped together (red line), and the specific benign class (yellow line). The axial T2-weighted image is provided as a reference (left-most column). The selected features provide a good contrast between cancer and the specific benign class.
Figure 3a:
Figure 3a:
Fitted histograms of the feature value distribution of the top selected feature for each of the classification tasks show cancer, with low, intermediate, and high grades grouped together (red line), all benign classes (blue line), and atrophy (green line in a) (green line in b), inflammation (green line in c), and PIN (green line in d). Each specific benign class histogram has less overlap with that of cancer relative to the histogram of all benign disease grouped together, which indicates that this feature allows higher discriminability between cancer and the specific benign class.
Figure 3b:
Figure 3b:
Fitted histograms of the feature value distribution of the top selected feature for each of the classification tasks show cancer, with low, intermediate, and high grades grouped together (red line), all benign classes (blue line), and atrophy (green line in a) (green line in b), inflammation (green line in c), and PIN (green line in d). Each specific benign class histogram has less overlap with that of cancer relative to the histogram of all benign disease grouped together, which indicates that this feature allows higher discriminability between cancer and the specific benign class.
Figure 3c:
Figure 3c:
Fitted histograms of the feature value distribution of the top selected feature for each of the classification tasks show cancer, with low, intermediate, and high grades grouped together (red line), all benign classes (blue line), and atrophy (green line in a) (green line in b), inflammation (green line in c), and PIN (green line in d). Each specific benign class histogram has less overlap with that of cancer relative to the histogram of all benign disease grouped together, which indicates that this feature allows higher discriminability between cancer and the specific benign class.
Figure 3d:
Figure 3d:
Fitted histograms of the feature value distribution of the top selected feature for each of the classification tasks show cancer, with low, intermediate, and high grades grouped together (red line), all benign classes (blue line), and atrophy (green line in a) (green line in b), inflammation (green line in c), and PIN (green line in d). Each specific benign class histogram has less overlap with that of cancer relative to the histogram of all benign disease grouped together, which indicates that this feature allows higher discriminability between cancer and the specific benign class.

References

    1. Tanimoto A, Nakashima J, Kohno H, Shinmoto H, Kuribayashi S. Prostate cancer screening: the clinical value of diffusion-weighted imaging and dynamic MR imaging in combination with T2-weighted imaging. J Magn Reson Imaging 2007;25(1):146–152. - PubMed
    1. Hoeks CM, Barentsz JO, Hambrock T, et al. . Prostate cancer: multiparametric MR imaging for detection, localization, and staging. Radiology 2011;261(1):46–66. - PubMed
    1. Barentsz JO, Richenberg J, Clements R, et al. . ESUR prostate MR guidelines 2012. Eur Radiol 2012;22(4):746–757. - PMC - PubMed
    1. Portalez D, Mozer P, Cornud F, et al. . Validation of the European Society of Urogenital Radiology scoring system for prostate cancer diagnosis on multiparametric magnetic resonance imaging in a cohort of repeat biopsy patients. Eur Urol 2012;62(6):986–996. - PubMed
    1. Rosenkrantz AB, Kim S, Lim RP, et al. . Prostate cancer localization using multiparametric MR imaging: comparison of Prostate Imaging Reporting and Data System (PI-RADS) and Likert scales. Radiology 2013;269(2):482–492. - PubMed

Publication types

LinkOut - more resources