. 2015 Jul 20;10(7):e0132474.
doi: 10.1371/journal.pone.0132474. eCollection 2015.

Genome-Wide Gene Expression Analysis Shows AKAP13-Mediated PKD1 Signaling Regulates the Transcriptional Response to Cardiac Hypertrophy

Affiliations

Genome-Wide Gene Expression Analysis Shows AKAP13-Mediated PKD1 Signaling Regulates the Transcriptional Response to Cardiac Hypertrophy

Keven R Johnson et al. PLoS One. .

Abstract

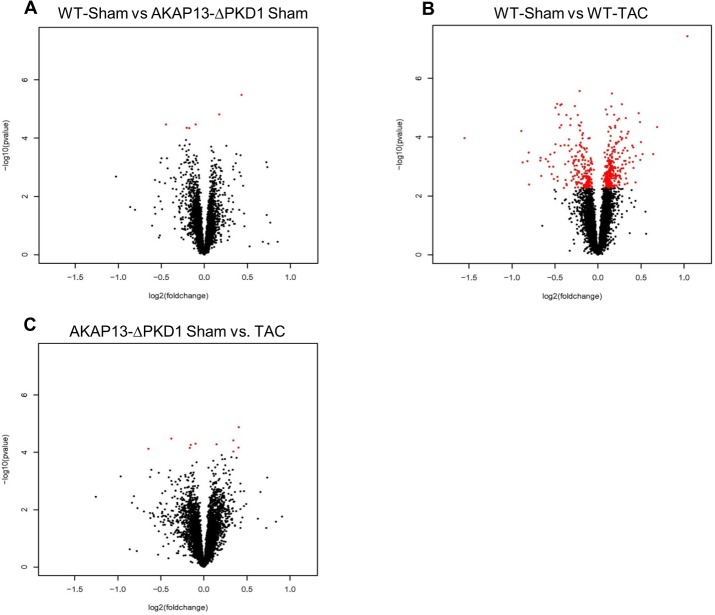
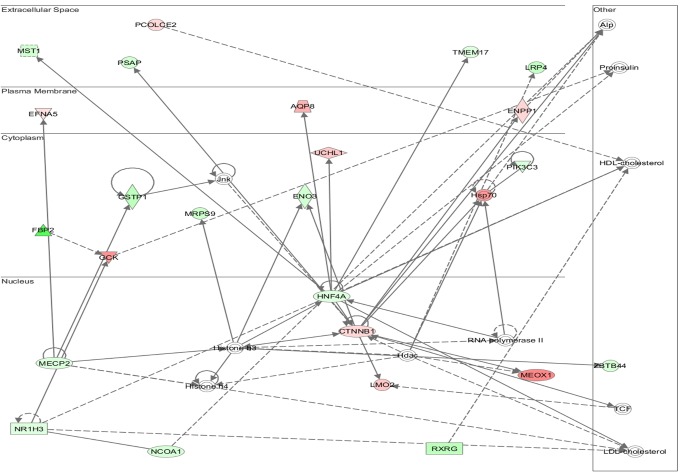
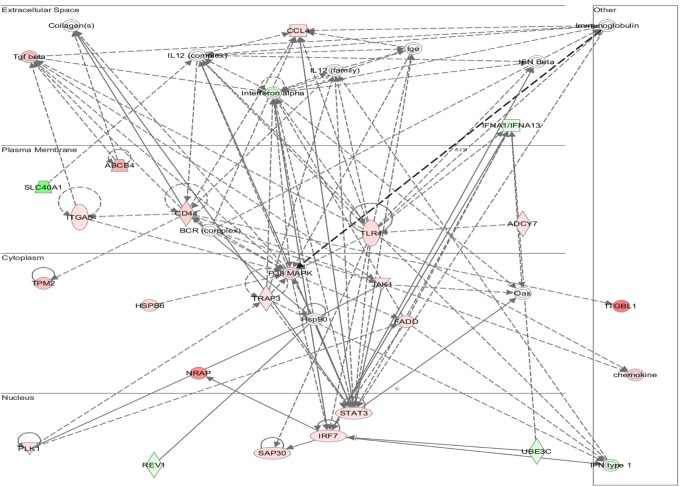
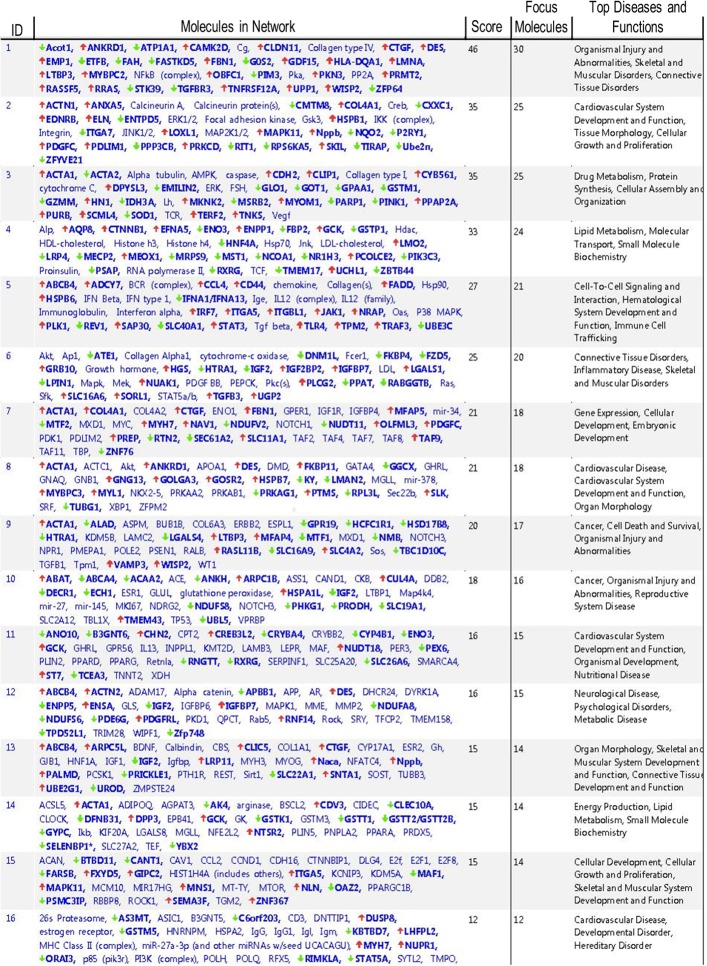
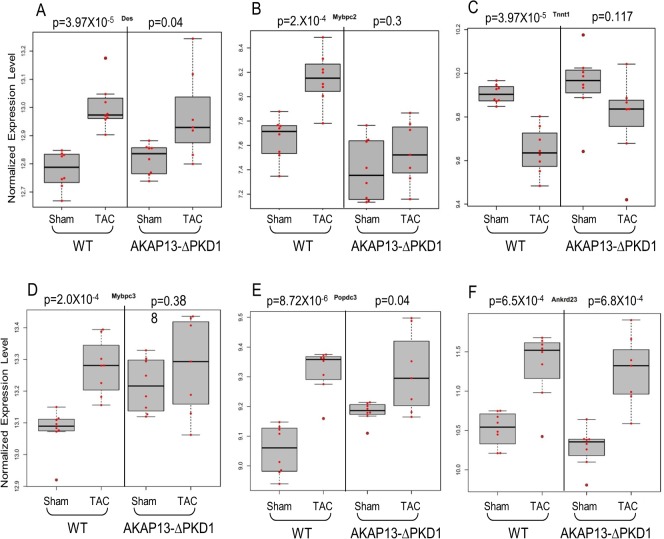
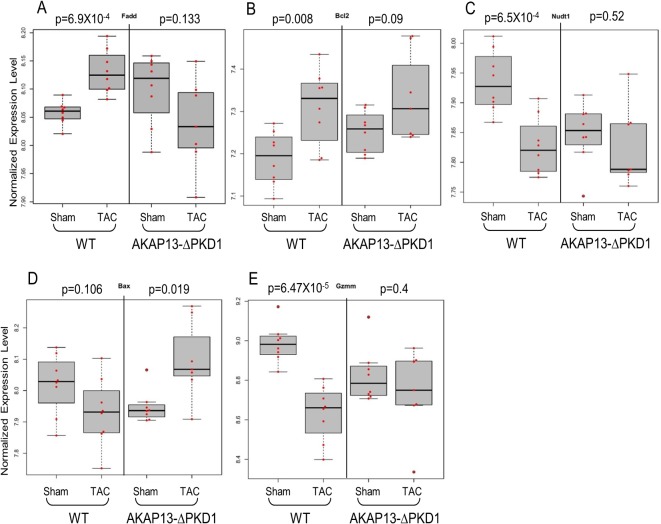
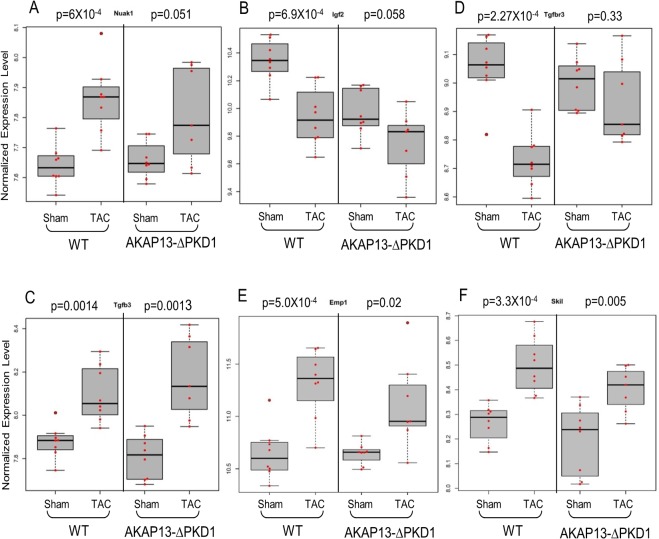
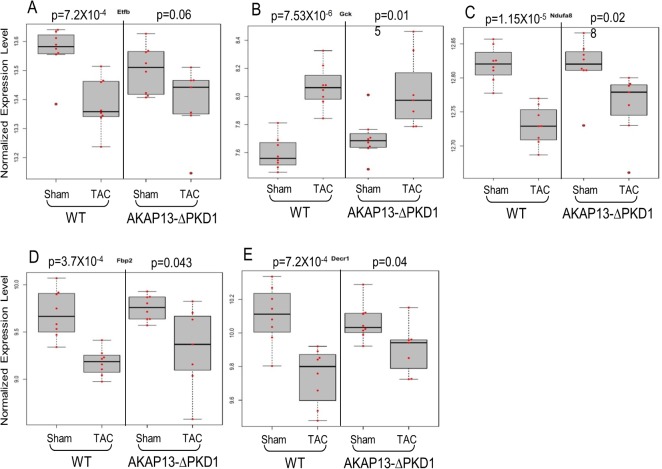
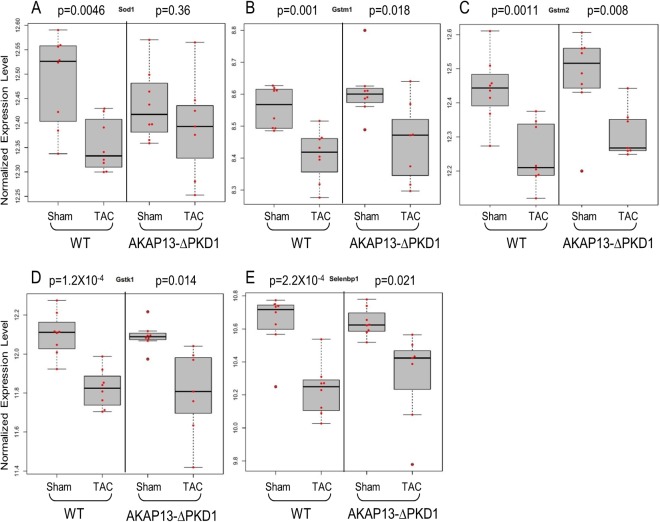
In the heart, scaffolding proteins such as A-Kinase Anchoring Proteins (AKAPs) play a crucial role in normal cellular function by serving as a signaling hub for multiple protein kinases including protein kinase D1 (PKD1). Under cardiac hypertrophic conditions AKAP13 anchored PKD1 activates the transcription factor MEF2 leading to subsequent fetal gene activation and hypertrophic response. We used an expression microarray to identify the global transcriptional response in the hearts of wild-type mice expressing the native form of AKAP13 compared to a gene-trap mouse model expressing a truncated form of AKAP13 that is unable to bind PKD1 (AKAP13-ΔPKD1). Microarray analysis showed that AKAP13-ΔPKD1 mice broadly failed to exhibit the transcriptional profile normally associated with compensatory cardiac hypertrophy following trans-aortic constriction (TAC). The identified differentially expressed genes in WT and AKAP13-ΔPKD1 hearts are vital for the compensatory hypertrophic response to pressure-overload and include myofilament, apoptotic, and cell growth/differentiation genes in addition to genes not previously identified as affected by AKAP13-anchored PKD1. Our results show that AKAP13-PKD1 signaling is critical for transcriptional regulation of key contractile, cell death, and metabolic pathways during the development of compensatory hypertrophy in vivo.


Conflict of interest statement

Competing Interests: The authors have declared that no competing interests exist.

Figures

Fig 1
Fig 1. Volcano plot comparative expression analysis of WT and AKAP13-∆PKD1 Sham and TAC mice.
The x-axis is the fold-change and the Y-axis is p-value in–log10 scale computed using program R. A) The expression of 6 genes were significantly changed in AKAP13-∆PKD1 sham mice compared to wild type sham mice, 4 genes were down-regulated (Crsp 3, Prkab1, Rccd1, and Zfp592) and 2 were up-regulated (Sertad 3 and Lrtm1). Red dots indicate significant changes in gene expression while black dots are not significant. B) The expression of 479 probes was significantly changed (>2.5-fold) in WT-TAC mice compared to WT-Sham mice (p<0.05). A total of 204 probes were up-regulated and 275 were down-regulated. C) The expression of 10 probes were significantly changed (>2.5-fold) in AKAP13-∆PKD1-TAC mice compared to AKAP13-∆PKD1 sham mice (p<0.05). A total of 5 probes were up-regulated and 5 were down-regulated.
Fig 2
Fig 2. IPA Network analysis of differentially regulated genes.
A top modified gene network modified in WT-TAC mice that is not modified in AKAP13-∆PKD1 mice is cell death and survival, cell movement, and organismal development. Genes shaded in red are up-regulated while genes shaded in green are down-regulated.
Fig 3
Fig 3. IPA Network analysis of differentially regulated genes.
A top modified gene network modified in WT-TAC mice that is not modified in AKAP13-∆PKD1 mice is cardiovascular system development, tissue morphology and cell movement. Genes shaded in red are up-regulated while genes shaded in green are down-regulated.
Fig 4
Fig 4. IPA Network analysis of differentially regulated genes.
A top modified gene network modified in WT-TAC mice that is not modified in AKAP13-∆PKD1 mice is drug metabolism, protein synthesis, and neurological disease. Genes shaded in red are up-regulated while genes shaded in green are down-regulated.
Fig 5
Fig 5. IPA Network analysis of differentially regulated genes.
A top modified gene network modified in WT-TAC mice that is not modified in AKAP13-∆PKD1 mice is lipid metabolism, molecular transport, and small molecule biochemistry. Genes shaded in red are up-regulated while genes shaded in green are down-regulated.
Fig 6
Fig 6. IPA network analysis of differentially regulated genes.
A top modified gene network modified in WT-TAC mice that is not modified in AKAP13-∆PKD1 mice is neurological disease, psychological disorders, skeletal and muscular disorders. Genes shaded in red are up-regulated while genes shaded in green are down-regulated.
Fig 7
Fig 7. Functional gene networks and associated functions and diseases modified following TAC-induction in WT hearts but not in AKAP13-ΔPKD1 TAC hearts.
Fig 8
Fig 8. Myofilament Gene expression stratified by WT or AKAP13-∆PKD1 mice following sham or TAC surgery.
Normalized (log-transformed) gene expression is shown for myofilament proteins A) Desmin (Des), B) Myosin binding protein C-2 (MybpC2), C) Troponin T1 (Tnnt1), D) Myosin binding protein C-3, E) Popeye protein-3 (Popcd3), and F) Ankyrin repeat domain 23 (Ankrd23). Gray boxes represent the interquartile range, encompassing the first through third quartiles; the horizontal bar shows the median value. Values greater than 1.5 times the interquartile range are plotted outside of the whiskers. P values are from linear regression assuming an additive model.
Fig 9
Fig 9. Apoptosis Gene expression stratified by WT or AKAP13-∆PKD1 mice following sham or TAC surgery.
Normalized gene expression is shown for apoptosis-associated genes A) Fas-associated death domain (FADD), B) Bcl2, C) Nudt1 D) Bax, E) Granzyme M (Gzmm), and F) Dynamin-1 like protein. Gray boxes represent the interquartile range, encompassing the first through third quartiles; the horizontal bar shows the median value. Values greater than 1.5 times the interquartile range are plotted outside of the whiskers. P values are from linear regression assuming an additive model.
Fig 10
Fig 10. Cell Growth/Differentiation Gene expression stratified by WT or AKAP13-∆PKD1 mice following sham or TAC surgery.
Normalized gene expression is shown for cellular growth and differentiation genes A) Nuak1, B) Igf2, C) TgfβR-3 D), Tgfβ-3 E), Emp1 and F) Skil. Gray boxes represent the interquartile range, encompassing the first through third quartiles; the horizontal bar shows the median value. Values greater than 1.5 times the interquartile range are plotted outside of the whiskers. P values are from linear regression assuming an additive model.
Fig 11
Fig 11. Metabolism gene expression stratified by WT or AKAP13-∆PKD1 mice following sham or TAC surgery.
Normalized gene expression is shown for cellular metabolism-associated genes A) Etfb, B) Gck, C) Ndufa8, D) Fbp2, E) Decr1. Gray boxes represent the interquartile range, encompassing the first through third quartiles; the horizontal bar shows the median value. Values greater than 1.5 times the interquartile range are plotted outside of the whiskers. P values are from linear regression assuming an additive model.
Fig 12
Fig 12. Oxidative stress gene expression stratified by WT or AKAP13-∆PKD1 mice following sham or TAC surgery.
Normalized gene expression is shown for oxidative stress response-associated genes A) Sod1, B) Gstm1, C) Gstm2, D) Gstk1, and E) Selenbp1. Gray boxes represent the interquartile range, encompassing the first through third quartiles; the horizontal bar shows the median value. Values greater than 1.5 times the interquartile range are plotted outside of the whiskers. P values are from linear regression assuming an additive model.

References

    1. Chien KR. Stress pathways and heart failure. Cell. 1999;98(5):555–8. Epub 1999/09/18. doi: S0092-8674(00)80043-4 [pii]. . - PubMed
    1. Marks AR. A guide for the perplexed: towards an understanding of the molecular basis of heart failure. Circulation. 2003;107(11):1456–9. Epub 2003/03/26. . - PubMed
    1. Olson EN, Schneider MD. Sizing up the heart: development redux in disease. Genes Dev. 2003;17(16):1937–56. Epub 2003/08/02. 10.1101/gad.11101031110103 [pii]. . - DOI - PubMed
    1. Bassel-Duby R, Olson EN. Signaling pathways in skeletal muscle remodeling. Annu Rev Biochem. 2006;75:19–37. Epub 2006/06/08. 10.1146/annurev.biochem.75.103004.142622 . - DOI - PubMed
    1. Rajabi M, Kassiotis C, Razeghi P, Taegtmeyer H. Return to the fetal gene program protects the stressed heart: a strong hypothesis. Heart Fail Rev. 2007;12(3–4):331–43. Epub 2007/05/23. 10.1007/s10741-007-9034-1 . - DOI - PubMed

Publication types

MeSH terms

LinkOut - more resources