. 2015 Sep;47(9):1038-1046.
doi: 10.1038/ng.3357. Epub 2015 Jul 20.

Whole-genome sequencing provides new insights into the clonal architecture of Barrett's esophagus and esophageal adenocarcinoma

Collaborators, Affiliations

Whole-genome sequencing provides new insights into the clonal architecture of Barrett's esophagus and esophageal adenocarcinoma

Caryn S Ross-Innes et al. Nat Genet. 2015 Sep.

Abstract

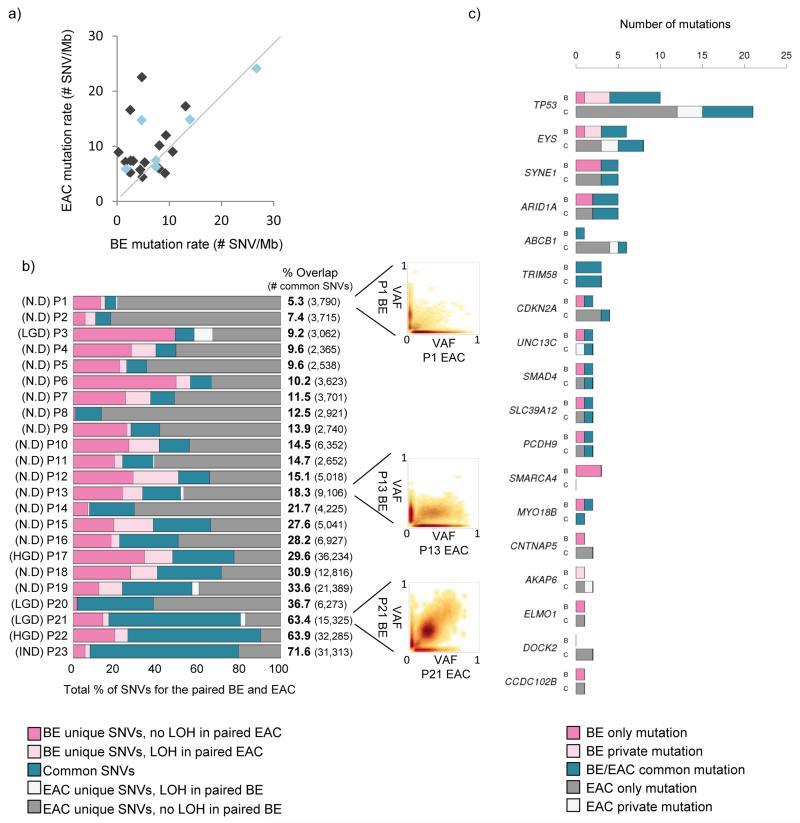
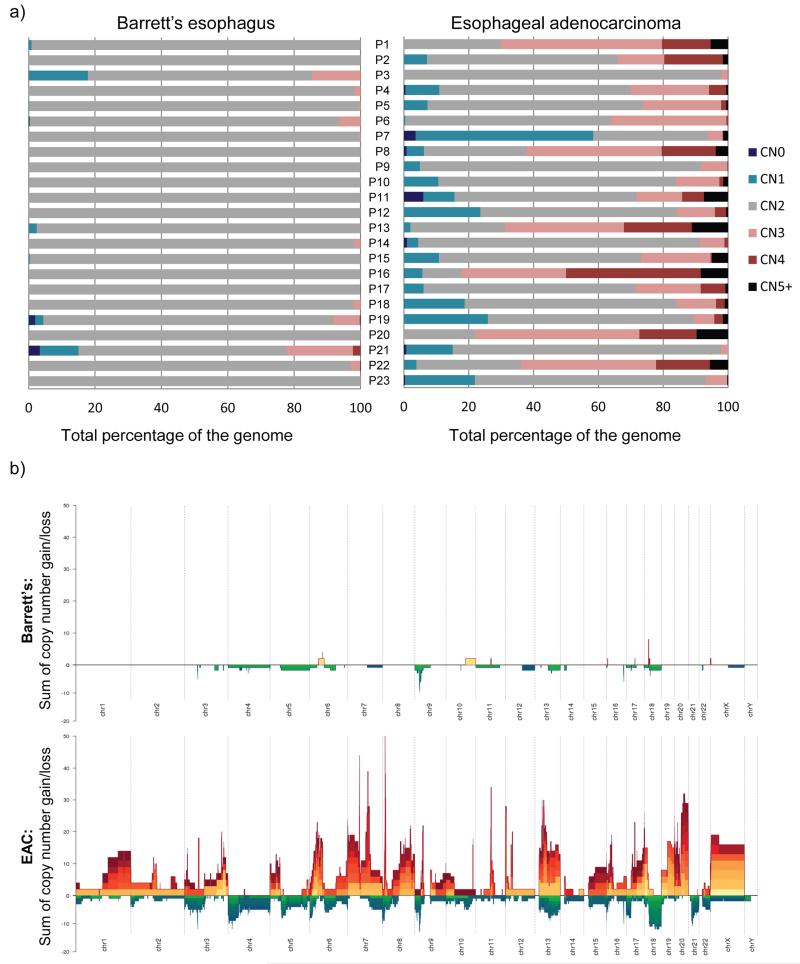
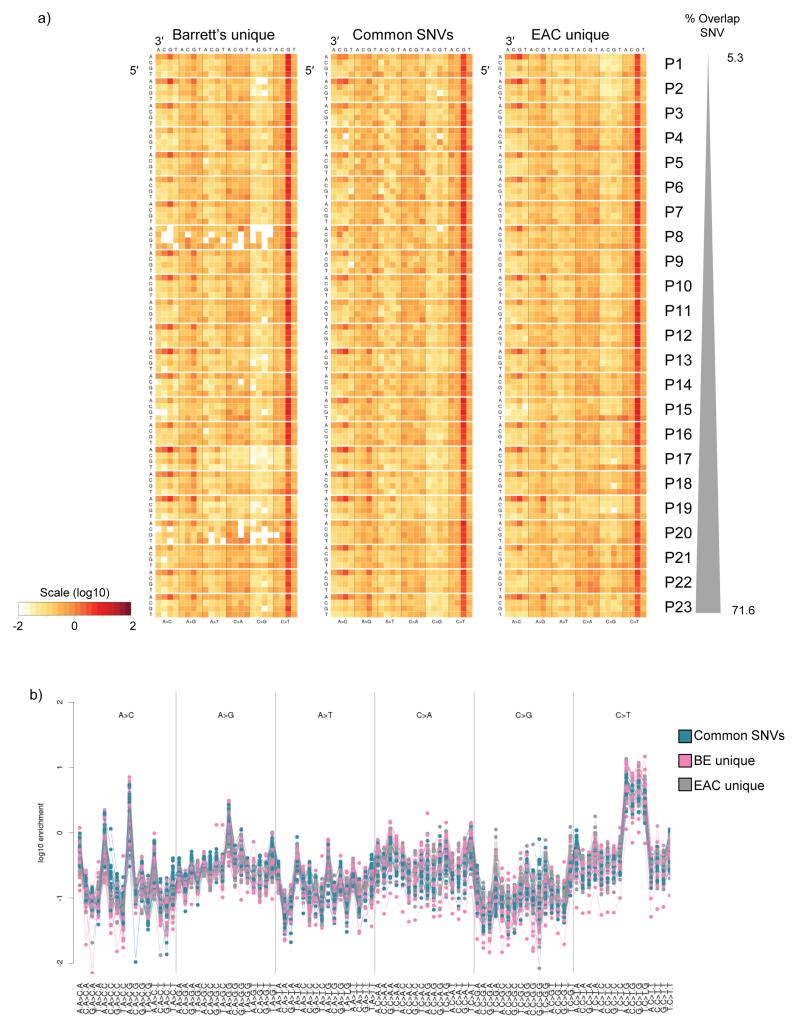
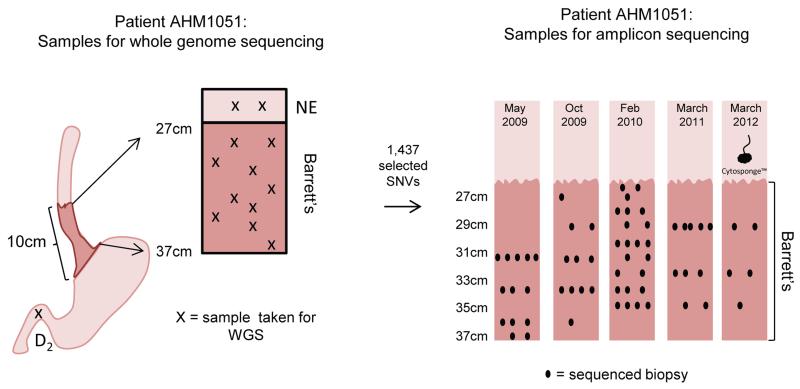
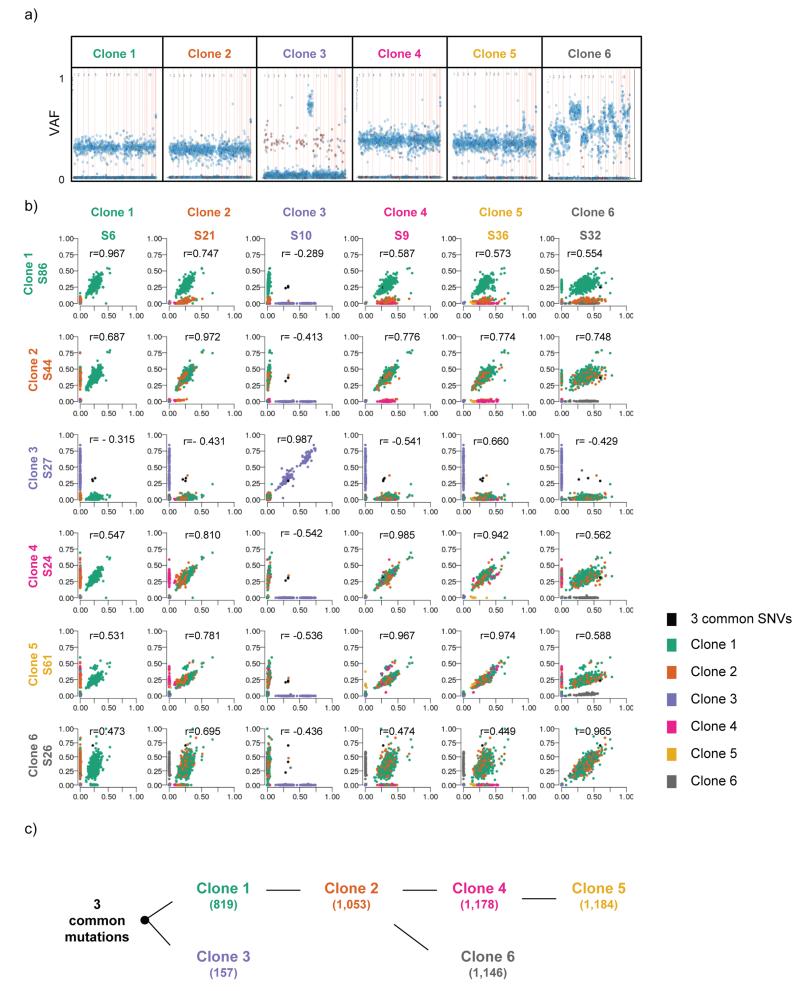
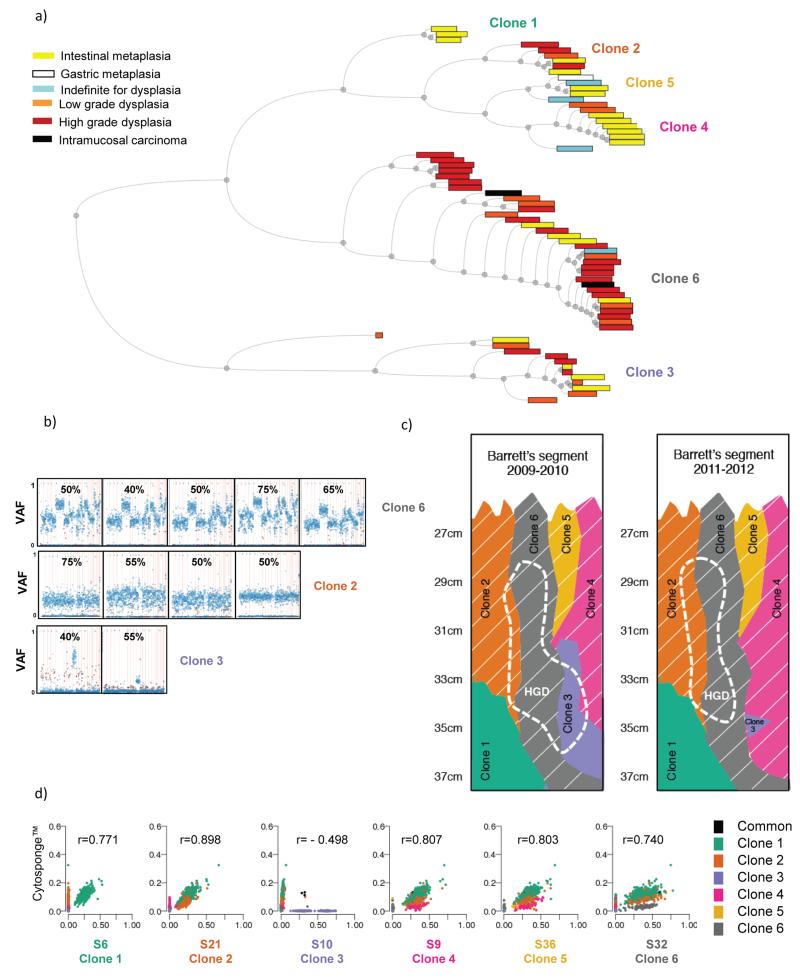
The molecular genetic relationship between esophageal adenocarcinoma (EAC) and its precursor lesion, Barrett's esophagus, is poorly understood. Using whole-genome sequencing on 23 paired Barrett's esophagus and EAC samples, together with one in-depth Barrett's esophagus case study sampled over time and space, we have provided the following new insights: (i) Barrett's esophagus is polyclonal and highly mutated even in the absence of dysplasia; (ii) when cancer develops, copy number increases and heterogeneity persists such that the spectrum of mutations often shows surprisingly little overlap between EAC and adjacent Barrett's esophagus; and (iii) despite differences in specific coding mutations, the mutational context suggests a common causative insult underlying these two conditions. From a clinical perspective, the histopathological assessment of dysplasia appears to be a poor reflection of the molecular disarray within the Barrett's epithelium, and a molecular Cytosponge technique overcomes sampling bias and has the capacity to reflect the entire clonal architecture.


Figures

Figure 1
Figure 1. Paired Barrett’s and EAC samples have a varied overlap
a) Scatter plot comparing the mutation rate between paired Barrett’s and EAC samples. Light blue dots indicate Barrett’s samples with some degree of dysplasia present. b) Diagram showing percentage overlap between SNVs in paired Barrett’s and EAC samples, including highlighting SNVs that lie in areas of LOH in the reciprocal sample. Barrett’s unique SNVs that lie in an area of LOH in the paired EAC sample are shown in light pink and EAC unique SNVs that lie in a region of LOH in the paired Barrett’s sample are shown in white. Samples are ranked according to their degree of overlap, from poor to good. Scatter plots illustrating an example of a poor overlap (patient P1), a fair overlap (patient P13) and a good overlap (patient P21) are shown. c) Bar graph showing genes that were found to be recurrently mutated in previous EAC sequencing studies, and are mutated in at least two patients in our Barrett’s-EAC cohort (SNVs or indels). For each gene of interest the data for the Barrett’s samples are in the bar labelled “B” and for cancer samples in the bar labelled “C”. Mutations that are common to both paired Barrett’s and EAC samples (shown in teal), as well as mutations that are Barrett’s unique (dark pink) or EAC unique (dark grey) are shown. Also shown are mutations in the same gene that have a different base pair change between paired Barrett’s and EAC samples (called “private mutations”).
Figure 2
Figure 2. EAC samples display multiple copy number changes compared to paired Barrett’s esophagus samples
a) Graphs showing the percentage of the genome at different copy number states for each patient (P) in turn (P1-23) for their paired Barrett’s esophagus (left hand graph) and EAC samples (right hand graph). CN0 = copy number 0, CN1 = copy number 1, CN2 = copy number 2, CN3 = copy number 3, CN4 = copy number 4, CN5+ = at least copy number 5. b) Stacked mountain plots summarizing copy number variation within all of the 23 Barrett’s esophagus and EAC samples. Gains of at least two copies on top of the normal copy number in that region are illustrated by yellow-orange-red mountains and deletions are represented by green-blue valleys. The height or depth of the mountain or valley indicates the summed copy number status across all patients for that region. The colors represent different samples so that the higher the number of different colors in a region, the higher the number of samples that display that copy number change.
Figure 3
Figure 3. The mutational context is similar in both early and late SNVs
a) Heat map showing the log-transformed values representing the fraction of each mutation type at each trinucleotide mutation context corrected for the frequency of each trinucleotide in the reference genome, as described in Nik-Zainal et al. The mutational contexts were calculated separately for the three subsets of SNVs per patient, i.e. 1. Barrett’s unique and not in EAC LOH, 2. common to Barrett’s esophagus and EAC, and 3. EAC unique and not in Barrett’s esophagus LOH. b) Mutational context plotted as a dot plot showing the enrichment of the trinucleotide mutational context information for every possible option for all 23 paired Barrett’s esophagus and EAC samples.
Figure 4
Figure 4. Summary of the samples sequenced for patient AHM1051
Ten Barrett’s esophagus samples (depicted by crosses on patient AHM1051’s Barrett’s segment) representing all stages along the progression sequence from Barrett’s esophagus with no dysplasia to intramucosal adenocarcinoma, as well as two normal esophageal squamous (NE) and one duodenum (D2) sample were sequenced (whole-genome sequencing, WGS). From the WGS data, 1,437 SNVs were assessed on additional FFPE samples taken from multiple different endoscopies across the full length of the 10cm Barrett’s esophagus segment between May 2009 and March 2012. The biopsy samples selected for amplicon sequencing are shown using black dots (positions of the biopsies along the x-axis are for illustration only and hold no extra information). One Cytosponge sample taken in March 2012 was also included in the amplicon sequencing.
Figure 5
Figure 5. Six distinct clones are present within patient AHM1051’s non-dysplastic Barrett’s esophagus
a) Variant allele fraction (VAF) plot representing an example sample of the six distinct clones. The 1,437 assessed SNVs are represented by dots within the chart. The SNVs are ordered on the x-axis according to their genomic location (from chr1 to sex chromosomes). The y-axis represents the VAF for each mutation for that sample. The blue dots represent intergenic or intronic SNVs and the red dots represent coding SNVs. b) Scatter plots showing the correlation between two different representative samples within the same clone as well as compared to two different samples from every other clone. The sample names (e.g. S6 (sample 6)) are given under the different clone headings. Each dot within the scatter plot represents one of the 1,437 assessed SNVs and the dots are coloured according to the different clones the SNVs belong to. The r value represents the Pearson correlation. c) Diagram representing the clonal ordering within patient AHM1051’s Barrett’s esophagus segment. The numbers in brackets represent the number of SNVs (out of a total of 1,437 that were assessed) that are present in each of the clones.
Figure 6
Figure 6. Multiple different clones can give rise to dysplasia
a) Hierarchical tree showing all samples processed for amplicon re-sequencing. Within the tree, samples are paired according to their Pearson correlation score. The distance between pairs is represented by the horizontal distance between the pair and their parent node. There is no information embedded in the vertical distance of this tree. The colors of the boxes represent the histopathological grade for each of the Barrett’s esophagus samples. The width of the boxes is proportional to the number of SNVs with VAF>0.01 in each sample. The clones represented by the six different branches are noted. b) VAF plots as described in Figure 5a showing examples of samples that contain ≥40% high grade dysplasia (as determined by the average between two expert upper gastrointestinal pathologists) within the sample and grouped according to which clones they represent. The number at the top of each graph indicates the percentage of high grade dysplasia in that specific sample, as assessed by two expert gastrointestinal pathologists. c) Illustration depicting the clonal arrangement in patient AHM1051’s Barrett’s esophagus segment before (2009-2010) and after (2011-2012) endoscopic treatment. The region corresponding to high grade dysplasia, before and after treatment, is shown using a dashed line. The clones containing the widely-spread TP53 mutation are indicated by thin, slanted, white lines. d) Scatter plots indicating the correlation between SNVs identified in the DNA from cells collected using the Cytosponge compared with the six different clones. The r value represents the Pearson correlation.

Comment in

References

    1. Nik-Zainal S, et al. The life history of 21 breast cancers. Cell. 2012;149:994–1007. - PMC - PubMed
    1. Esserman LJ, et al. Addressing overdiagnosis and overtreatment in cancer: a prescription for change. Lancet Oncol. 2014;15:e234–42. - PMC - PubMed
    1. Desai TK, et al. The incidence of oesophageal adenocarcinoma in non-dysplastic Barrett’s oesophagus: a meta-analysis. Gut. 2012;61:970–6. - PubMed
    1. Corley DA, et al. Impact of endoscopic surveillance on mortality from Barrett’s esophagus-associated esophageal adenocarcinomas. Gastroenterology. 2013;145:312–9 e1. - PMC - PubMed
    1. Shaheen NJ, Hur C. Garlic, silver bullets, and surveillance upper endoscopy for Barrett’s esophagus. Gastroenterology. 2013;145:273–6. - PubMed

Methods-only references

    1. Raczy C, et al. Isaac: ultra-fast whole-genome secondary analysis on Illumina sequencing platforms. Bioinformatics. 2013;29:2041–3. - PubMed
    1. Saunders CT, et al. Strelka: accurate somatic small-variant calling from sequenced tumor-normal sample pairs. Bioinformatics. 2012;28:1811–7. - PubMed
    1. Gusnanto A, Wood HM, Pawitan Y, Rabbitts P, Berri S. Correcting for cancer genome size and tumour cell content enables better estimation of copy number alterations from next-generation sequence data. Bioinformatics. 2012;28:40–7. - PubMed

Publication types

Supplementary concepts

LinkOut - more resources