. 2015 Sep;47(9):1047-55.
doi: 10.1038/ng.3343. Epub 2015 Jul 20.

Paired exome analysis of Barrett's esophagus and adenocarcinoma

Affiliations

Paired exome analysis of Barrett's esophagus and adenocarcinoma

Matthew D Stachler et al. Nat Genet. 2015 Sep.

Abstract

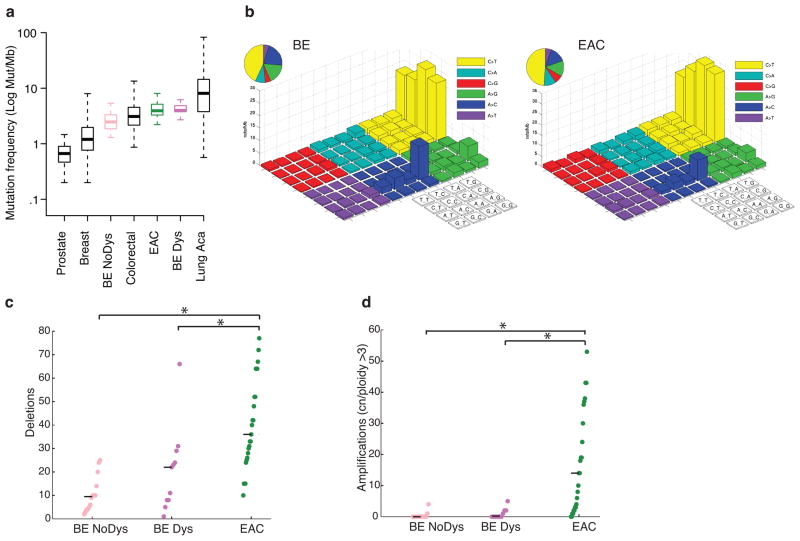
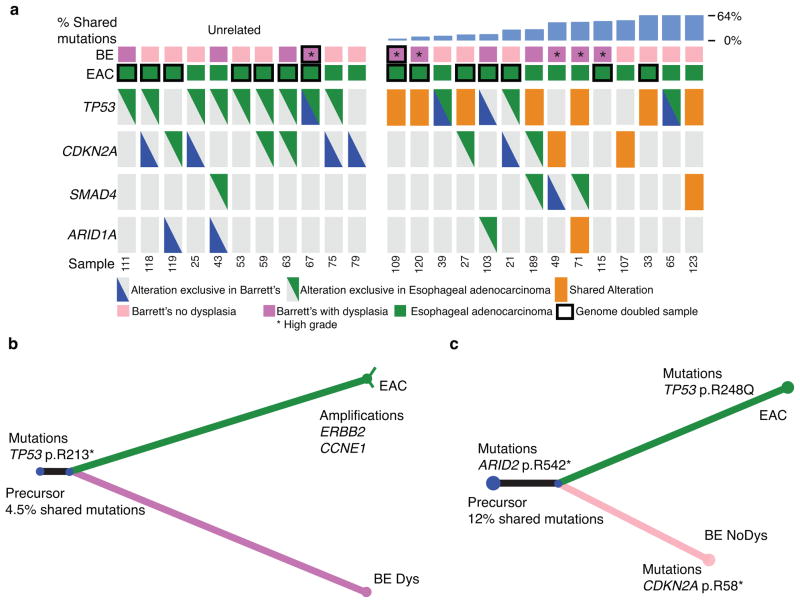
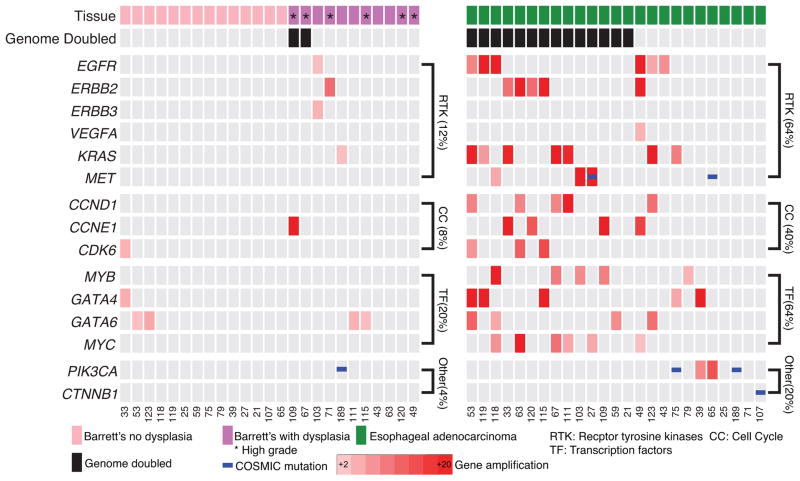
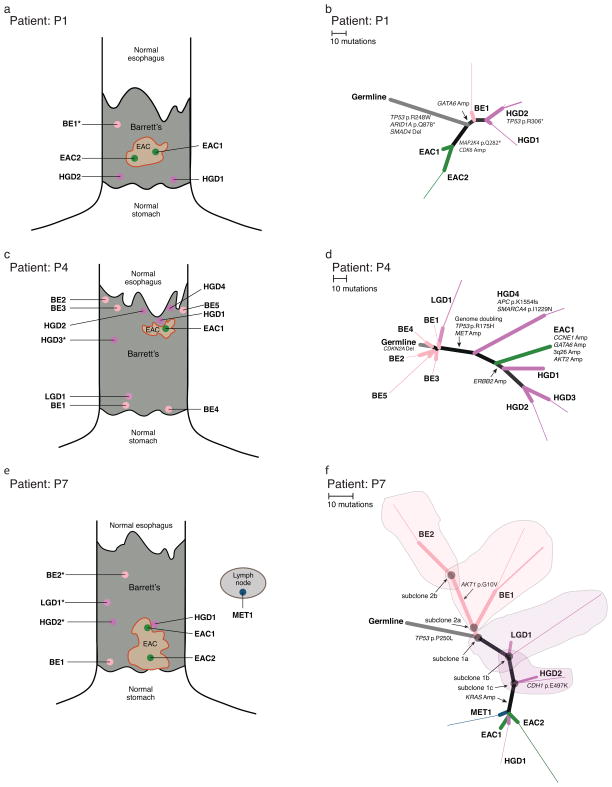
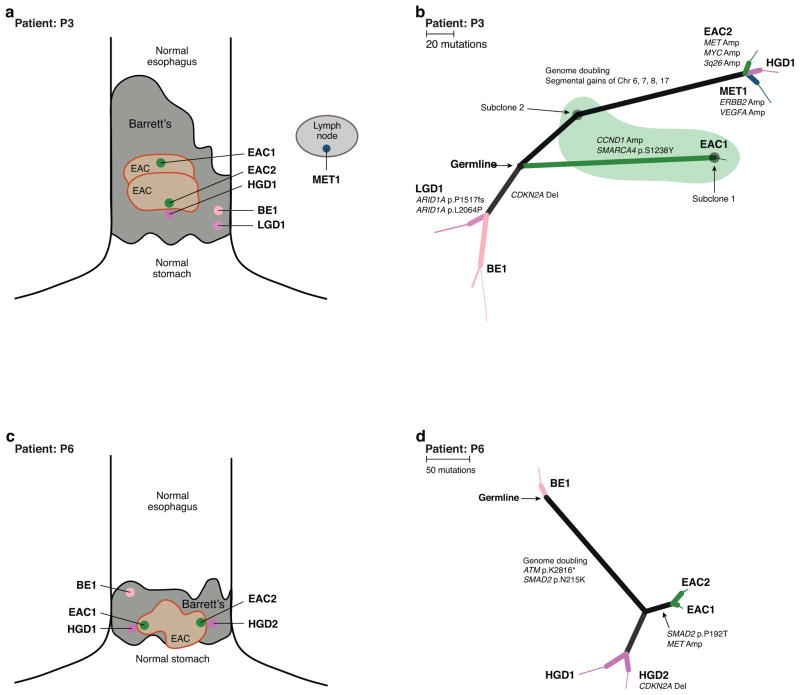
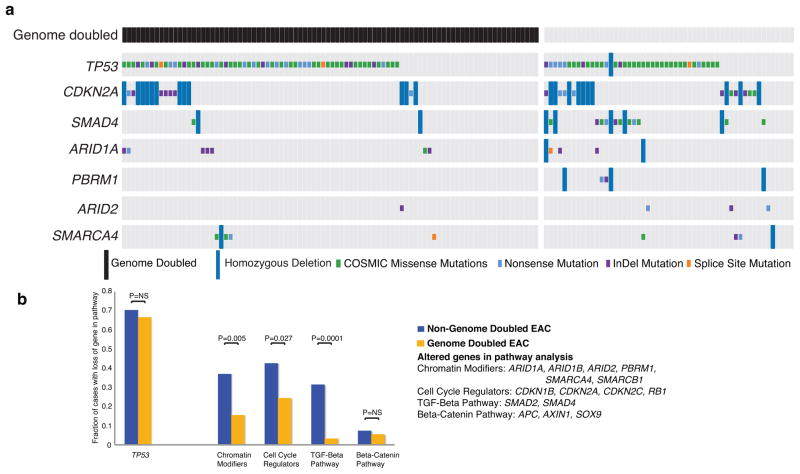
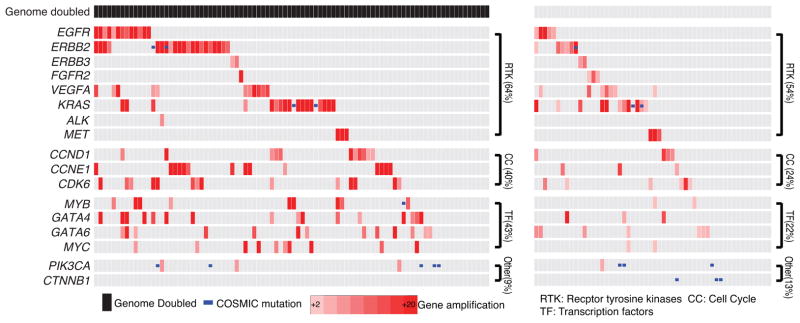
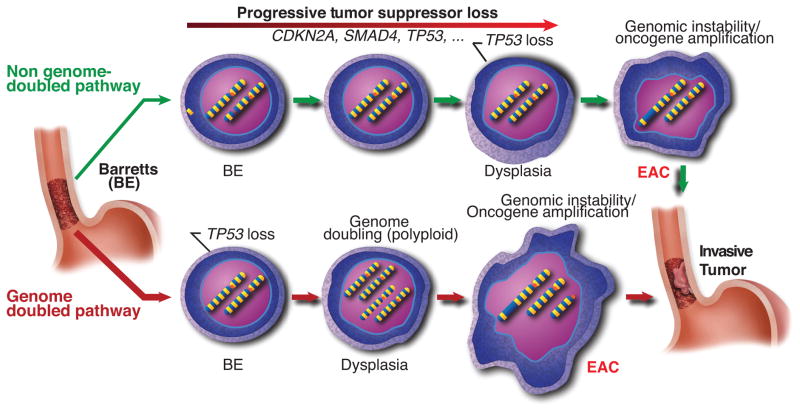
Barrett's esophagus is thought to progress to esophageal adenocarcinoma (EAC) through a stepwise progression with loss of CDKN2A followed by TP53 inactivation and aneuploidy. Here we present whole-exome sequencing from 25 pairs of EAC and Barrett's esophagus and from 5 patients whose Barrett's esophagus and tumor were extensively sampled. Our analysis showed that oncogene amplification typically occurred as a late event and that TP53 mutations often occurred early in Barrett's esophagus progression, including in non-dysplastic epithelium. Reanalysis of additional EAC exome data showed that the majority (62.5%) of EACs emerged following genome doubling and that tumors with genomic doubling had different patterns of genomic alterations, with more frequent oncogenic amplification and less frequent inactivation of tumor suppressors, including CDKN2A. These data suggest that many EACs emerge not through the gradual accumulation of tumor-suppressor alterations but rather through a more direct path whereby a TP53-mutant cell undergoes genome doubling, followed by the acquisition of oncogenic amplifications.


Conflict of interest statement

Conflict of Interest Statement: The authors report no conflict of interest

Competing Financial Interests:

The authors declare no competing financial interests.

Figures

Figure 1
Figure 1. Barrett’s esophagus has a mutation frequency comparable to many invasive cancers but shows few genomic amplifications
a) Mutation density (mutations per Mb of sequenced exome) of Barrett’s (BENoDys), Barrett’s with dysplasia (BEDys), and esophageal adenocarcinoma (EAC) compared to several other invasive cancers. Mutation density displayed on a logarithmic scale. Box plot shows the median, limited by the 25th (Q1) 75th (Q3) percentiles, with the upper and lower whiskers denoting the extreme most data point within Q_3 + 1.5*IQR or Q_1 – 1.5*IQR respectively. N = 133 for prostate, 889 for breast, 14 for BE NoDys, 233 for colorectal, 141 for EAC, 11 for BEDys, and 401 for lung. b) “Lego” plots of mutation frequencies across 25 Barrett’s samples (left) and esophageal adenocarcinoma (right). Base substitutions are divided into six categories to represent the six possible base changes (each category represented by a different color). Substitutions are further divided by the 16 possible flanking nucleotides surrounding the mutated base as listed in the corresponding box legend. The inset pie chart indicates the distribution of all mutations for a given base. c) Mean number of deletions per sample. d) Mean number of amplifications per sample. * denotes statistically significant difference (P <0.05).
Figure 2
Figure 2. Paired analysis reveals early-shared TP53 alterations
a) Tumor suppressor plot showing both mutations (heterozygous or homozygous) and homozygous deletions of 4 commonly altered tumor suppressor genes in the BE samples and their paired EAC. Patients are separated into cases where the BE and EAC samples are clonally unrelated (left) or clonally related (right) with ordering by increasing percent of shared mutations. Orange box indicates alterations that were shared between the two samples whereas the triangles represent alterations private to either the BE or EAC. Sample EAC 71 contained both a shared ARID1A alteration and an exclusive ARID1A alteration. Black bordered boxes denote samples that have undergone genome doubling and * denotes samples suggestive of high-grade dysplasia. b) Example of evolutionary “tree” where despite only sharing a small percentage of overall mutations a TP53 mutation was found to be one of the early shared events. The lengths of the lines represent that number of mutations in common to this branch according to scale. Thin lines denote alterations with CCF<1. c) Example of evolutionary “tree” where a CDKN2A mutation occurred late in the Barrett’s sample after the clone that went on to develop into an invasive cancer already split off. * denotes samples suggestive of high-grade dysplasia.
Figure 3
Figure 3. Paired analysis reveals a lack of oncogene amplification in BE samples
Amplification plot showing amplified oncogenes, mutations, and pathways in BE compared to EAC with the genomic doubling status of samples and the presence or absence of dysplasia in the BE marked. * denotes samples suggestive of high-grade dysplasia.
Figure 4
Figure 4. Spatial and phylogenic relationship of multiple sampled areas where all samples within a patient share a common set of genomic alterations
a, c, e) Diagram showing relative location of samples isolated for genomic analysis. Samples immediately adjacent to each other were isolated on the same block. Specimens marked with an asterisk did not contain enough information to be properly located. Size of BE and EAC roughly proportional to the reported BE length and tumor size. b, d, f) Phylogenic trees displaying the relationship of subclones detected in each tissue sample. Branch lengths are proportional to the number of somatic point-mutations occurring on that branch. For mutations detected in a single sample, the thickness of the branch is proportional to the CCF of the mutations in that sample. Starting at the germline, light gray branches represent acquired alterations shared by all samples from a given patient. b) P1 shows aTP53 mutation shared with all samples as well as a CDK6 amplification only seen in the EAC samples. d) P4 shows a shared CDKN2A deletion in all samples with TP53 mutation, whole genome doubling (WGD), and oncogene amplification in the highly related high-grade dyplasia and cancer samples. f) P7 shows a TP53 mutation shared across all samples and KRAS amplification only found in the cancer and a single focus of adjacent HGD. Shaded areas contain the subclones present in the corresponding tissue samples.
Figure 5
Figure 5. Spatial and phylogenic relationship of multiple sampled areas in patients showing distinct clonal evolution
a, c) Diagram of sample location and diagnosis within the patient’s field of BE. Size of BE and EAC roughly proportional to the reported BE length and tumor size. Specimens marked with an asterisk did not contain enough information to be properly located. b, d) Phylogenic trees displaying the relationship of subclones detected in each tissue sample. Branch lengths are proportional to the number of somatic point-mutations occurring on that branch. For mutations detected in a single sample, the thickness of the branch is proportional to the CCF of the mutations in that sample. Black circles mark the starting point (germline) as there were no somatic alterations common to all samples. b) P3 shows three distinct clonally unrelated branches. The branch with BE2/LGD1 shows a CDKN2A deletion in the BE and LGD samples only. The green shaded region represents tissue sample EAC1, which contained a mixture of distinct cell populations, subclones 1 and 2. d) P6 shows a region of BE tissue unrelated to the other high-grade and cancer samples, all of which share ATM and SMAD2 mutations and WGD.
Figure 6
Figure 6. Tumor suppressor gene alterations are more common in non-genome doubled EAC
a) Representation of alterations of common tumor suppressors in a larger cohort of EAC samples showing truncating mutations, missense mutations of hotspot site (as determined by presence in the COSMIC repository at least 3 times) and homozygous deletions. Samples are divided into cases that have undergone genome doubling (left) and those that have not (right). The type of mutation identified is represented by the color of the mutation box. b) Expanded analysis of the fraction of genome doubled and non-genome doubled cases with alterations in the given tumor suppressor pathways (genes in pathway with multiple identified alterations listed on right). Statistically significant differences are highlighted. Genes in the individual pathways are also shown in Supplementary Table 5.
Figure 7
Figure 7. Genome doubled EAC contains more frequent amplifications in cell cycle regulators and transcription factors
Amplification plot showing amplified oncogenes, mutations, and pathways in esophageal adenocarcinoma. Samples are divided into cases that have undergone genome doubling (left) and those that have not (right).
Figure 8
Figure 8. Genome doubled EAC shows a distinct pathway of development
Schematic representation showing two general pathways by which BE can develop into EAC. The top model involves the gradual accumulation of tumor suppressor genes followed by the subsequent activation of oncogenes and development of genomic instability. In the bottom model, TP53 inactivation is acquired as an early event. The sample then undergoes genome doubling, leading to genomic instability, aneuploidy, and oncogene amplification.

Comment in

References

    1. Nehra D, Howell P, Williams CP, Pye JK, Beynon J. Toxic bile acids in gastro-oesophageal reflux disease: influence of gastric acidity. Gut. 1999;44:598–602. - PMC - PubMed
    1. Wild CP, Hardie LJ. Reflux, Barrett’s oesophagus and adenocarcinoma: burning questions. Nat Rev Cancer. 2003;3:676–84. - PubMed
    1. Lagergren J, Bergstromeinhold R, Lingren A, Nyren O. Symptomatic Gastoroesophageal Reflux as a Risk Factor for Esophageal Adenocarcinoma. NEJM. 1999;340:825–831. - PubMed
    1. Ormsby AH, et al. The Location and Frequency of Intestinal Metaplasia at the Esophagogastric Junction in 223 Consecutive Autopsies: Implications for Patient Treatment and Preventive Strategies in Barrett’s Esophagus. Mod Pathol. 2000;6:614–620. - PubMed
    1. Galipeau PC, Prevo LJ, Sanchez Ca, Longton GM, Reid BJ. Clonal Expansion and Loss of Heterozygosity at Chromosomes 9p and 17p in Premalignant Esophageal (Barrett’s) Tissue. JNCI J Natl Cancer Inst. 1999;91:2087–2095. - PMC - PubMed

Publication types

MeSH terms

Substances

Supplementary concepts