

Review
doi: 10.3390/molecules200712913.
68Ga-Based radiopharmaceuticals: production and application relationship
Affiliations
- PMID: 26193247
- PMCID: PMC6332429
- DOI: 10.3390/molecules200712913
Item in Clipboard
Review
68Ga-Based radiopharmaceuticals: production and application relationship
Molecules.
.
Abstract
The contribution of 68Ga to the promotion and expansion of clinical research and routine positron emission tomography (PET) for earlier better diagnostics and individualized medicine is considerable. The potential applications of 68Ga-comprising imaging agents include targeted, pre-targeted and non-targeted imaging. This review discusses the key aspects of the production of 68Ga and 68Ga-based radiopharmaceuticals in the light of the impact of regulatory requirements and endpoint pre-clinical and clinical applications.
Keywords: 68Ga; GMP; chemistry; dosimetry; peptide; positron emission tomography; receptor targeting.
Conflict of interest statement
The author declares no conflict of interest.
Figures
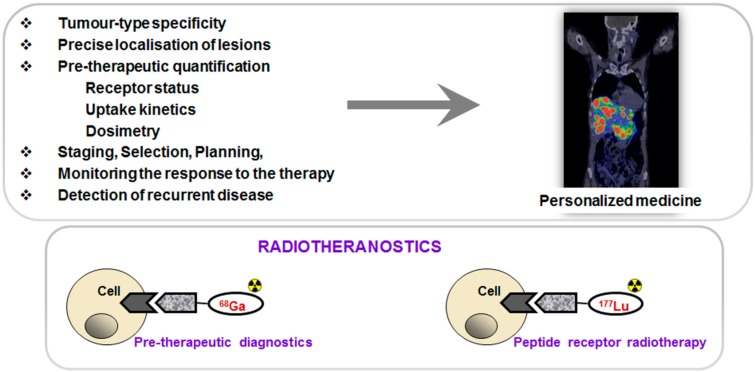
(Upper panel) Peptide receptor targeted imaging and radiotherapy provide personalized and thus more effective and efficient treatment of patients. (Lower panel) Drawing of the interaction of an agent, either imaging if labeled with 68Ga (left) or radiotherapeutic if labeled with 177Lu (right), with the cell receptor.
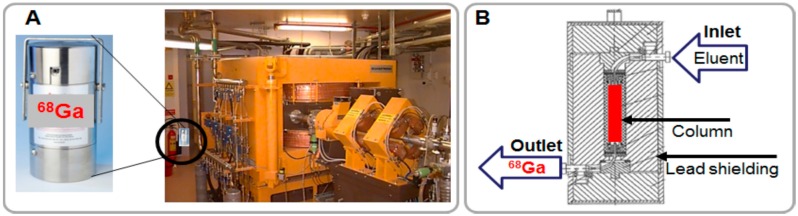
(A) Pictures of a 68Ge/68Ga generator and a cyclotron; (B) Schematic presentation of the cross section of a column-based generator.
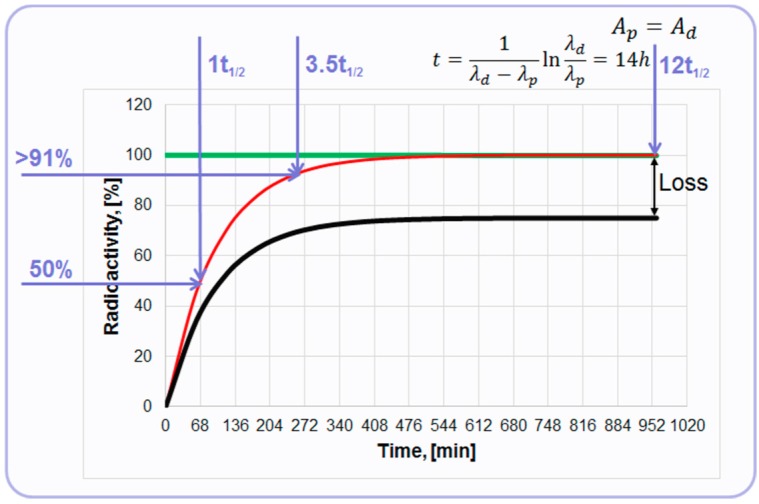
Graph of the secular equilibrium with 68Ge decay and 68Ga accumulation. The green line represents decay of 68Ge described by ; the red line represents ingrowth of 68Ga described by ; and the black line represents accumulation kinetics of 68Ga with correction for hypothetical elution efficiency.
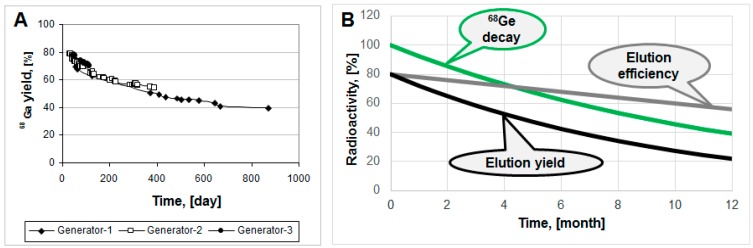
(A) 68Ga elution yield for Generator-1 over 29 months, Generator-2 over 14 months and Generator-3 over three months; (B) Hypothetical graphs representing 68Ge decay, elution efficiency and resulting non-decay corrected elution yield.
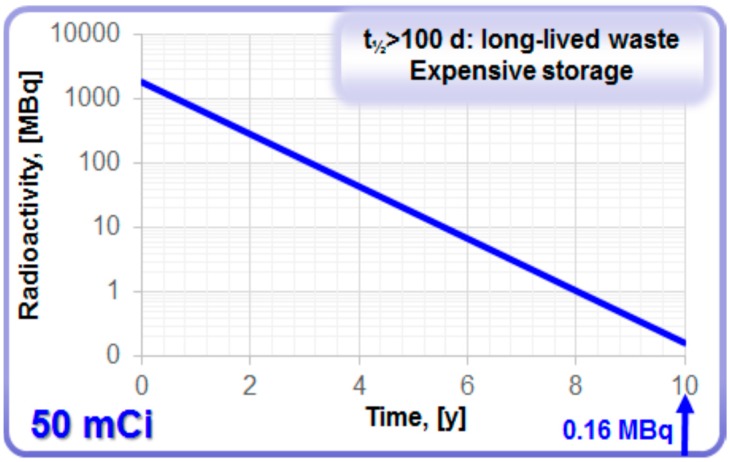
Decay of 68Ge in a generator with loaded radioactivity of 50 mCi.
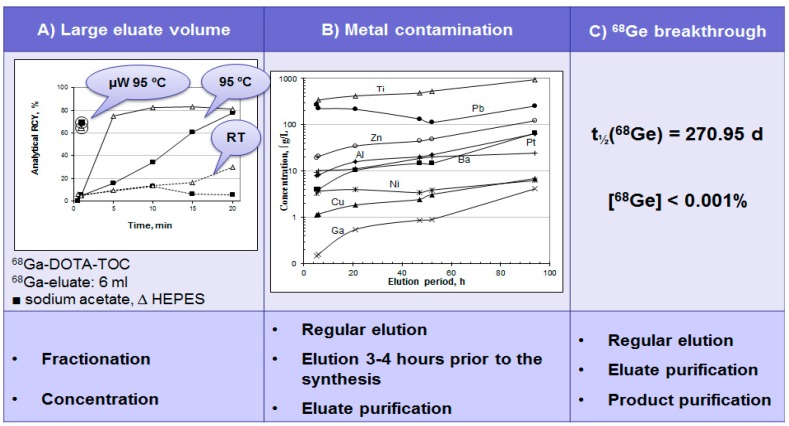
(A) Time course of 68Ga complexation reaction conducted using the full original 68Ga eluate (6 mL) at room temperature (dashed line), conventional heating in a heating block at 95 °C (solid line) and with microwave heating for 1 min at 90 ± 5 °C (circled) for two different buffer systems: ■ sodium acetate buffer, pH = 4.6, 20 nanomoles of DOTA-TOC; ∆ HEPES buffer, pH = 4.2, 20 nanomoles of DOTA-TOC; (B) Metal ion content in 6 mL of the generator eluate as a function of the elution time period; (C) 68Ge breakthrough with respective limit defined in European Pharmacopoeia (Ph. Eur.) monograph and methods for the reduction of the content level in the eluate and final product.
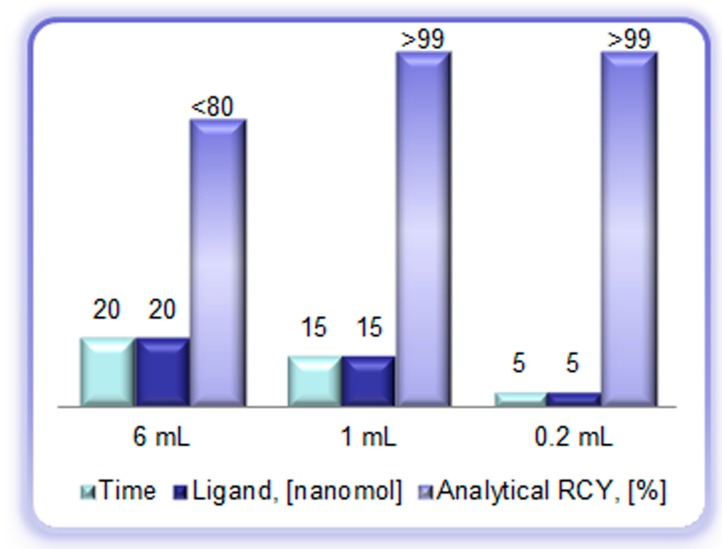
Reaction heating time (min), ligand amount (DOTA-TOC, (nanomole)), and analytical radiochemical yield (%) of the [68Ga]Ga-DOTA-TOC synthesis using full volume of the generator eluate (6 mL), peak fraction of the generator eluate (1 mL), and pre-concentrated/pre-purified generator eluate (0.2 mL, anion exchange method).
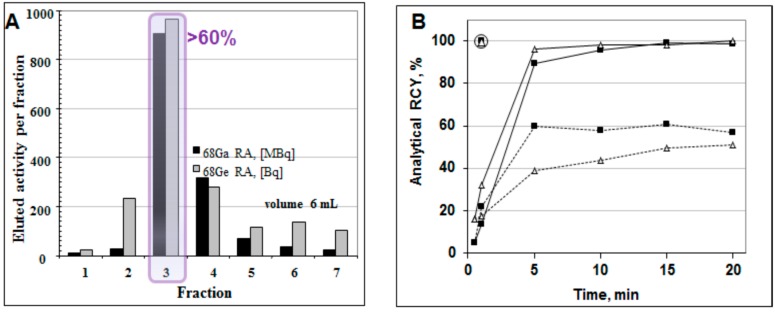
(A) Elution profile of the 68Ge/68Ga generator where one fraction was 1 mL (except for fraction 1 (0.3 mL) and fraction 7 (0.7 mL)), giving a total eluted volume of 6 mL. The profiles for the 68Ga elution and the 68Ge breakthrough are similar; the 68Ge breakthrough is ~10−3%. Fraction 3 (1 mL) contains over 60% of the available 68Ga radioactivity; (B) Time course of 68Ga complexation reaction conducted using 1 mL peak fraction of the generator eluate at room temperature (dashed line), conventional heating at 95 °C in a heating block (solid line), and with microwave heating at 90 ± 5 °C for 1 min (circled) for two different buffer systems: ■ sodium acetate buffer, pH = 4.6, 20 nmol of DOTA-TOC; ∆ HEPES buffer, pH = 4.2, 5 nmol of DOTA-TOC.
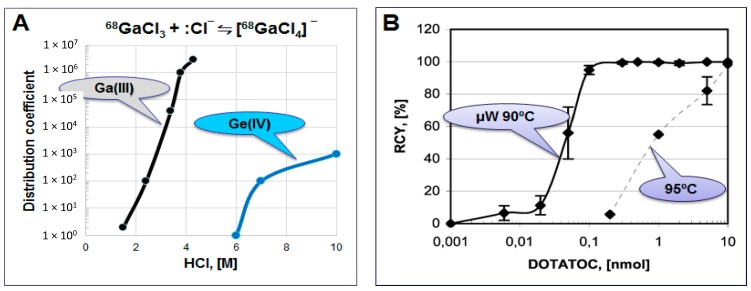
(A) Distribution coefficient D for the adsorption of Ga(III) and Ge(IV) chloride anions on an anion-exchange resin; (B) Influence of the DOTA-TOC amount on the decay-corrected radiochemical yield of the 68Ga complexation reaction in HEPES buffer system using the full available 68Ga radioactivity in 200 µL volume obtained after the pre-concentration and purification step. Solid line: 1 min microwave heating at 90 ± 5 °C, dashed line: 5 min conventional heating at 95 °C.
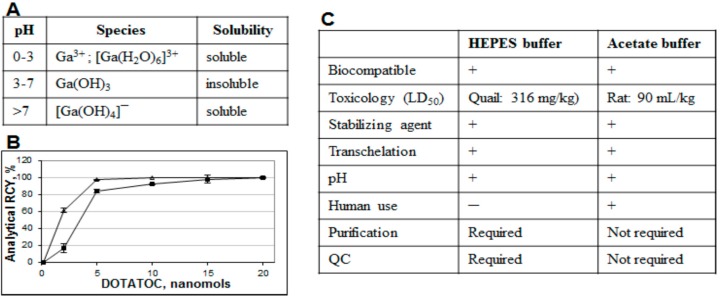
(A) Table showing formation of various species dependent on pH; (B) Influence of the buffering system (■ sodium acetate, ∆ HEPES) on the 68Ga radioactivity incorporation for different DOTA-TOC quantities (1 min microwave heating at 90 ± 5 °C). The reaction was conducted using the 1 mL peak fraction of the original generator eluate; (C) Table comparing characteristics of acetate and HEPES buffers.
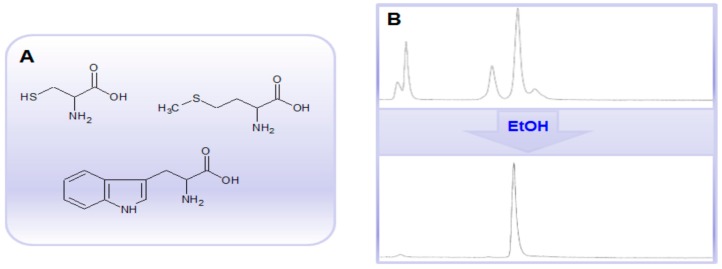
(A) Chemical structures of methionine, tryptophan and cysteine amino acid residues; (B) Radio-HPLC chromatograms of a crude 68Ga-labeled protein comprising ~60 amino acid residues including several tryptophan and methionine amino acid residues without (upper panel) and with (lower panel) ethanol.
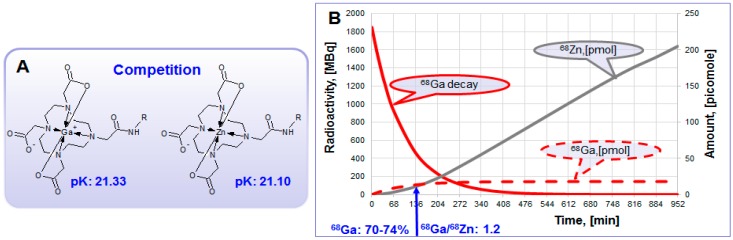
(A) Zn(II) forms thermodynamically stable complex with DOTA derivatives and interferes 68Ga-labeling reaction, especially in the excessively high concentration; (B) Theoretical graphs (50 mCi generator) showing 68Ga decay (MBq) and accumulation of radioactive 68Ga and stable Zn(II) in picomoles within the time frame of secular equilibrium.
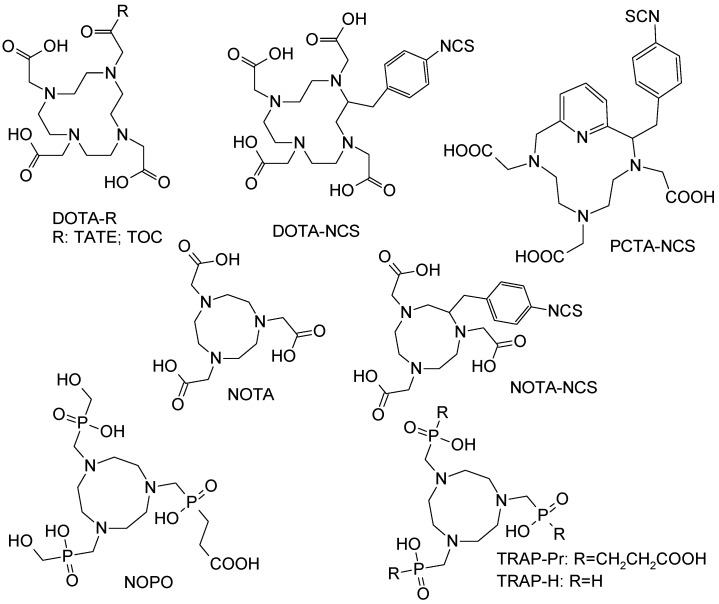
Chemical structures of example macrocyclic chelators and their derivatives that were studied in the competitive complexation reaction with various metal cations.
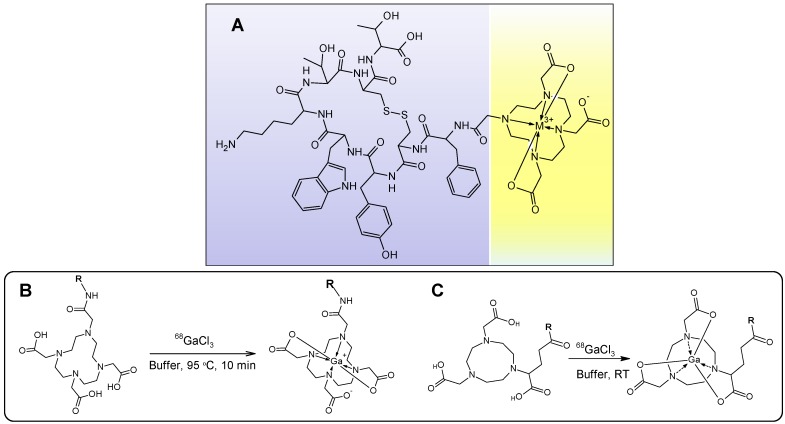
(A) Chemical structure of DOTA-TATE where the biologically active vector peptide (TATE, purple background) is conjugated to DOTA chelate moiety (yellow background) encaging the metal cation; (B,C) schematic presentation of 68Ga-labeling , respectively, with DOTA- and NOTA-based ligands, where R stands for a macromolecule such as peptide, protein, oligonucleotide, glycoprotein, antibody or low molecular weight vector that can deliver the radionuclide to the binding site.
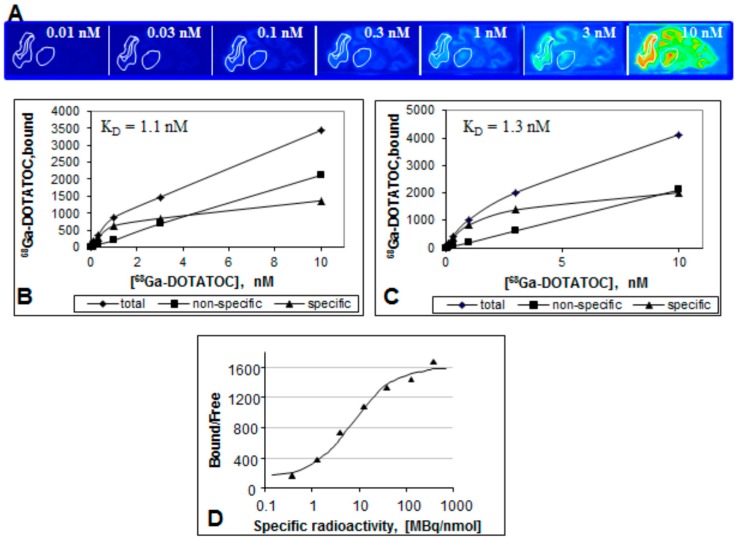
(A) Frozen section autoradiography showing [68Ga]Ga-DOTA-TOC binding to SSTR of rhesus monkey thalamus and cortex. The brain sections were incubated with different concentrations of [68Ga]Ga-DOTA-TOC (0.01–10 nM) for 30 min at room temperature; (B,C) Saturation of [68Ga]Ga-DOTA-TOC binding to SSTR of Rhesus monkey thalamus (B) and cortex (C); (D) The ratio of the ligand bound to the receptor and the free ligand as a function of the SRA. The data were fitted to a sigmoid two-parametric model.
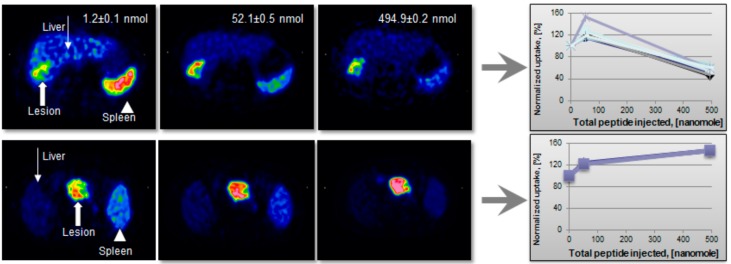
(Upper panel) Transaxial [68Ga]-DOTA-TOC-PET images of a patient with liver metastases from a colonic carcinoid who underwent three sequential PET-CT examinations. The tracer accumulation pattern in tumor tissue (thick arrow) increased in the second PET examination by pre-treatment with 50 µg of unlabeled octreotide but decreased again in the third examination that was proceeded by 500 µg of octreotide. (Lower panel) Transaxial [68Ga]-DOTA-TOC-PET images of a patient with a large endocrine pancreatic tumor who underwent three sequential PET-CT examinations. In contrast to the tumor uptake pattern in the other patients, as illustrated in the upper panel, the tumor accumulation (thick arrow) in this particular patient increased gradually over the three PET examinations.
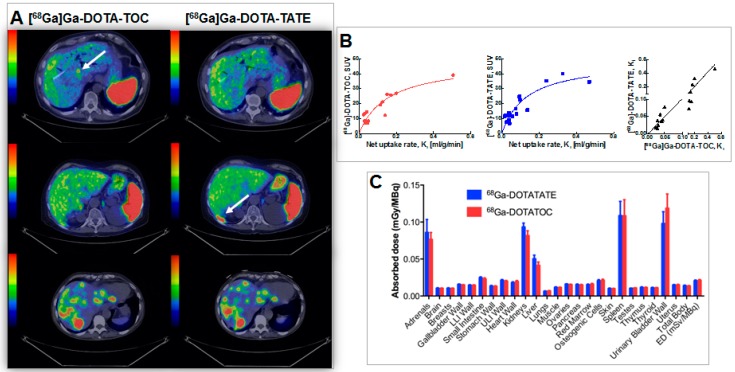
(A) Transaxial PET/CT fusion images of liver demonstrating cases of higher detection rate for: [68Ga]Ga-DOTA-TOC (A, upper panel); [68Ga]Ga-DOTA-TATE (A, middle panel); as well as equal detection rate (A, lower panel). Whole-body scans were conducted at 1 h p.i.. Arrows point at hepatic metastases; (B) SUV is presented as a function of net uptake rate Ki in tumors for [68Ga]Ga-DOTA-TOC (red) and [68Ga]-DOTA-TATE (blue). The solid lines are hyperbolic fits and are for visualization purposes only. Correlation between net uptake rate Ki at 1 h p.i. for [68Ga]Ga-DOTA-TOC and [68Ga]Ga-DOTA-TATE (black). The solid line is Deming regression with slope 1.06 and intercept 0.0. The axes are split in order to clarify the relationship at low uptake rates; (C) Absorbed doses in all organs included in OLINDA/EXM 1.1. LLI: lower large intestine; ULI: upper large intestine; ED: effective dose. Error bars indicate standard error of the mean.
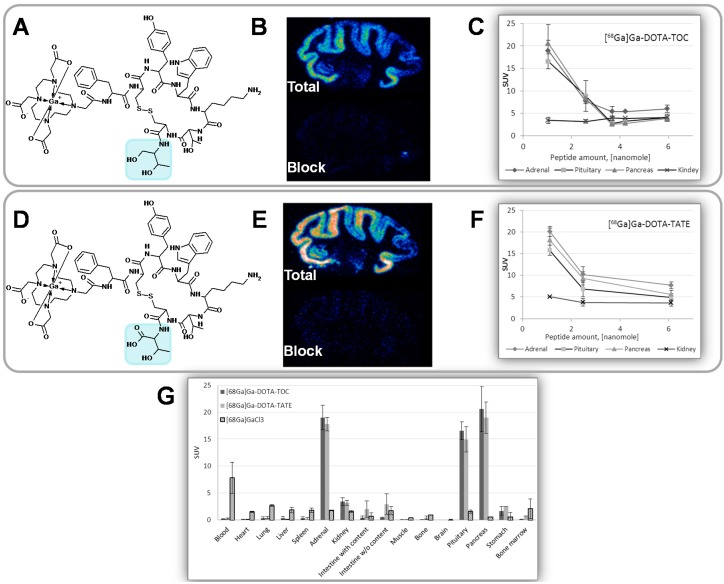
(A) Chemical structure of [68Ga]Ga-DOTA-TOC (IC50 = 2.5 ± 0.5; cell culture); (B) Rhesus monkey brain frozen section autoradiography (IC50 = 23.9 ± 7.9); (C) In vivo rat organ distribution for variable injected peptide amount; (D) Chemical structure of [68Ga]Ga-DOTA-TATE (IC50 = 0.2 ± 0.004; cell culture); (E) Rhesus monkey brain frozen section autoradiography (IC50 = 19.4 ± 8.3); (F) In vivo rat organ distribution for variable injected peptide amount; (G) Rat organ distribution of [68Ga]Ga-DOTA-TOC and [68Ga]Ga-DOTA-TATE 1 h post injection of 1 nmol of the peptide.
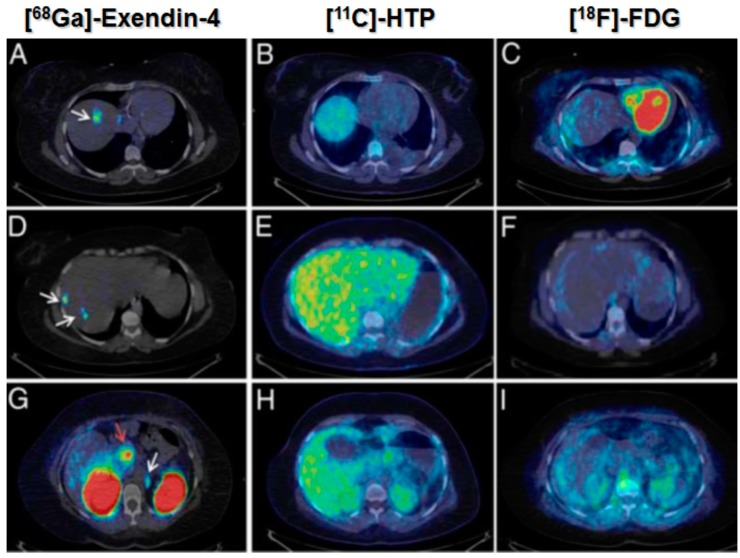
[68Ga]Ga-DO3A-Exendin-4/PET-CT revealed several GLP-1R positive lesions (white arrows) in the liver (A,D) and a paraortallymph node (G). Beta cells in normal pancreas (red arrow) have significant expression of GLP-1R and can also be visualized by this technique (G). No pancreatic or hepatic lesions could be detected by PET/CT using established tumor markers such as [11C]HTP (B,E,H) and [18F]FDG (C,F,I).
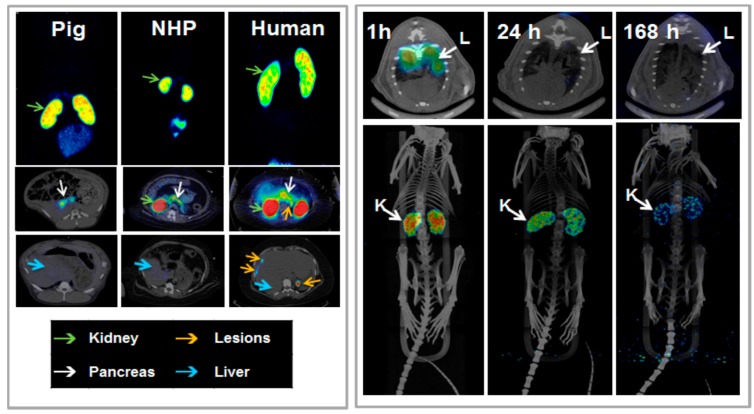
(Left panel) In vivo biodistribution of [68Ga]Ga-DO3A-VS-Cys4°-Exendin-4 as analyzed by PET-CT imaging in the pig (0.025 µg/kg; 60 min), non-human primate (NHP) (0.01 µg/kg; 90 min), and human (0.17 µg/kg; 40 min, 100 min and 120 min). The pancreas (white arrow) was delineated within 10 min post injection in all species. The low hepatic uptake (blue arrow) shows the potential for outlining insulinoma tumor metastasis (orange arrow, human images). The MIP coronal images demonstrate the highest uptake of the tracer in the kidneys (green arrow) in all species. (Right panel) Representative fused SPECT-CT images of [177Lu]-DO3A-VS-Cys40-Exendin-4 in rats at different time points. Lungs could be outlined at 1 h p.i. and showed faster clearance in later time points (upper panel). MIP images of whole body scan showing dominance of kidneys as excretory organ of tracer (lower panel).
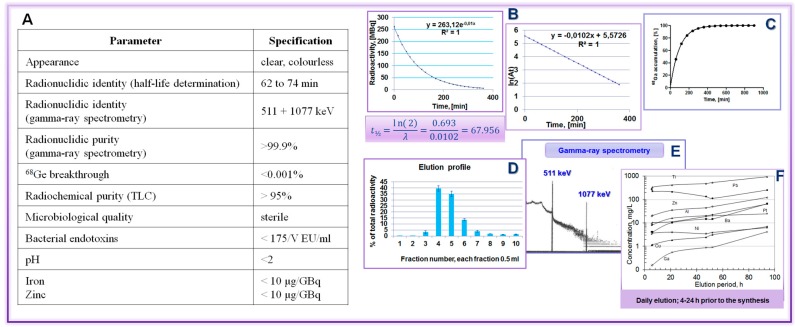
68Ge/68Ga generator validation: (A) Table summarizing the validation parameters and the respective specifications; (B) t½ determination; (C) 68Ga accumulation; (D) elution profile; (E) radionuclide purity; and (F) recommendation to elute generator prior to the synthesis.
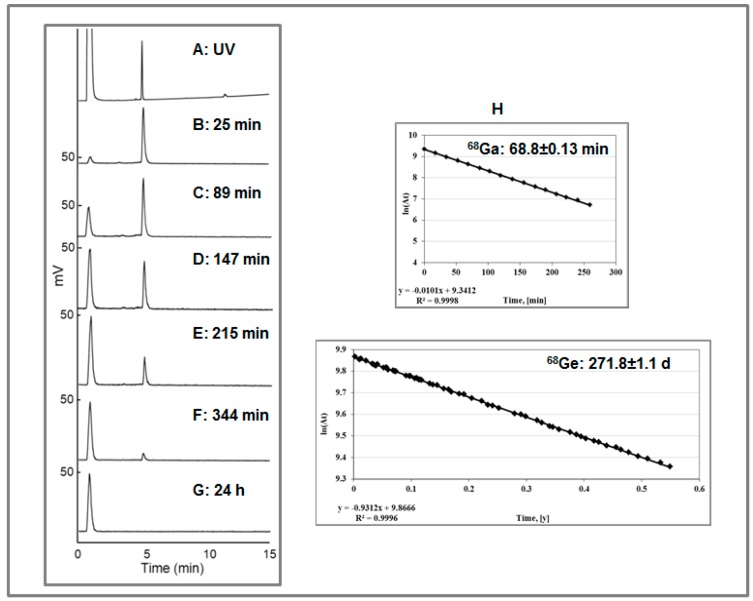
(A) UV-HPLC chromatogram of the authentic reference, [NatGa]-DOTA-TOC (the void signal corresponds to the buffer); (B–F) Radio-HPLC chromatograms of [68Ga]Ga-DOTA-TOC produced in the presence of [68Ge]GeCl4. The analysis was conducted, respectively, at 25, 89, 147, 215, and 344 min post synthesis. The signals with Rt of 1.0 ± 0.02 min and 4.90 ± 0.02 min correspond, respectively, to the ionic 68Ge(IV) and [68Ga]Ga-DOTA-TOC; (G) Radio-HPLC chromatogram taken 24 h after the production of [68Ga]Ga-DOTA-TOC in the presence of [68Ge]GeCl4. The signal with Rt of 1.0 ± 0.02 min corresponds to the ionic 68Ge(IV) and the signal at 4.90 ± 0.02 min corresponding to [68Ga]Ga-DOTA-TOC was not detected; (H) Determination of the t½ for 68Ga and 68Ge measuring respective collected chromatography fractions.
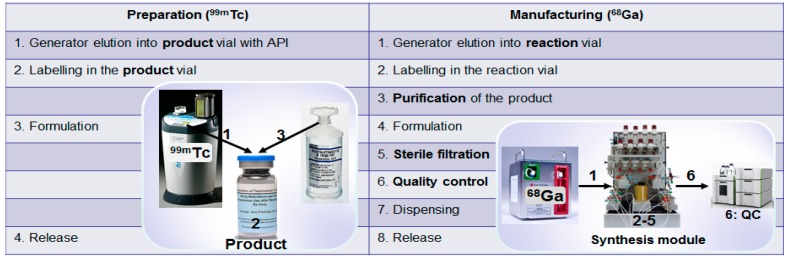
(Left column) Typical preparation steps of a 99mTc-based registered radiopharmaceutical; (Right column) Basic steps of an automated manufacturing of a 68Ga-based radiopharmaceutical.
References
-
- Velikyan I. Radionuclides for Imaging and Therapy in Oncology. In: Chen X., Wong S., editors. Cancer Theranostics. Elsevier; Amsterdam, The Netherlands: 2014. pp. 285–325.
-
- Velikyan I. The diversity of 68Ga-based imaging agents. Recent Results Cancer Res. 2013;194:101–131. - PubMed
Publication types
MeSH terms
Substances
LinkOut - more resources
Full Text Sources
Other Literature Sources
Medical
