. 2015 Aug;21(8):914-921.
doi: 10.1038/nm.3910. Epub 2015 Jul 20.

NY-ESO-1-specific TCR-engineered T cells mediate sustained antigen-specific antitumor effects in myeloma

Affiliations

NY-ESO-1-specific TCR-engineered T cells mediate sustained antigen-specific antitumor effects in myeloma

Aaron P Rapoport et al. Nat Med. 2015 Aug.

Abstract

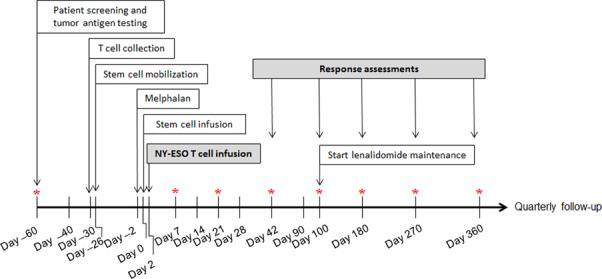
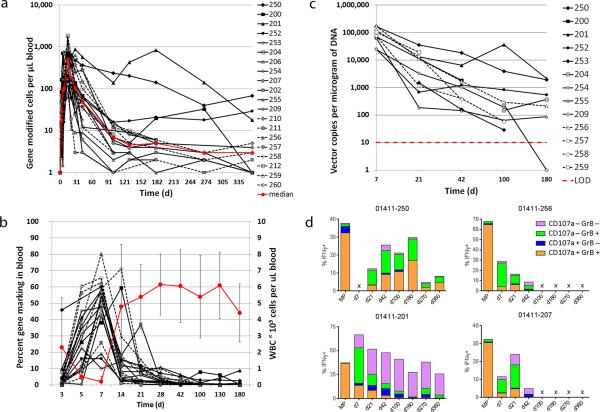
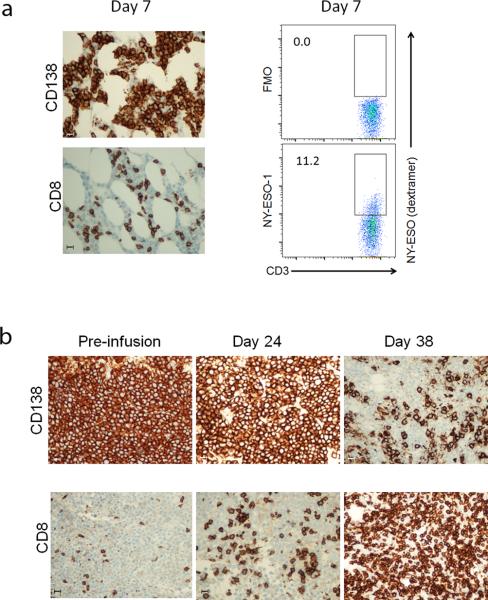
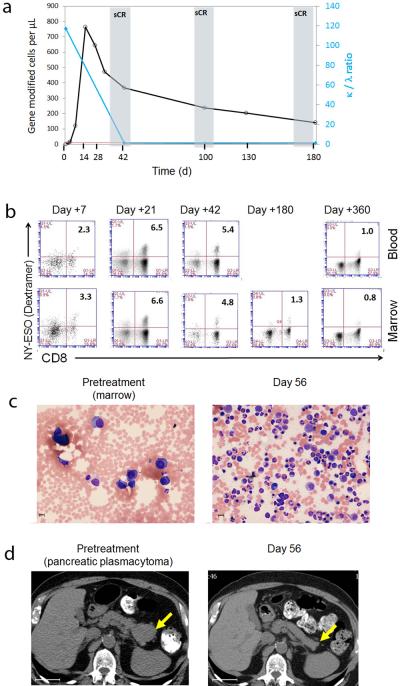
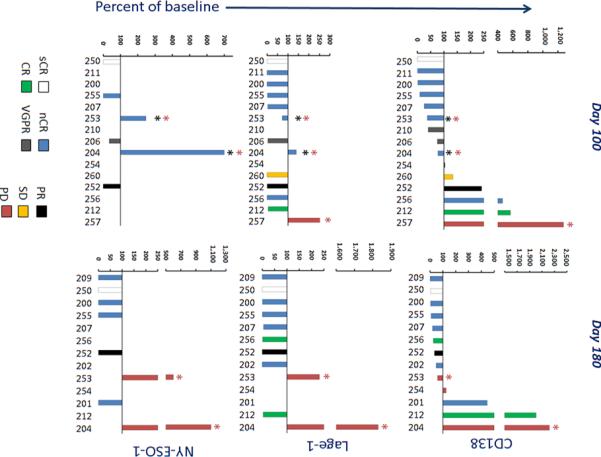
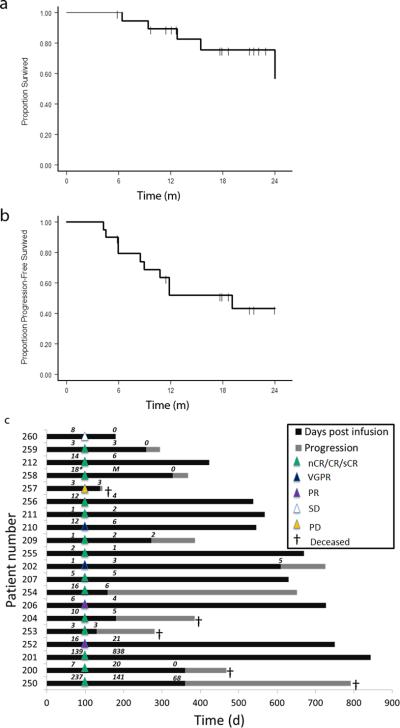
Despite recent therapeutic advances, multiple myeloma (MM) remains largely incurable. Here we report results of a phase I/II trial to evaluate the safety and activity of autologous T cells engineered to express an affinity-enhanced T cell receptor (TCR) recognizing a naturally processed peptide shared by the cancer-testis antigens NY-ESO-1 and LAGE-1. Twenty patients with antigen-positive MM received an average 2.4 × 10(9) engineered T cells 2 d after autologous stem cell transplant. Infusions were well tolerated without clinically apparent cytokine-release syndrome, despite high IL-6 levels. Engineered T cells expanded, persisted, trafficked to marrow and exhibited a cytotoxic phenotype. Persistence of engineered T cells in blood was inversely associated with NY-ESO-1 levels in the marrow. Disease progression was associated with loss of T cell persistence or antigen escape, in accordance with the expected mechanism of action of the transferred T cells. Encouraging clinical responses were observed in 16 of 20 patients (80%) with advanced disease, with a median progression-free survival of 19.1 months. NY-ESO-1-LAGE-1 TCR-engineered T cells were safe, trafficked to marrow and showed extended persistence that correlated with clinical activity against antigen-positive myeloma.


Figures

Figure 1
Figure 1. Overview of clinical study
Patient screening, including HLA testing and tumor antigen testing, and apheresis scheduling requires 2-4 weeks. Manufacture of gene-modified cells takes 3-4 weeks. Patients received high dose melphalan two days prior to stem cell infusion, and four days prior to T-cell infusion. Response assessments were performed at day 42, 100, 180 and quarterly thereafter. Optional bone marrow biopsies are indicated by asterisk. For eligible patients, maintenance lenalidomide was given starting at day 100. Once off study, patients are monitored for up to 15 years for delayed adverse events in accordance with FDA Guidance.
Figure 2
Figure 2. Persistence and function of gene-modified cells in blood and marrow
(a). The total number of gene-modified cells from infusion to 1 year on study is shown, as measured by Q-RT-PCR. The red line represents the median across patients. The limit of detection is approximately at 2.5 cells/microliter. (b). The percent of gene marking in blood over time is shown, using the left vertical axis. The red bold line represents the average WBC count using the right vertical axis. Standard deviation is represented by the error bars. (c). The total number of vector copies per microgram of DNA in bone marrow is represented for patients with two or more marrow collections post infusion. The percent of cells marked was calculated assuming a copy number of 1 per cell. The limit of detection for the assay is 10 copies and is represented by the red dotted line. (d). NY-ESO TCR-positive CD8 T-cells were evaluated for functionality in the cell product (MP) and at multiple timepoints post infusion by measuring production of IFN-γ, granzyme B and CD107a in response to antigen loaded T2 target cells. Non-antigen loaded T2 target cells were used as a negative control for all samples and background was subtracted from the values shown. Subsets of IFN-γ positive cells with +/− expression of granzyme B and CD107a are represented by the various colors in each histogram. Data from four responding patients with durable persistence are shown.
Figure 3
Figure 3. Tumor and T-cell infiltration in marrow
Core marrow samples were collected from patient 258 at day 7. (a). Marrow was stained for the plasma cell marker CD138 which is expressed on normal plasma and myeloma cells, and for CD8 to evaluate T-cell infiltration. (b). Mononuclear cells were isolated from fresh marrow aspirates, and stained with anti-CD3 antibody to detect T-cells, and NY-ESO TCR specific peptide/HLA-A2 dextramer reagent to detect gene-modified cells. The dextramer FMO is shown as a negative control. Gene-modified cells in the controls and test panel are denoted by the box, and the number to the left of the box represents the overall percent positive cells from the CD3 positive fraction. (c). Patient 253 received a second infusion of NY-ESO TCR T-cells in the absence of ASCT, after progressing following ASCT and first infusion. Core marrow biopsies were collected just prior to 1 infusion, and at day 24 and 38 after infusion, and were stained for the CD138 plasma cell/myeloma tumor marker, and for CD8 T-cell infiltration. Bars shown in (a) and (b) represent 20 microns.
Figure 4
Figure 4. Clinical response in patient 250 correlates with engineered T cell expansion
(a). The number of NY-ESO specific T-cells per microliter of blood is shown for patient 250, and is overlaid with the corresponding tumor burden assessed at days 42 - 180 post infusion. The kappa/lambda light chain ratio is shown on the right axis; n.b. that when ratio becomes normalized, plot is superimposed on X-axis. (b). The levels of TCR expression on CD8 T-cells over time were measured by peptide/HLA-A2 dextramer in marrow and blood; samples were gated on CD3+ lymphocytes. The percent double positive cells is represented by the number in the upper right hand corner. (c). H&E stain of a marrow biopsy pre and post treatment, demonstrating normalization of cellularity at two months. Note the magnification is slightly higher in the left panel. (d). Abdominal CT scan showing a pancreatic plasmacytoma (confirmed by biopsy) at baseline, and loss of the tumor two months after treatment. Bars in panel (c) are 10 microns and bars in panel (d) are 4 centimeters.
Figure 5
Figure 5. CD138, LAGE-1 and NY-ESO-1 expression in marrow
Transcripts for the plasma cell and myeloma marker CD138 (a), and the tumor antigens LAGE-1 (b) and NY-ESO-1 (c) were evaluated by QRT-PCR in all marrow collections performed post infusion, and the percent change from baseline values was calculated at day 100 (left panels) and 180 (right panels). The numbers along the x-axis are patient numbers and correspond to numbers in other figures. Bars are colored to reflect the clinical response of each patient at day 100, which is the pre-specified timepoint for response assessment in the study. Note Loss of engineered T cells (red asterisk) and relapse (black asterisk) is indicated.
Figure 6
Figure 6. Clinical responses and durability
(a). OS and PFS functions estimated by the Kaplan-Meier approach for the 20 patient cohort. Times-to-event are truncated as 24 months. Surviving (censored) patients are represented by tick marks; the number of patients available for assessment at each 6 month interval is indicated below the graph. (b). Swimmer plot showing the duration of clinical response (black bars) and survival following progression (hatched bars). The depth of each response as measured at day 100 on study is represented by the triangles overlying each bar at that time point. The number of gene-marked cells per microliter of blood, as determined by Q-RT-PCR, is noted above each patient bar for day 100, 180 and 360 post-infusion.

Comment in

References

    1. Tricot G, et al. Graft-versus-myeloma effect: proof of principle. Blood. 1996;87:1196–1198. - PubMed
    1. Alyea E, et al. T-cell--depleted allogeneic bone marrow transplantation followed by donor lymphocyte infusion in patients with multiple myeloma: induction of graft-versus-myeloma effect. Blood. 2001;98:934–939. - PubMed
    1. Lokhorst HM, et al. The occurrence of graft-versus-host disease is the major predictive factor for response to donor lymphocyte infusions in multiple myeloma. Blood. 2004;103:4362–4364. - PubMed
    1. Barlogie B, et al. Superiority of tandem autologous transplantation over standard therapy for previously untreated multiple myeloma. Blood. 1997;89:789–793. - PubMed
    1. Attal M, et al. A prospective, randomized trial of autologous bone marrow transplantation and chemotherapy in multiple myeloma. Intergroupe Francais du Myelome. The New England journal of medicine. 1996;335:91–97. - PubMed

Publication types