

Renal Blood Oxygenation Level-Dependent Magnetic Resonance Imaging: A Sensitive and Objective Analysis
- PMID: 26193455
- PMCID: PMC4765917
- DOI: 10.1097/RLI.0000000000000190
Renal Blood Oxygenation Level-Dependent Magnetic Resonance Imaging: A Sensitive and Objective Analysis
Abstract
Objectives: The aim of this study was to determine a robust (sensitive and objective) method for analyzing renal blood oxygenation level-dependent magnetic resonance imaging data.
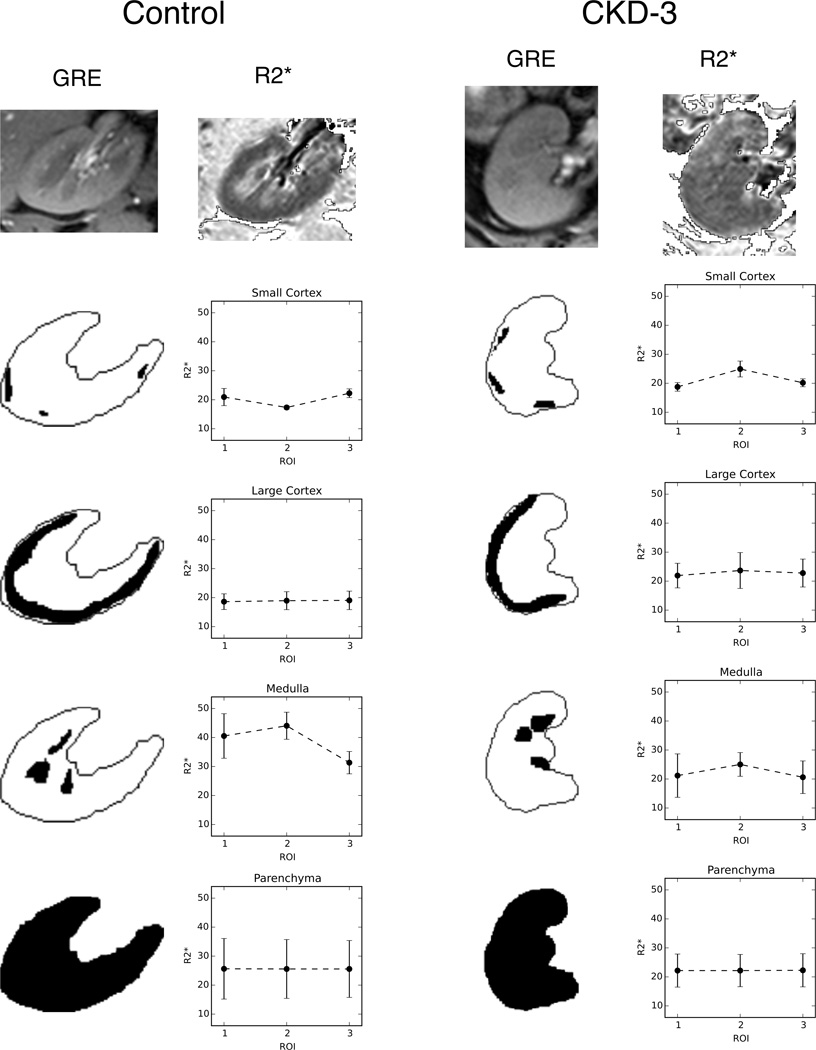
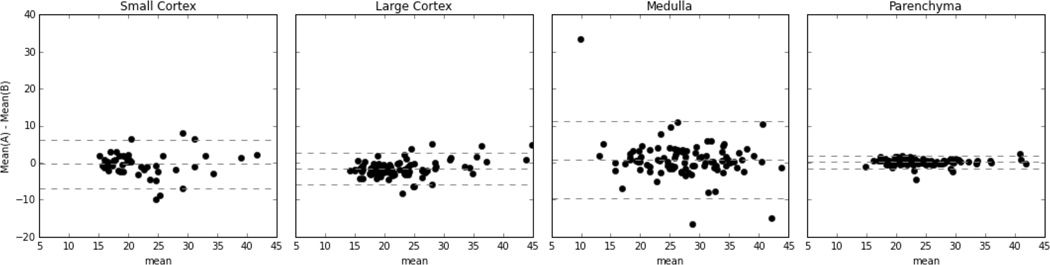
Materials and methods: Forty-seven subjects (30 with chronic kidney disease [CKD] and 17 controls) were imaged at baseline and after furosemide with a multiecho gradient recalled echo sequence. Conventional analysis consisted of regional segmentation (small cortex, large cortex, and medulla), followed by computing the mean of each region. In addition, we segmented the entire parenchyma and computed the mean (μ1) plus higher moments (μ2, μ3, and μ4). Two raters performed each of the segmentation steps, and agreement was assessed with intraclass correlation coefficients (ICCs). We used a measure of effect size (Cohen's d value), in addition to the usual measure of statistical significance, P values, for determining significant results.
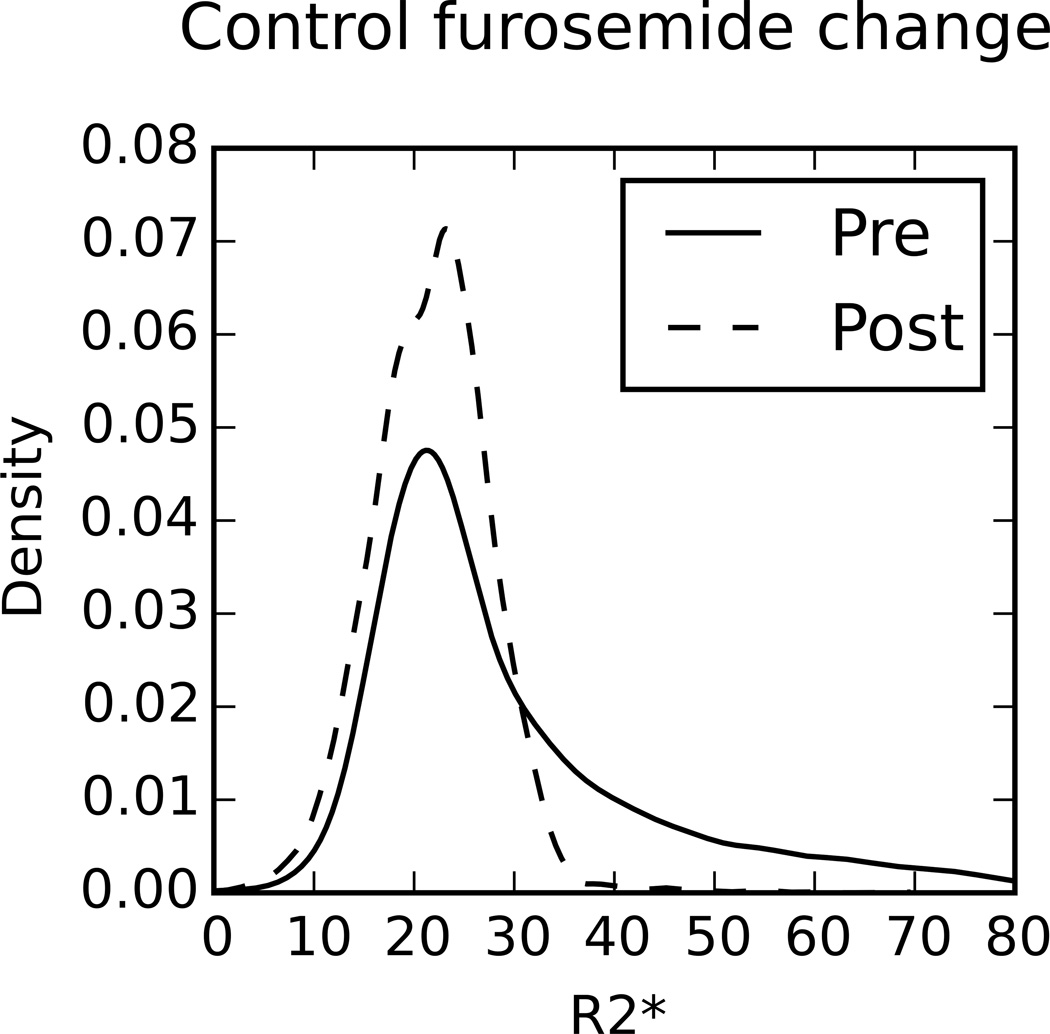
Results: The mean of the renal parenchyma showed the highest agreement between raters (ICC, 0.99), and the higher parenchyma moments were on par with large cortical region of interest (ROI) ICC. The renal parenchymal mean also exhibited significant sensitivity to changes after furosemide administration in healthy subjects (P = 0.002, d = 0.84), in agreement with medullary ROIs (P = 0.002, d = 1.59). When comparing controls and subjects with CKD at baseline, cortical ROI showed a significant difference (P = 0.015, d = -0.69), whereas the parenchyma ROI did not (P = 0.152, d = 0.39). Post-furosemide data in all regions resulted in a significant difference (large cortex: P = 0.026, d = -0.51; medulla: P = 0.019, d = -0.61) with the renal parenchyma ROI resulting in the largest effect size (P = 0.003, d = -0.75). Higher moments of the renal parenchyma showed similar significant differences as well.
Conclusions: Overall, our data support the use of the entire parenchyma to evaluate changes in the medulla after administration of furosemide, a widely used pharmacological maneuver. Changes in higher moments indicate that there is more than just a shift in the mean renal R2* and may provide clinically relevant information without the need for subjective regional segmentation. For evaluating differences between controls and subjects with CKD at baseline; large cortical ROI provided the highest sensitivity and objectivity. A combination of renal parenchyma assessment and large cortical ROI may provide the most robust method of evaluating renal blood oxygenation level-dependent magnetic resonance imaging data.
Figures
References
-
- Nangaku M. Chronic hypoxia and tubulointerstitial injury: a final common pathway to end-stage renal failure. J Am Soc Nephrol. 2006;17(1):17–25. - PubMed
-
- Fine LG, Orphanides C, Norman JT. Progressive renal disease: the chronic hypoxia hypothesis. Kidney Int. 1998:S74–S78. - PubMed
-
- Prasad PV, Edelman RR, Epstein FH. Noninvasive evaluation of intrarenal oxygenation with BOLD MRI. Circulation. 1996;94(12):3271–3275. - PubMed
-
- Li L-P, Prasad PV. Studies on Renal Disorders. Springer; 2011. Estimation of Kidney Oxygenation by Blood Oxygenation Level Dependent Magnetic Resonance Imaging; pp. 587–609.
Publication types
MeSH terms
Substances
Grants and funding
LinkOut - more resources
Full Text Sources
Medical
