

Regulation of Renal Hemodynamics and Function by RGS2
- PMID: 26193676
- PMCID: PMC4508038
- DOI: 10.1371/journal.pone.0132594
Regulation of Renal Hemodynamics and Function by RGS2
Abstract
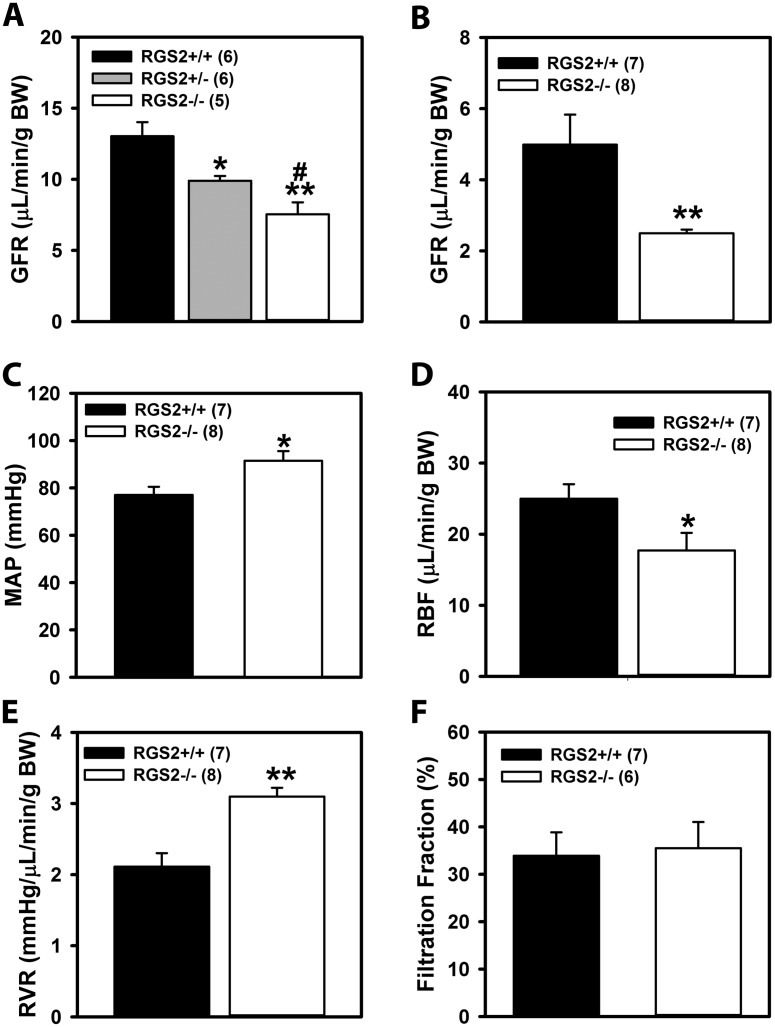
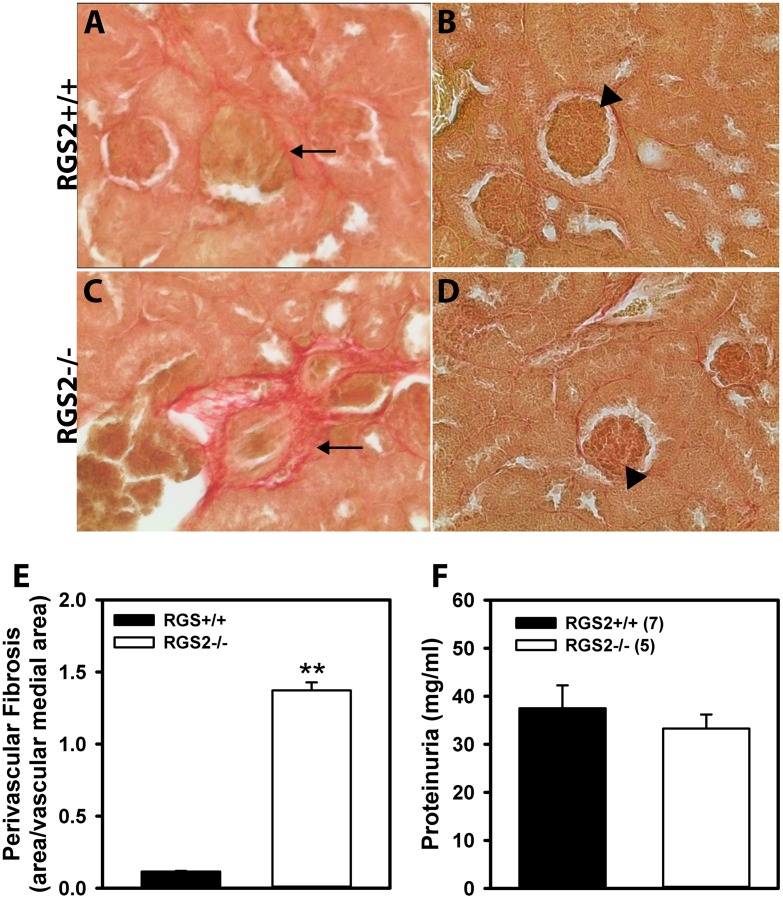
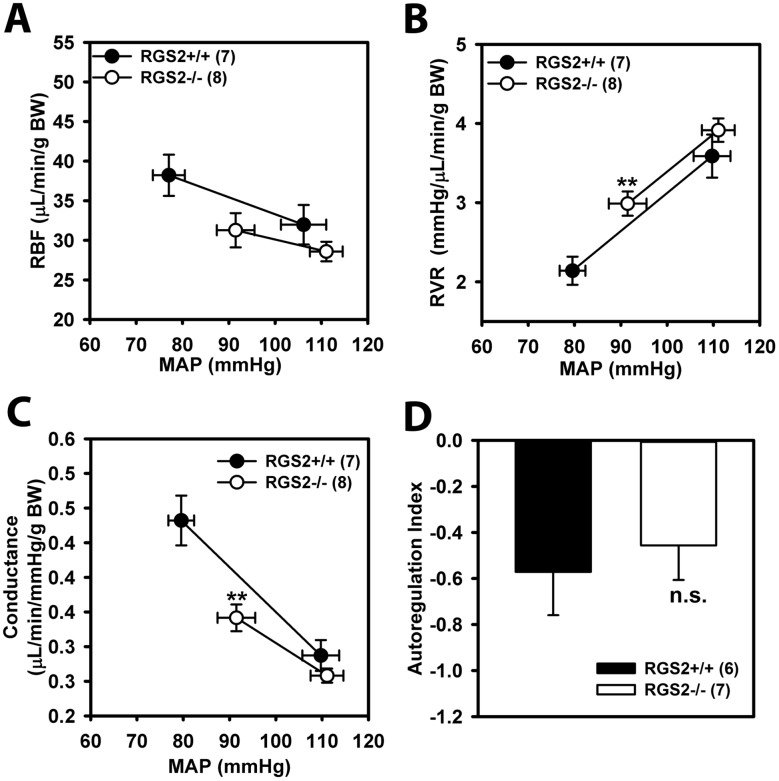
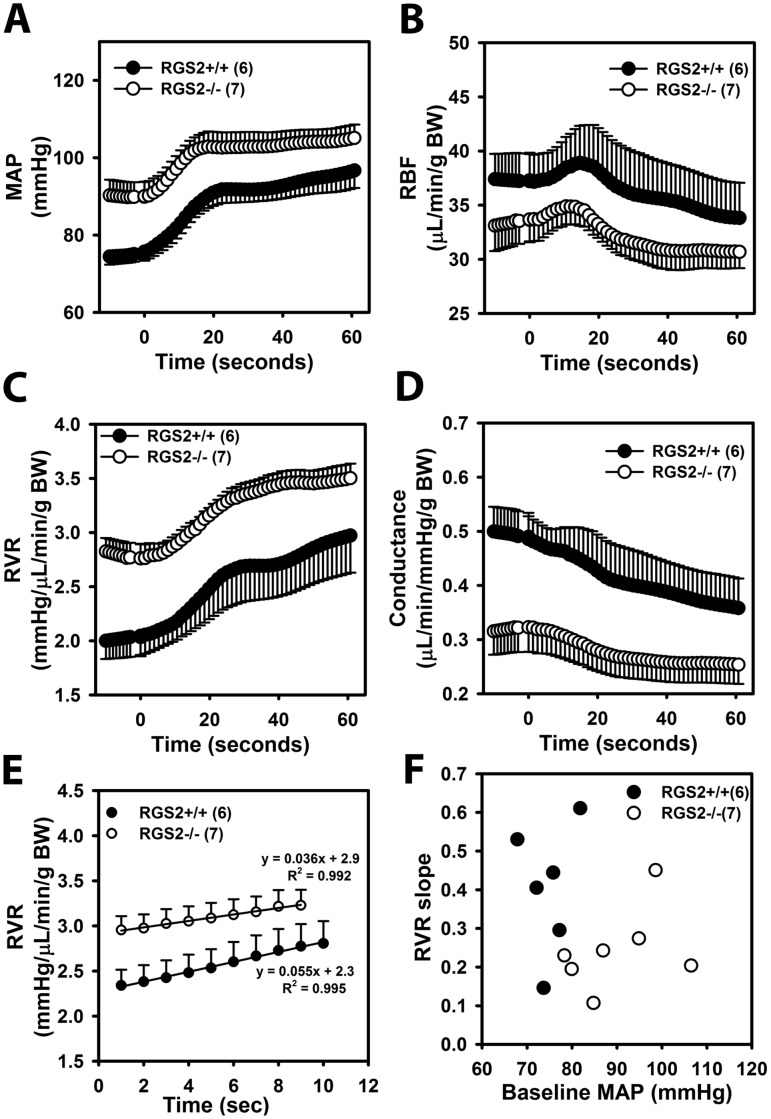
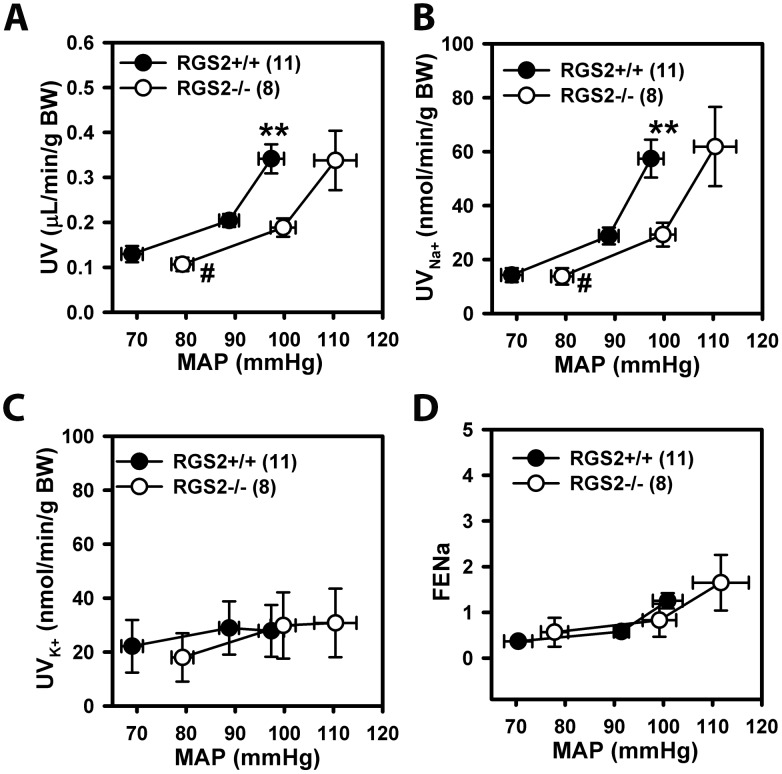
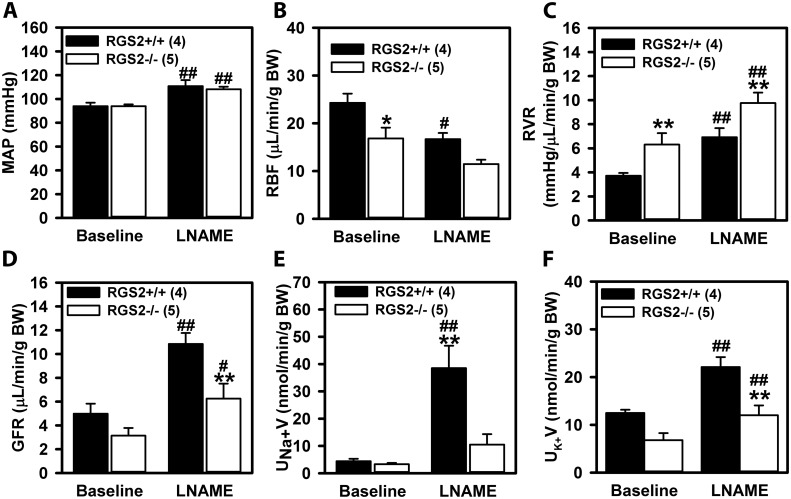
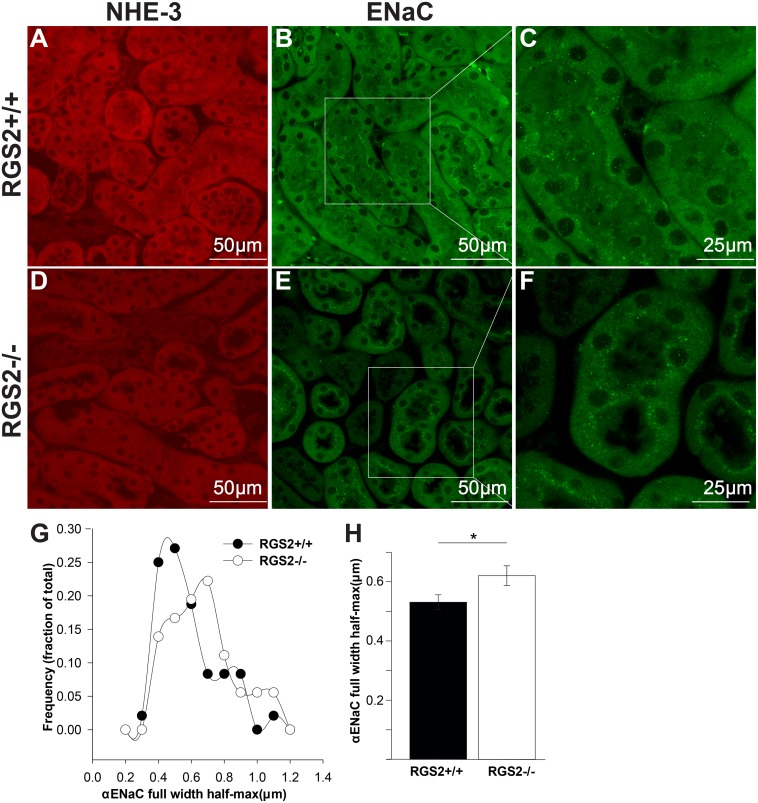
Regulator of G protein signaling 2 (RGS2) controls G protein coupled receptor (GPCR) signaling by acting as a GTPase-activating protein for heterotrimeric G proteins. Certain Rgs2 gene mutations have been linked to human hypertension. Renal RGS2 deficiency is sufficient to cause hypertension in mice; however, the pathological mechanisms are unknown. Here we determined how the loss of RGS2 affects renal function. We examined renal hemodynamics and tubular function by monitoring renal blood flow (RBF), glomerular filtration rate (GFR), epithelial sodium channel (ENaC) expression and localization, and pressure natriuresis in wild type (WT) and RGS2 null (RGS2-/-) mice. Pressure natriuresis was determined by stepwise increases in renal perfusion pressure (RPP) and blood flow, or by systemic blockade of nitric oxide synthase with L-NG-Nitroarginine methyl ester (L-NAME). Baseline GFR was markedly decreased in RGS2-/- mice compared to WT controls (5.0 ± 0.8 vs. 2.5 ± 0.1 μl/min/g body weight, p<0.01). RBF was reduced (35.4 ± 3.6 vs. 29.1 ± 2.1 μl/min/g body weight, p=0.08) while renal vascular resistance (RVR; 2.1 ± 0.2 vs. 3.0 ± 0.2 mmHg/μl/min/g body weight, p<0.01) was elevated in RGS2-/- compared to WT mice. RGS2 deficiency caused decreased sensitivity and magnitude of changes in RVR and RBF after a step increase in RPP. The acute pressure-natriuresis curve was shifted rightward in RGS2-/- relative to WT mice. Sodium excretion rate following increased RPP by L-NAME was markedly decreased in RGS2-/- mice and accompanied by increased translocation of ENaC to the luminal wall. We conclude that RGS2 deficiency impairs renal function and autoregulation by increasing renal vascular resistance and reducing renal blood flow. These changes impair renal sodium handling by favoring sodium retention. The findings provide a new line of evidence for renal dysfunction as a primary cause of hypertension.
Conflict of interest statement
Figures
Similar articles
-
Involvement of tumor necrosis factor-alpha in natriuretic response to systemic infusion of nitric oxide synthase inhibitor in anesthetized mice.Am J Physiol Renal Physiol. 2010 Jul;299(1):F217-24. doi: 10.1152/ajprenal.00611.2009. Epub 2010 Apr 21. Am J Physiol Renal Physiol. 2010. PMID: 20410217 Free PMC article.
-
Blockade of pressure natriuresis induced by inhibition of renal synthesis of nitric oxide in dogs.Am J Physiol. 1992 May;262(5 Pt 2):F718-22. doi: 10.1152/ajprenal.1992.262.5.F718. Am J Physiol. 1992. PMID: 1590415
-
Reduced renal responses to nitric oxide synthase inhibition in mice lacking the gene for gp91phox subunit of NAD(P)H oxidase.Am J Physiol Renal Physiol. 2008 Sep;295(3):F758-64. doi: 10.1152/ajprenal.90291.2008. Epub 2008 Jul 2. Am J Physiol Renal Physiol. 2008. PMID: 18596078 Free PMC article.
-
Nitric oxide in the control of renal hemodynamics and excretory function.Am J Hypertens. 2001 Jun;14(6 Pt 2):74S-82S. doi: 10.1016/s0895-7061(01)02073-8. Am J Hypertens. 2001. PMID: 11411769 Review.
-
Renal autoregulation in health and disease.Physiol Rev. 2015 Apr;95(2):405-511. doi: 10.1152/physrev.00042.2012. Physiol Rev. 2015. PMID: 25834230 Free PMC article. Review.
Cited by
-
Regulator of G Protein Signaling 2 Facilitates Uterine Artery Adaptation During Pregnancy in Mice.J Am Heart Assoc. 2019 May 7;8(9):e010917. doi: 10.1161/JAHA.118.010917. J Am Heart Assoc. 2019. PMID: 31030617 Free PMC article.
-
Expression regulation and functional analysis of RGS2 and RGS4 in adipogenic and osteogenic differentiation of human mesenchymal stem cells.Biol Res. 2017 Dec 26;50(1):43. doi: 10.1186/s40659-017-0148-1. Biol Res. 2017. PMID: 29279050 Free PMC article.
-
RGS2 squelches vascular Gi/o and Gq signaling to modulate myogenic tone and promote uterine blood flow.Physiol Rep. 2016 Feb;4(2):e12692. doi: 10.14814/phy2.12692. Physiol Rep. 2016. PMID: 26811058 Free PMC article.
-
Dual loss of regulator of G protein signaling 2 and 5 exacerbates ventricular myocyte arrhythmias and disrupts the fine-tuning of Gi/o signaling.J Mol Cell Cardiol. 2022 Sep;170:34-46. doi: 10.1016/j.yjmcc.2022.05.009. Epub 2022 Jun 2. J Mol Cell Cardiol. 2022. PMID: 35661621 Free PMC article.
-
Proteolytic degradation of regulator of G protein signaling 2 facilitates temporal regulation of Gq/11 signaling and vascular contraction.J Biol Chem. 2017 Nov 24;292(47):19266-19278. doi: 10.1074/jbc.M117.797134. Epub 2017 Oct 3. J Biol Chem. 2017. PMID: 28974581 Free PMC article.
References
-
- Cowley AW Jr. Long-term control of arterial blood pressure. Physiological reviews. 1992;72(1):231–300. . - PubMed
-
- Guyton AC. Dominant role of the kidneys and accessory role of whole-body autoregulation in the pathogenesis of hypertension. American journal of hypertension. 1989;2(7):575–85. . - PubMed
-
- Guyton AC. Blood pressure control—special role of the kidneys and body fluids. Science. 1991;252(5014):1813–6. . - PubMed
-
- Casellas D, Moore LC. Autoregulation of intravascular pressure in preglomerular juxtamedullary vessels. The American journal of physiology. 1993;264(2 Pt 2):F315–21. . - PubMed
Publication types
MeSH terms
Substances
Grants and funding
LinkOut - more resources
Full Text Sources
Other Literature Sources
Molecular Biology Databases
