. 2015 Jul 20;10(7):e0132960.
doi: 10.1371/journal.pone.0132960. eCollection 2015.

MMP-13 In-Vivo Molecular Imaging Reveals Early Expression in Lung Adenocarcinoma

Affiliations

MMP-13 In-Vivo Molecular Imaging Reveals Early Expression in Lung Adenocarcinoma

Mathieu Salaün et al. PLoS One. .

Abstract

Introduction: Several matrix metalloproteinases (MMPs) are overexpressed in lung cancer and may serve as potential targets for the development of bioactivable probes for molecular imaging.

Objective: To characterize and monitor the activity of MMPs during the progression of lung adenocarcinoma.

Methods: K-rasLSL-G12D mice were imaged serially during the development of adenocarcinomas using fluorescence molecular tomography (FMT) and a probe specific for MMP-2, -3, -9 and -13. Lung tumors were identified using FMT and MRI co-registration, and the probe concentration in each tumor was assessed at each time-point. The expression of Mmp2, -3, -9, -13 was quantified by qRT-PCR using RNA isolated from microdissected tumor cells. Immunohistochemical staining of overexpressed MMPs in animals was assessed on human lung tumors.

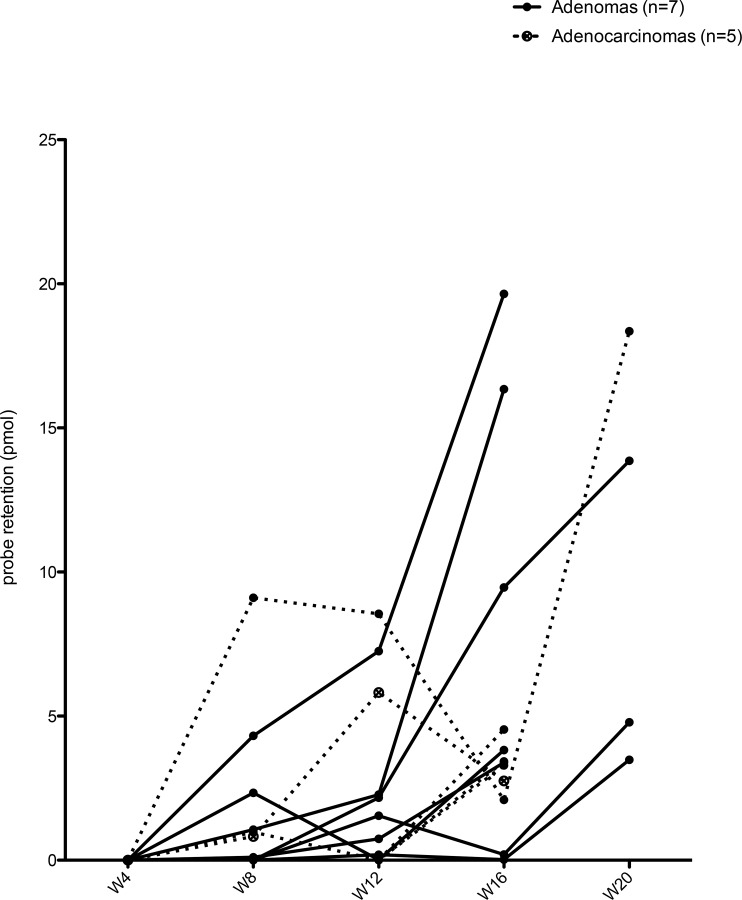
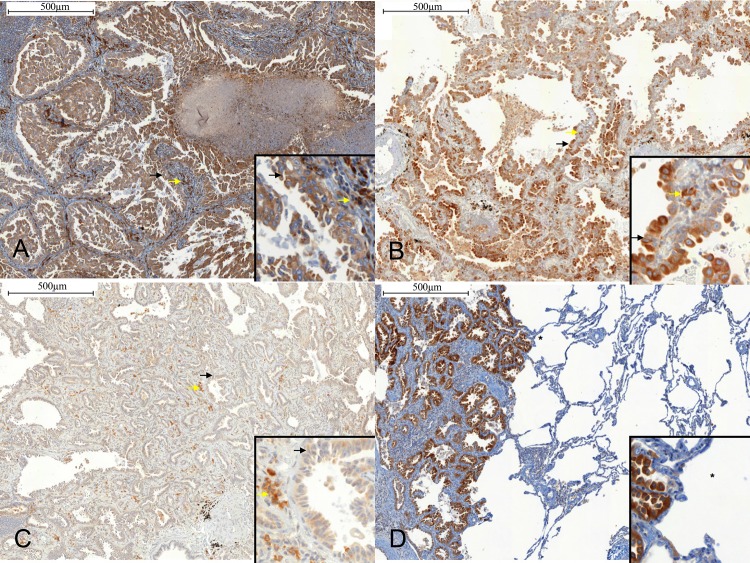
Results: In mice, 7 adenomas and 5 adenocarcinomas showed an increase in fluorescent signal on successive FMT scans, starting between weeks 4 and 8. qRT-PCR assays revealed significant overexpression of only Mmp-13 in mice lung tumors. In human tumors, a high MMP-13 immunostaining index was found in tumor cells from invasive lesions (24/27), but in none of the non-invasive (0/4) (p=0.001).

Conclusion: MMP-13 is detected in early pulmonary invasive adenocarcinomas and may be a potential target for molecular imaging of lung cancer.


Conflict of interest statement

Competing Interests: The authors have declared that no competing interests exist.

Figures

Fig 1
Fig 1. Imaging of MMP activity in the K-rasLSL-G12D lung cancer model using MMPSense680.
In vivo (A) and ex vivo (B) epi-fluorescent images (IVIS Spectrum) of a large superficial right lung tumor exposed after thoracotomy and laparotomy (B). The fluorescent bioactivatable probe reporting the proteolytic activity of MMP 2, -3, -9 and -13 (MMPSense680, 2 nmol) was injected i.v 24 h prior to imaging. The results confirmed the ability of an epi-illumination fluorescence system to image MMP activity in lung tumors, although the system could not discriminate large lung tumors from the liver (1A). Fluorescence intensity is represented as a pseudocolor image (MATLAB “hot” color map) overlaid on a white-light photographic image. Values of absolute fluorescence efficiency, as measured by the IVIS Spectrum, are shown on the color bar in units of 10−5 (1A) or 10−4 (1B). L: Liver; T: Right lung tumor.
Fig 2
Fig 2. The fluorescent signal from MMPs increases in lung tumors.
A) Ex vivo image of MMP activity in superficial lung lesions of various stages from K-rasLSL-G12D mice. The nonneoplastic lobe (L1) of freshly isolated lungs imaged immediately after euthanasia did not display any fluorescent signal, while in the tumor-bearing lobes (L2-5), signal increased with the degree of lesion severity. The data confirmed the ability of an epi-illumination fluorescence system (IVIS Spectrum) to image MMP activity at different stages of lung tumor progression. B) Fluorescence intensity of lung adenomas (n = 8), adenocarcinomas (n = 3) and normal lung lobes (n = 25). In this experiment, the lung and tumor fluorescence signal was normalized on liver fluorescence, based on the hepatic activation of the probe. The fluorescence intensity ratio was calculated as a ratio of the median radiant efficiency of the lung lobe / liver. The median values ± interquartile range are shown, and the median differences between cancerous lesions and normal lobes are significant. * p value <0.05 by the Mann-Whitney test.
Fig 3
Fig 3. Retrospective analysis of the MMPSense680 fluorescent signal following identification of the tumor on fused FMT-MRI images.
A representative example of one animal, from imaging to histology, is presented. A&B) Axial and sagittal MRI scans, showing a small tumor (white arrows) in the right lower lobe of the lung, behind the liver (L). C) Frontal view of the FMT scan. The tumor is hidden behind the strong fluorescent signal of the liver. D) Overlay of the FMT signal on the MRI image, using the fiducial markers (FM) and the liver (L) for 3D alignment. Note the distinct fluorescent signal localized to the tumor (T). E&F) The position of the tumor was identified on the FMT scan and the corresponding region of interest was circumscribed (E: frontal view of the FMT scan; F: oblique view of the same FMT scan. G) The tumor ROI (ellipse) was reported on the previous FMT scans of the same animal, along with a liver ROI (rectangle) to allow fluorescence ratio quantification, showing an increasing fluorescence with time. The effect of probe activation in the liver on measurements of this tumor—near the liver—cannot be measured. H&I) Ex-vivo epifluorescence imaging (H) and histological reviews (I) confirmed the presence of a 2mm adenoma in the right lower lobe (white and black arrows).
Fig 4
Fig 4. MMPSense680 retention was detected between week 4 and 8 in developing adenomas and adenocarcinomas and increased over time.
Probe retention was calculated by the TrueQuant software in each ROI at each timepoint. Graph shows the probe retention in adenomas (n = 7) and adenocarcinomas (n = 5) at each time point.
Fig 5
Fig 5. Relative RNA expression of Mmp 2, -3, -9, -13 in tumor vs. normal lung tissue in K-rasLSL-G12D mice.
The expression of Mmp-2, -3, -9, and -13 in lung lesions vs. normal lung tissue (n = 12 pairs) was compared using boxplots. The transcript level of each Mmp gene was determined by qRT-PCR and normalized against that of the housekeeping gene Hprt. The fold difference between each sample vs. a mouse universal reference total RNA was calculated using the delta delta Ct method. The middle line is the median, and the bottom & top of the box are the 25th and 75th percentiles (inter-quartile range, IQR). The "whiskers”, extending from the ends of the box, represent the most extreme point (≤ 1.5 times the IQR). More extreme points are considered outliers and are plotted separately. Only the relative expression of Mmp-13 was significantly higher in cancerous tissue as compared to normal lung tissue (Wilcoxon signed rank test; * indicates a p value <0.01)
Fig 6
Fig 6. Expression of MMP-13 in human lung adenocarcinoma.
Immunohistochemical staining was performed using Clone VIIIA2 diluted 1:20 (Lab Vision Corp., CA). A) Solid predominant adenocarcinoma. MMP-13 index staining (brown) is high in tumor cells (black arrow) and in fibroblasts (yallow arrow) (x100). B) Minimally invasive adenocarcinoma. MMP-13 staining is high in tumor cells (black arrow), and high in fibroblasts (yellow arrow) (x100). C) Adenocarcinoma in-situ. MMP-13 staining is high in tumor cells (black arrow), and high in fibroblasts (yellow arrow) (x100). D) Solid predominant adenocarcinoma and normal lung. Note the absence of MMP-13 staining in normal lung (*). Scale bar: 500 μm. Inserts in the x100 IHCs show x400 magnification.

References

    1. Aberle DR, Adams AM, Berg CD, Black WC, Clapp JD, Fagerstrom RM, et al. Reduced lung-cancer mortality with low-dose computed tomographic screening. N Engl J Med. 2011;365(5):395–409. Epub 2011/07/01. 10.1056/NEJMoa1102873 . - DOI - PMC - PubMed
    1. Wistuba II, Mao L, Gazdar AF. Smoking molecular damage in bronchial epithelium. Oncogene. 2002;21(48):7298–306. Epub 2002/10/16. 10.1038/sj.onc.1205806 . - DOI - PubMed
    1. DuPage M, Dooley AL, Jacks T. Conditional mouse lung cancer models using adenoviral or lentiviral delivery of Cre recombinase. Nat Protoc. 2009;4(7):1064–72. Epub 2009/06/30. nprot.2009.95 [pii] 10.1038/nprot.2009.95 - DOI - PMC - PubMed
    1. Sweet-Cordero A, Mukherjee S, Subramanian A, You H, Roix JJ, Ladd-Acosta C, et al. An oncogenic KRAS2 expression signature identified by cross-species gene-expression analysis. Nat Genet. 2005;37(1):48–55. Epub 2004/12/21. ng1490 [pii] 10.1038/ng1490 . - DOI - PubMed
    1. Liotta LA, Kohn EC. The microenvironment of the tumour-host interface. Nature. 2001;411(6835):375–9. . - PubMed

Publication types

MeSH terms