

Type III Interferon Induces Distinct SOCS1 Expression Pattern that Contributes to Delayed but Prolonged Activation of Jak/STAT Signaling Pathway: Implications for Treatment Non-Response in HCV Patients
- PMID: 26193702
- PMCID: PMC4508043
- DOI: 10.1371/journal.pone.0133800
Type III Interferon Induces Distinct SOCS1 Expression Pattern that Contributes to Delayed but Prolonged Activation of Jak/STAT Signaling Pathway: Implications for Treatment Non-Response in HCV Patients
Abstract
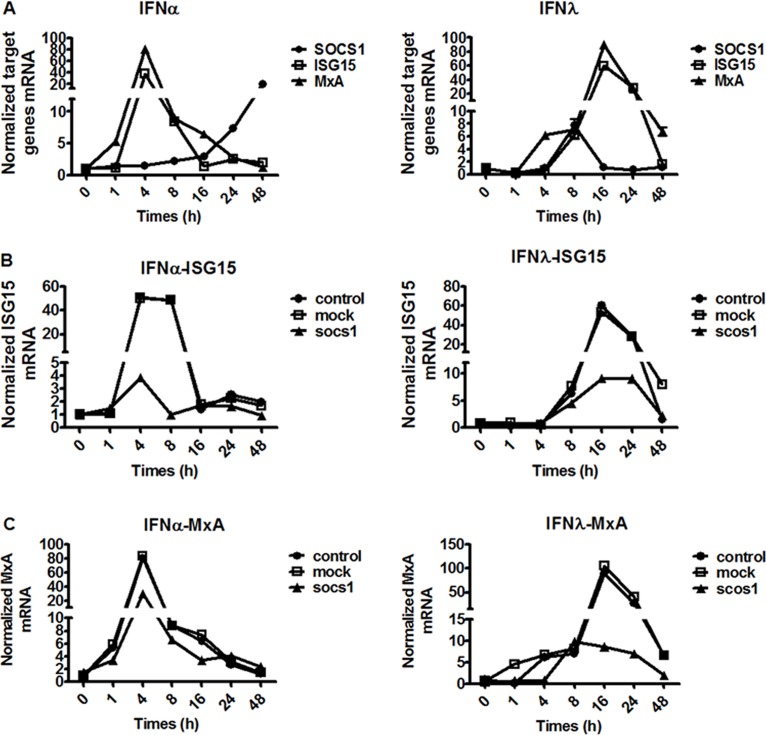
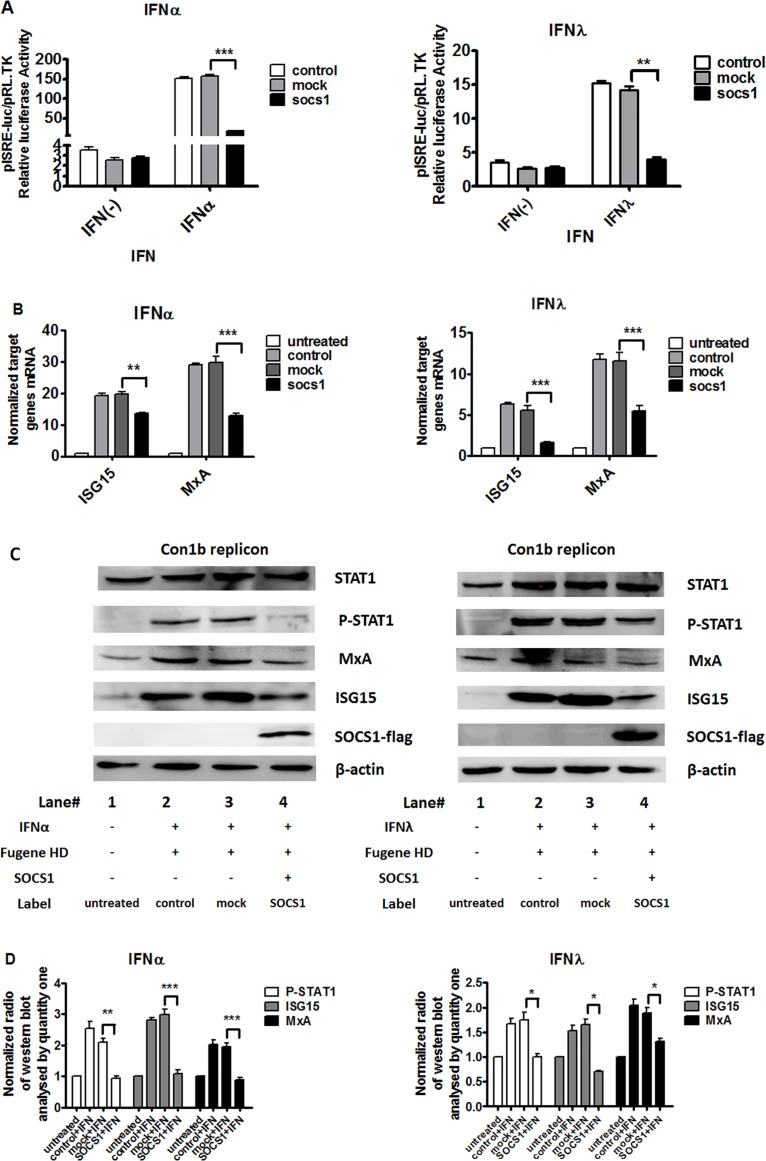
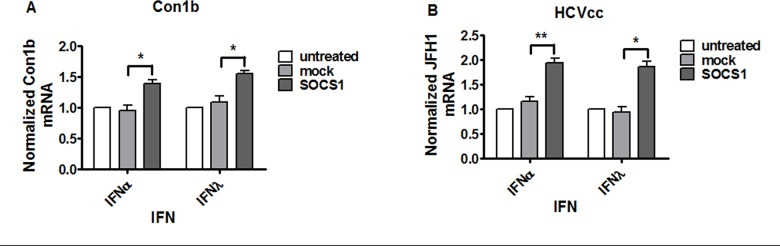
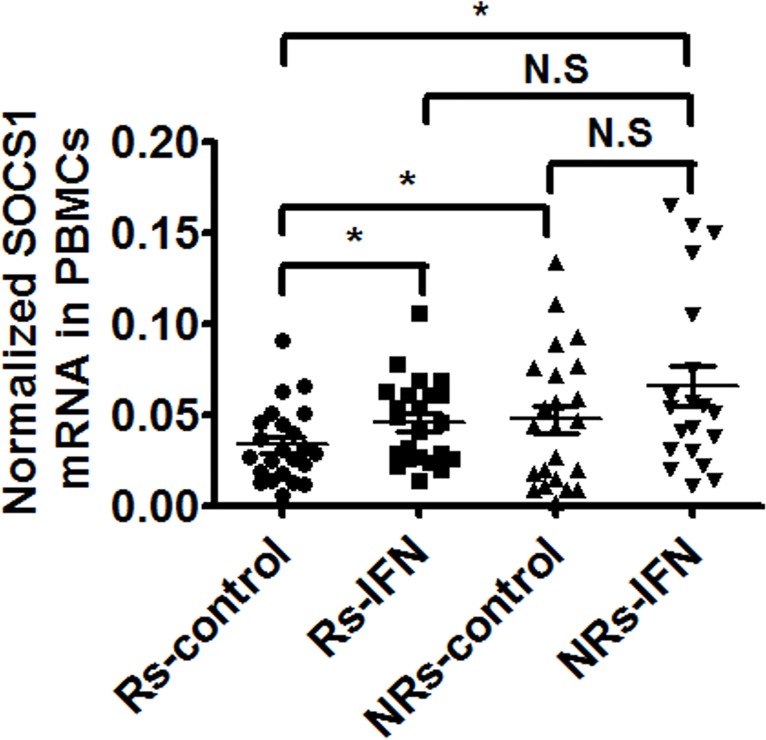
Suppressor of cytokine signaling 1 (SOCS1) has long been thought to block type I interferon signaling. However, IFN-λ, a type III IFN with limited receptor expression in hepatic cells, efficiently inhibits HCV (Hepatitis C virus) replication in vivo with potentially less side effects than IFN-α. Previous studies demonstrated that type I and type III activated Janus kinase/signal transducer and activator of transcription (Jak/STAT) signaling pathway differently, with delayed but prolonged activation by IFN-λ stimulation compared to IFNα/β. However, the molecular mechanisms underlying this observation is not well understood. Here, we found that there are distinct differences in SOCS1 expression patterns in Huh-7.5.1 cells following stimulation with IFN-α and IFN-λ. IFN-λ induced a faster but shorter expression of SOCS1. Furthermore, we confirmed that SOCS1 over-expression abrogates anti-HCV effect of both IFN-α and IFN-λ, leading to increased HCV RNA replication in both HCV replicon cells and JFH1 HCV culture system. In line with this, SOCS1 over-expression inhibited STAT1 phosphorylation, attenuated IFN-stimulated response elements (ISRE) reporter activity, and blocked IFN-stimulated genes (ISGs) expression. Finally, we measured SOCS1 mRNA expression levels in peripheral blood mononuclear cells (PBMCs) with or without IFN-α treatment from 48 chronic hepatitis C patients and we found the baseline SOCS1 expression levels are higher in treatment non-responders than in responders before IFN-α treatment. Taken together, SOCS1 acts as a suppressor for both type I and type III IFNs and is negatively associated with sustained virological response (SVR) to IFN-based therapy in patients with HCV. More importantly, faster but shorter induction of SOCS1 by IFN-λ may contribute to delayed but prolonged activation of IFN signaling and ISG expression kinetics by type III IFN.
Conflict of interest statement
Figures
Similar articles
-
IFN-λ Inhibits MiR-122 Transcription through a Stat3-HNF4α Inflammatory Feedback Loop in an IFN-α Resistant HCV Cell Culture System.PLoS One. 2015 Dec 11;10(12):e0141655. doi: 10.1371/journal.pone.0141655. eCollection 2015. PLoS One. 2015. PMID: 26657215 Free PMC article.
-
MxA is a positive regulator of type I IFN signaling in HCV infection.J Med Virol. 2017 Dec;89(12):2173-2180. doi: 10.1002/jmv.24867. Epub 2017 Sep 19. J Med Virol. 2017. PMID: 28561372
-
ISG12a inhibits HCV replication and potentiates the anti-HCV activity of IFN-α through activation of the Jak/STAT signaling pathway independent of autophagy and apoptosis.Virus Res. 2017 Jan 2;227:231-239. doi: 10.1016/j.virusres.2016.10.013. Epub 2016 Oct 21. Virus Res. 2017. PMID: 27777077
-
Understanding the molecular mechanism(s) of hepatitis C virus (HCV) induced interferon resistance.Infect Genet Evol. 2013 Oct;19:113-9. doi: 10.1016/j.meegid.2013.06.025. Epub 2013 Jul 5. Infect Genet Evol. 2013. PMID: 23831932 Review.
-
Recent advances in the anti-HCV mechanisms of interferon.Acta Pharm Sin B. 2014 Aug;4(4):241-7. doi: 10.1016/j.apsb.2014.06.010. Epub 2014 Jul 14. Acta Pharm Sin B. 2014. PMID: 26579391 Free PMC article. Review.
Cited by
-
Tim-3 suppression combined with TLR3 activation enhances antiviral immune response in patients with chronic HCV infection.J Int Med Res. 2016 Aug;44(4):806-16. doi: 10.1177/0300060516647548. Epub 2016 Jun 21. J Int Med Res. 2016. PMID: 27329385 Free PMC article.
-
Phase I clinical trial of a novel autologous modified-DC vaccine in patients with resected NSCLC.BMC Cancer. 2017 Dec 21;17(1):884. doi: 10.1186/s12885-017-3859-3. BMC Cancer. 2017. PMID: 29268708 Free PMC article. Clinical Trial.
-
The IFN-λ4 Conundrum: When a Good Interferon Goes Bad.J Interferon Cytokine Res. 2019 Oct;39(10):636-641. doi: 10.1089/jir.2019.0044. Epub 2019 Jun 26. J Interferon Cytokine Res. 2019. PMID: 31241411 Free PMC article. Review.
-
IFN-λ1 Displays Various Levels of Antiviral Activity In Vitro in a Select Panel of RNA Viruses.Viruses. 2021 Aug 12;13(8):1602. doi: 10.3390/v13081602. Viruses. 2021. PMID: 34452467 Free PMC article.
-
SOCS1 is an inducible negative regulator of interferon λ (IFN-λ)-induced gene expression in vivo.J Biol Chem. 2017 Oct 27;292(43):17928-17938. doi: 10.1074/jbc.M117.788877. Epub 2017 Sep 12. J Biol Chem. 2017. PMID: 28900038 Free PMC article.
References
Publication types
MeSH terms
Substances
LinkOut - more resources
Full Text Sources
Other Literature Sources
Research Materials
Miscellaneous
