. 2015 Jul 21:5:12298.
doi: 10.1038/srep12298.

Network analysis of immunotherapy-induced regressing tumours identifies novel synergistic drug combinations

Affiliations

Network analysis of immunotherapy-induced regressing tumours identifies novel synergistic drug combinations

W Joost Lesterhuis et al. Sci Rep. .

Abstract

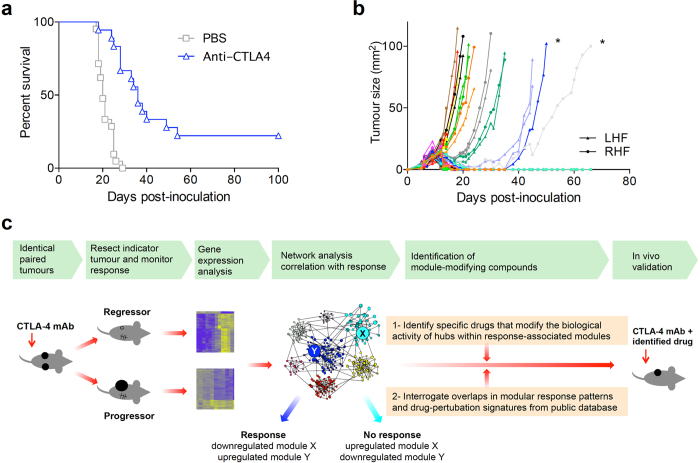
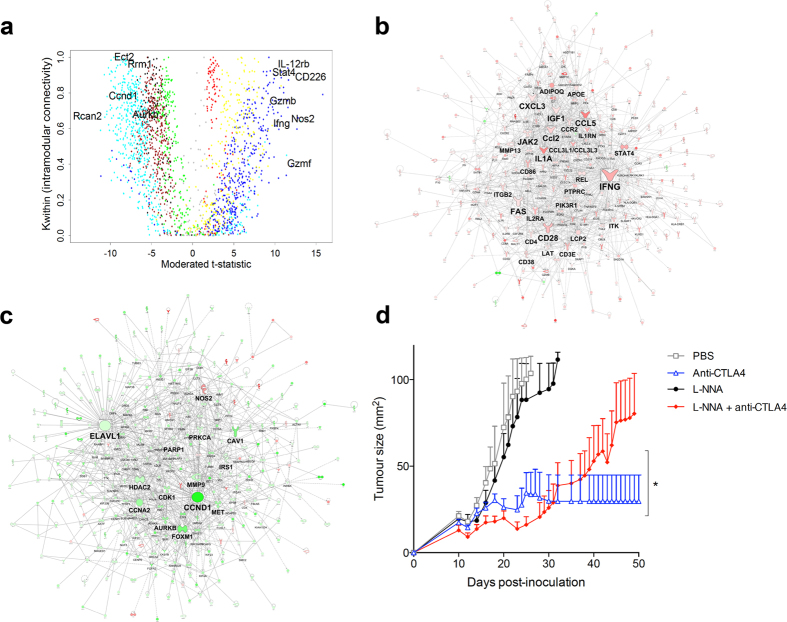
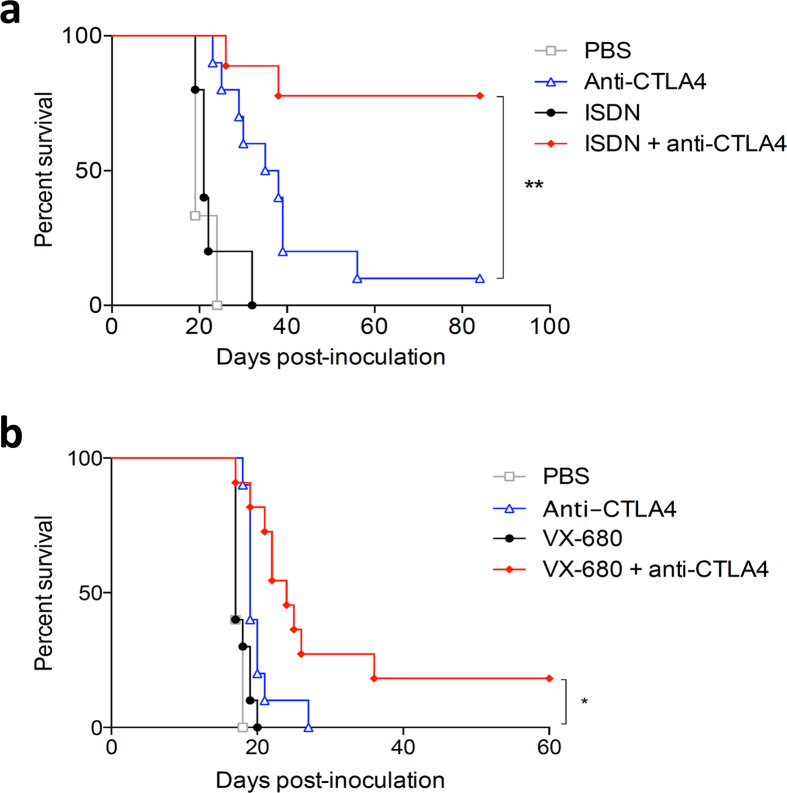
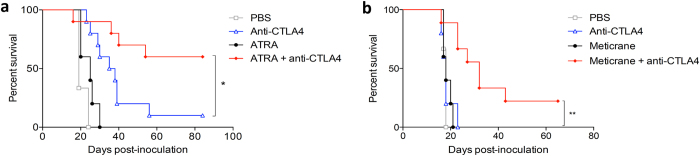
Cancer immunotherapy has shown impressive results, but most patients do not respond. We hypothesized that the effector response in the tumour could be visualized as a complex network of interacting gene products and that by mapping this network we could predict effective pharmacological interventions. Here, we provide proof of concept for the validity of this approach in a murine mesothelioma model, which displays a dichotomous response to anti-CTLA4 immune checkpoint blockade. Network analysis of gene expression profiling data from responding versus non-responding tumours was employed to identify modules associated with response. Targeting the modules via selective modulation of hub genes or alternatively by using repurposed pharmaceuticals selected on the basis of their expression perturbation signatures dramatically enhanced the efficacy of CTLA4 blockade in this model. Our approach provides a powerful platform to repurpose drugs, and define contextually relevant novel therapeutic targets.


Figures

Figure 1
Figure 1. Treatment with CTLA4 blockade results in dichotomous and symmetric responses in identical tumor-bearing mice.
(a) BALB/c mice were inoculated s.c. with AB1-HA mesothelioma cells on day 0, followed by i.p. injection of 200 μg anti-CTLA4 (n = 18) or PBS on day 6 or 7 (n = 21 mice, pooled data from 2 independent experiments). (b) Bilaterally inoculated AB1-HA tumor-bearing mice were treated with anti-CTLA4 on day 5 or 6 (n = 30 mice, pooled data from 2 independent experiments, colour-coded per mouse). Asymmetric responding tumours are marked with an asterisk. (c) Graphic representation of the experimental approach.
Figure 2
Figure 2. Network analysis of gene expression data from regressing versus non-regressing tumours identifies associated modules.
(a) Unsupervised hierarchical cluster analysis of microarray data from unilaterally removed AB1-HA tumours from responders (RS), non-responders (NR) and untreated mice (UT), with tumor growth curves. (b) A co-expression network was constructed by applying the WGCNA algorithm. Eight modules were identified (tagged by colour coding). (c) Modules were related to treatment response by identifying differentially expressed genes between responders and non-responders, and plotting the differential t-statistics as box-and-whisker plots on a module-by-module basis. The dashed horizontal lines correspond to FDR < 0.001. (d) Canonical pathways enriched in module 2 (immune module). Data analysis was performed with Ingenuity Systems software. (e) AB1-HA bearing mice were treated with anti-CTLA4 200 μg on day 6 after tumor inoculation with or without a CD8 depleting antibody 150 μg i.v., one day before anti-CTLA4, followed by 100 μg i.p. every 3 days, 6 dosages in total (PBS n = 3; anti-CTLA4 n = 10; anti-CTLA4 + anti-CD8 n = 5) (**p < 0.01). (f) Canonical pathways enriched in module 4 (cancer module).
Figure 3
Figure 3. Computational identification of hubs associated with the response to checkpoint blockade.
(a) Weighted gene correlation network analysis: the x axis depicts the differential expression of the genes, the y-axis the Kwithin value, a measure of connectivity; the genes are colour-coded per module similar to Fig 2c (blue codes for genes within the immune module; cyan for genes within the cancer module) (b) Prior knowledge-based graphical reconstruction of the wiring diagram of the immune module and (c) the cancer module. (d) Tumor growth curve of AB1-HA tumour-bearing mice treated with anti-CTLA4 in combination with competitive NOS2 inhibitor L-NNA, showing abrogation of anti-CTLA4 efficacy.
Figure 4
Figure 4. Drugs that target response-associated hubs synergize with anti-CTLA4.
(a) Co-treatment with ISDN or (b) AURKB inhibitor VX680 improved therapeutic efficacy of anti-CTLA4. Representative Kaplan Meier survival curves of 3 independent experiments are shown, n = 10 mice per arm; *p < 0.05; **p < 0.01.
Figure 5
Figure 5. Repurposed drugs that phenocopy the gene expression profile of response-associated modules synergize with anti-CTLA4.
Survival curve of AB1-HA tumour-bearing mice treated with anti-CTLA4 in combination with (a) ATRA and (b) meticrane improved therapeutic efficacy of anti-CTLA4. Representative survival curves of 3 independent experiments are shown, n = 10 mice per arm; *p < 0.05; **p < 0.01.

References

    1. Hodi F. S. et al. Improved Survival with Ipilimumab in Patients with Metastatic Melanoma. New Engl J Med 363, 711–723, (2010). - PMC - PubMed
    1. Topalian S. L. et al. Safety, activity, and immune correlates of anti-PD-1 antibody in cancer. New Engl J Med 366, 2443–2454 (2012). - PMC - PubMed
    1. Lesterhuis W. J., Haanen J. B. & Punt C. J. Cancer immunotherapy - revisited. Nat Rev Drug Discov 10, 591–600 (2011). - PubMed
    1. Page D. B., Postow M. A., Callahan M. K., Allison J. P. & Wolchok J. D. Immune modulation in cancer with antibodies. Annu Rev Med 65, 185–202 (2014). - PubMed
    1. Wolchok J. D. et al. Nivolumab plus ipilimumab in advanced melanoma. The New Engl J Med 369, 122–133 (2013). - PMC - PubMed

Publication types