. 2015 Jul 21:6:7802.
doi: 10.1038/ncomms8802.

Intestinal CD169(+) macrophages initiate mucosal inflammation by secreting CCL8 that recruits inflammatory monocytes

Affiliations

Intestinal CD169(+) macrophages initiate mucosal inflammation by secreting CCL8 that recruits inflammatory monocytes

Kenichi Asano et al. Nat Commun. .

Abstract

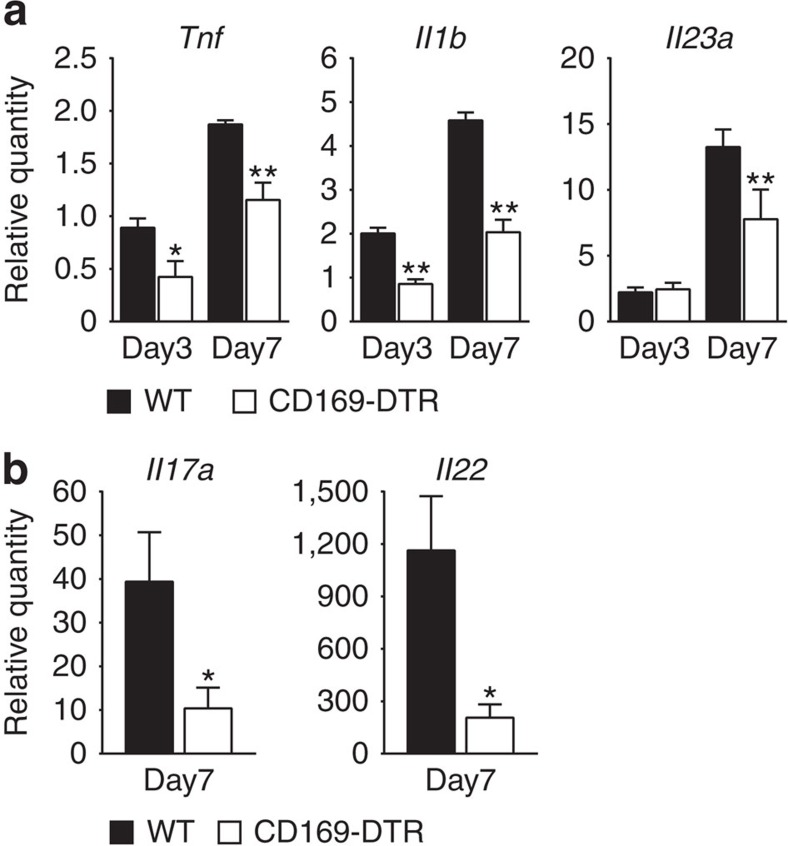
Lamina propria (LP) macrophages are constantly exposed to commensal bacteria, and are refractory to those antigens in an interleukin (IL)-10-dependent fashion. However, the mechanisms that discriminate hazardous invasion by bacteria from peaceful co-existence with them remain elusive. Here we show that CD169(+) macrophages reside not at the villus tip, but at the bottom-end of the LP microenvironment. Following mucosal injury, the CD169(+) macrophages recruit inflammatory monocytes by secreting CCL8. Selective depletion of CD169(+) macrophages or administration of neutralizing anti-CCL8 antibody ameliorates the symptoms of experimentally induced colitis in mice. Collectively, we identify an LP-resident macrophage subset that links mucosal damage and inflammatory monocyte recruitment. Our results suggest that CD169(+) macrophage-derived CCL8 serves as an emergency alert for the collapse of barrier defence, and is a promising target for the suppression of mucosal injury.


Figures

Figure 1
Figure 1. CD169+ macrophages in the lamina propria.
(a) Flow cytometry of LP myeloid cells in the colon. CD11b+ and/or CD11c+ (‘myeloid') cells were enriched by magnetic sorting and stained for Ly6C, CD64, CD169 and Siglec-F or CD103. Dead cells were excluded by 7AAD staining. Numbers indicate frequencies of CD64lo, CD64int, CD64hi, Siglec-F+ and CD103+ fractions among 7AAD cells (left). Frequencies of CD169+ cells in each fraction are presented (right). Dashed lines represent isotype control. (b) Flow cytometry of LP myeloid cells in the colon of CX3CR1gfp mice. Numbers indicate frequencies of CX3CR1neg, CX3CR1int and CX3CR1hi fractions among 7AAD myeloid cells (left). Frequencies of CD169+ cells in CX3CR1neg, CX3CR1int and CX3CR1hi fractions are presented (right). Dashed lines represent unstained control. (a,b) Representative of three independent experiments. (c) Subfractionation of LP myeloid cells in the colon according to the expression of CD11b and CD11c. Fifteen percent of the 7AAD myeloid cells expressed CD169 (top right). The specificity of anti-CD169 antibody was confirmed by staining LP myeloid cells of CD169 knockout (KO) mouse (bottom left). LP myeloid cells were subdivided into four subpopulations (R1–R4) based on the differential expression of CD169, CD11b and CD11c. Numbers indicate frequencies among 7AAD myeloid cells. Representative of five independent experiments. (d) Flow cytometry analysis of a panel of surface molecules on CD169+ and CD169 cells in the colon. Shadow represents unstained control. Representative of two independent experiments. (e) CD169+ macrophages were localized distantly from the epithelial border. Consecutive colon sections from CX3CR1gfp mice were stained for GFP (left) or CD169 (middle). Original magnification, × 20. Scale bars represent 100 μm. The distance of CX3CR1+ cells or CD169+ cells from the epithelial border was quantified (right). *P<0.05, Student's t-test. Representative of two independent experiments. DAPI, 4,6-diamidino-2-phenylindole.
Figure 2
Figure 2. Monocyte-derived origin of gut CD169+ macrophages.
(a) Expression of YFP in the LP myeloid cells from CD169-Cre-YFP reporter mice. LP myeloid cells in the colon were stained for Ly6C, CD64 and Siglec-F or CD103 and fractionated as in Fig. 1a. Numbers indicate frequencies of YFP+ cells among each fraction. Shadows indicate WT control. Representative of two independent experiments. (b) Rosa26-YFP mice (host, left) or CD169-DTR mice (host, right) were parabiotically joined with CD169-Cre-YFP mice (donor). DT was injected into CD169-Cre-YFP and CD169-DTR parabionts (right) 1 week before separation. LP myeloid cells were analysed by flow cytometry for the presence of YFP+ cells 5 weeks after initial cojoinment. Numbers indicate frequencies among 7AAD LP myeloid cells. Representatives of four pairs are shown.
Figure 3
Figure 3. Amelioration of DSS-induced colitis in CD169-DTR mice.
(a) Depletion and kinetics of recovery of CD169+ cells in the colon of DT-injected CD169-DTR mice. Top, numbers indicate frequencies of CD169+ cells among 7AAD myeloid cells enriched by magnetic sorting at indicated time points. Bottom, average frequencies of CD169+ (R1) and CD169 cells (R2–R4, see Fig. 1c). Error bars mark s.d., n=3 mice, *P<0.05, one-way analysis of variance (ANOVA) with multiple comparison. (b) Injection of DT into CD169-DTR mice depletes CD64hi, CD169+ but not CD64hi, CD169-resident macrophages. Left, numbers indicate frequencies of CD64lo monocytes, CD64int monocytes and CD64hi-resident macrophages among 7AAD myeloid cells. Right, frequencies of CD169+ cells among Ly6Clo, CD64hi-resident macrophages. Shadow, isotype control. (c) Depletion of CD169+ macrophages protects mice from DSS-induced colitis. DT was injected on days −1 and 3. The average body weight change and s.e.m. of 4–6 mice. *P<0.05, two-way ANOVA with multiple comparison. Representative data of five independent experiments. (d) Macroscopic observation of colons on day 7. Representative images of 12 mice. (e) Left, haematoxylin and eosin staining of paraffin sections from naive (left) or colitis (right) WT (top) or CD169-DTR mice (bottom). Loss of goblet cells in WT day 7, but not in CD169-DTR day 7 colon (insets). Scale bar, 100 μm. Original magnification, × 20. (f) F4/80 staining of the colon on DSS day 5. Original magnification, × 20. Scale bars, 200 μm. Inset, diffuse infiltration of F4/80+ cells in the villi of WT colon. Original magnification, × 40. Scale bar, 20 μm. Right, average numbers and s.d. of F4/80+cells per high-power field (HPF). *P<0.05, Student's t-test. Representative of two independent experiments. (g) Flow cytometry of colon myeloid cells from WT naive (top left), WT colitis (middle left) or CD169-DTR colitis (bottom left) mice. Numbers indicate frequencies among 7AAD myeloid cells. Representative data of four mice are shown. (h) Selective reduction of Ly6Chi, CD64lo and Ly6Cint, CD64int monocytes in the colon LP of CD169-DTR colitis mice. Absolute numbers of infiltrating cells in g. Average numbers and s.d. of four mice. Eos: Siglec-F+ eosinophils, Neu: Ly6G+ neutrophils. *P<0.05, NS, not significant, one-way ANOVA. (g,h) Mice were injected with DT on days −1 and 3, and analysed on day 5.
Figure 4
Figure 4. Immune cells are not fully activated in the absence of CD169+ macrophages.
(a) Pro-inflammatory cytokine mRNA levels in LP myeloid cells from WT (black bar) or CD169-DTR (white bar) mice administered with 3.5% DSS for the indicated number of days were determined by qRT–PCR. (b) IL-17 or IL-22 mRNA levels in colon tissues from WT (black bar) or CD169-DTR (white bar) mice that received DSS for 7 days were determined by qRT–PCR. Expression levels were calculated as relative amounts normalized to beta actin and shown as fold induction compared with the expression in WT naive myeloid cells (a) or colon (b). n=4 (a) or 10 (b). Average values are shown with s.d.*P<0.05, **P<0.01, Student's t-test.
Figure 5
Figure 5. Expression of CCL8 mRNA by CD169+ macrophages under inflammatory condition.
(a) CD169+ and CD169 myeloid cells were purified from the LP of WT naive and DSS-induced colitis mice (top) by a cell sorter. Total RNA extracted from fractionated myeloid cells was hybridized to the Affimetrix Mouse Genome 430 2.0 Array chip. Heat map of mRNA upregulated (bottom left) or downregulated (bottom right) in CD169+ macrophages (R1) of colitis mice relative to their expression in CD169+ macrophages of naive mice. Expression levels are displayed as fold induction over naive controls (log2). (b) Upregulated expression of CCL8 mRNA in CD169+ macrophages (R1) 5 days after DSS administration was validated by qRT–PCR. (c) CCL8 mRNA expression 5 days after DSS administration was selectively upregulated in CD169+ cells. Values are presented as fold induction compared with the expression levels in naive CD169+ macrophages (b) or cells in R4 (c). Average values and s.d. of triplicate experiment are shown. *P<0.05, Student's t-test, **P<0.01, one-way analysis of variance (ANOVA). (d) CCL8 mRNA expression is upregulated in response to DSS administration in LP CD11b+ cells. LP CD11b+ cells in the colon were enriched by magnetic sorting from mice administered with DSS. CCL8 mRNA expression at the indicated time point was quantified by qRT–PCR and expressed as fold induction compared with naive CD11b+ cells. Data are representative of two independent experiments. *P<0.05, one-way ANOVA.
Figure 6
Figure 6. CCL8 is exclusively produced by CD169+ macrophages in response to sterile and non-sterile inflammatory stimuli.
(a) CCL8 concentration in the culture medium of colon explant was quantified by ELISA and divided by the dry weight of the explant. Average and s.d. of three mice. Representative data from two independent experiments. *P<0.05, Student's t-test. (b) LP myeloid cells from the colon of indicated mice were cultured overnight in vitro. CCL8 concentrations in the culture medium were quantified. Average and s.d. of three mice. *P<0.05, two-way analysis of variance (ANOVA). (c) CD11b+, CD169+ and CD11b+, CD169 cells from the colon of WT naive or colitis mice were fractionated by a cell sorter. Different numbers of fractionated macrophages were cultured in vitro. CCL8 concentrations in the culture supernatant were quantified. Representative data from two independent experiments. Error bar marks s.d. *P<0.05, two-way ANOVA. (df) Bone marrow (BM) cells were cultured for 5 days in the presence of M-CSF (black bar) or GM-CSF (white bar) to induce or not to induce CD169 expression. Those cells were treated in vitro with various stimulants for 24 h. CCL8 (d), TNFα (e) and IL-6 (f) concentrations in the culture medium. Average values and s.d. of a triplicate experiment. Statistical differences relative to unstimulated BM cells (−) were determined. *P<0.05, Student's t-test. Representative data of two independent experiments. (g) Immunohistochemistry of colon sections from DSS-fed WT mice. Arrowheads indicate contact of CD169+ cells with TUNEL+ cells. Original magnification, × 20. Scale bars, 100 μm. (h) CCL8 attracts monocytic WEHI-3 cells in vitro. WEHI-3 cells were seeded in the upper chamber, whereas the lower chamber was supplied with serum-free medium with or without 100 nM CCL8. The number of cells in the lower chamber at 4 h was enumerated. Average values and s.d. of triplicate experiment. *P<0.05, Student's t-test. Data are representative of three independent experiments. (i) Cells that migrated towards CCL8 in vivo showed mononuclear morphology. Cells retrieved from the Matrigel plugs supplemented with CCL8 were cytospun onto a glass slide, and stained with modified Giemsa. Scale bar, 10 μm. (j) The number of cells per milligram Matrigel plug was quantified by flow cytometry. Average values and s.d. of three mice. *P<0.05, Student's t-test. Data are representative of three independent experiments. DAPI, 4,6-diamidino-2-phenylindole.
Figure 7
Figure 7. Amelioration of DSS-induced colitis by anti-CCL8-neutralizing antibody.
(a) WT mice were administered with 3% DSS in drinking water for 7 days. One hundred micrograms of anti-CCL8 antibody (clone 17D6, white squares) or isotype IgG (black squares) was injected intravenously into the mice on days 3 and 4. Body weight change relative to the initial value was plotted up to 14 days after the DSS administration. Values are averages and s.e.m. of four to six mice per group. Representative data of four independent experiments are shown. *P<0.05, two-way analysis of variance with multiple comparison. (b) Macroscopic observation of the colon 7 days after the administration of DSS from WT mice injected with isotype IgG (top two colons) or anti-CCL8 antibody (bottom two colons). (c) Average lengths and s.d. of four colons are shown. *P<0.05, Student's t-test. (d) Haematoxylin and eosin staining of colon section from WT mice that received DSS for 5 days. The mice were treated with isotype IgG (left) or anti-CCL8 antibody (right). Representative images of four mice per group are shown. Scale bar, 200 μm. Original magnification, × 20. (e) IL-17 and IL-22 mRNA expression levels in colon tissue of WT mice on day 7, which were treated with isotype IgG (black bar) or anti-CCL8 antibody (white bar) were determined by qRT–PCR. Expression levels are shown as fold induction relative to the expression level in WT naive colon. Average values and s.e.m. of four colons are shown. P<0.05. NS, not significant, Student's t-test. Representative data of three independent experiments are shown.

References

    1. Pedron T. & Sansonetti P. Commensals, bacterial pathogens and intestinal inflammation: an intriguing menage a trois. Cell Host Microbe 3, 344–347 (2008) . - PubMed
    1. Vance R. E., Isberg R. R. & Portnoy D. A. Patterns of pathogenesis: discrimination of pathogenic and nonpathogenic microbes by the innate immune system. Cell Host Microbe 6, 10–21 (2009) . - PMC - PubMed
    1. Denning T. L., Wang Y. C., Patel S. R., Williams I. R. & Pulendran B. Lamina propria macrophages and dendritic cells differentially induce regulatory and interleukin 17-producing T cell responses. Nat. Immunol. 8, 1086–1094 (2007) . - PubMed
    1. Varol C., Zigmond E. & Jung S. Securing the immune tightrope: mononuclear phagocytes in the intestinal lamina propria. Nat. Rev. Immunol. 10, 415–426 (2010) . - PubMed
    1. Gordon S. & Taylor P. R. Monocyte and macrophage heterogeneity. Nat. Rev. Immunol. 5, 953–964 (2005) . - PubMed

Publication types