. 2015 Jul 15;29(14):1493-506.
doi: 10.1101/gad.264515.115. Epub 2015 Jul 20.

β-Catenin destruction complex-independent regulation of Hippo-YAP signaling by APC in intestinal tumorigenesis

Affiliations

β-Catenin destruction complex-independent regulation of Hippo-YAP signaling by APC in intestinal tumorigenesis

Jing Cai et al. Genes Dev. .

Abstract

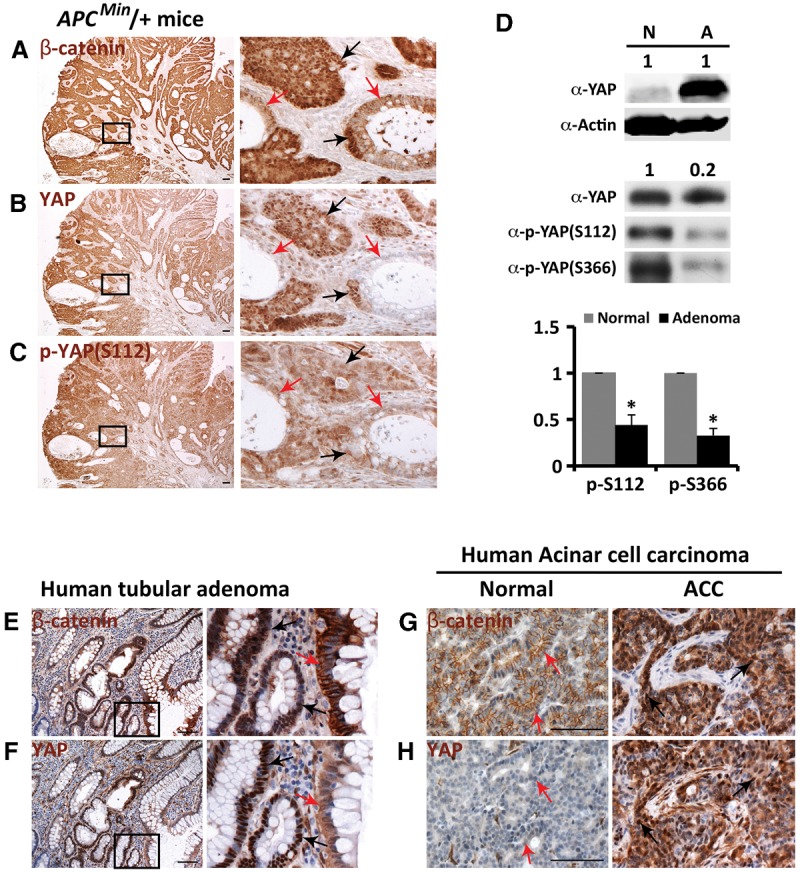
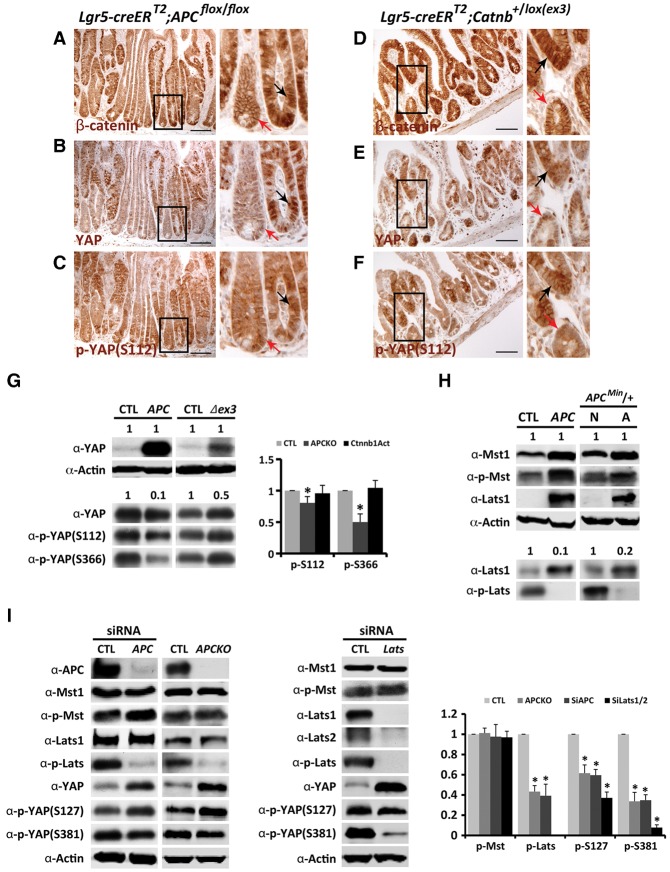
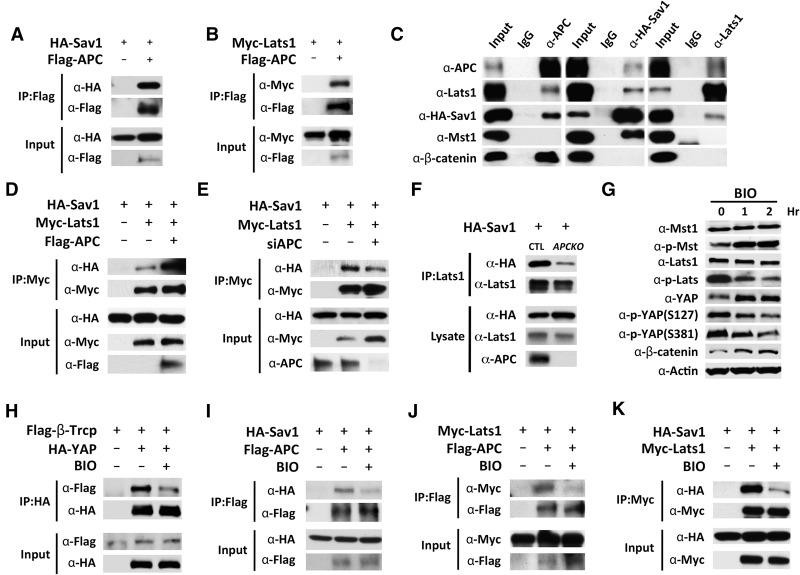
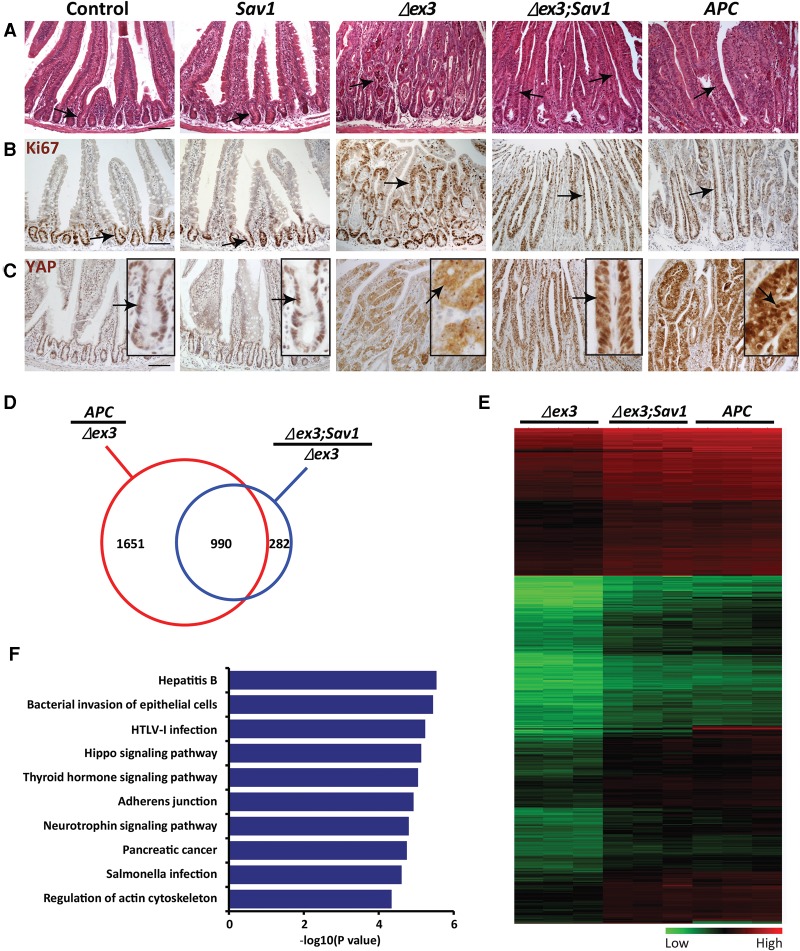
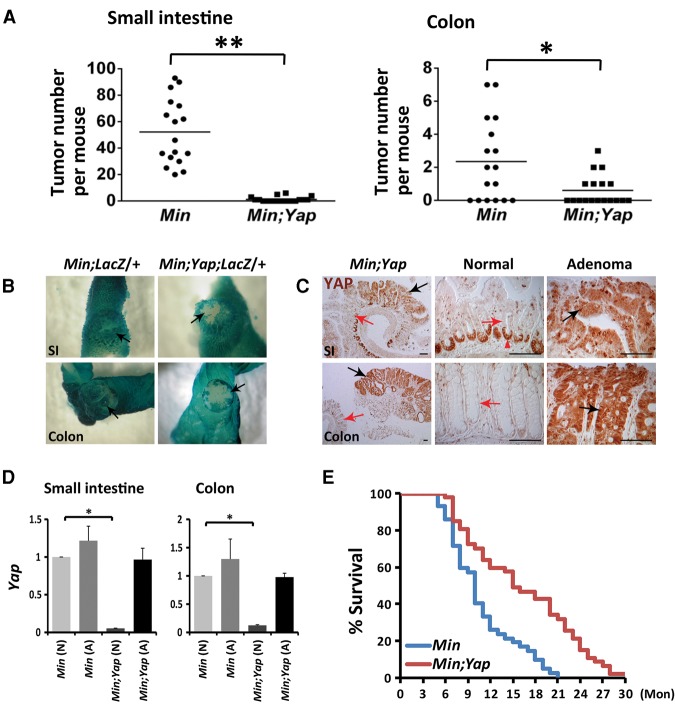
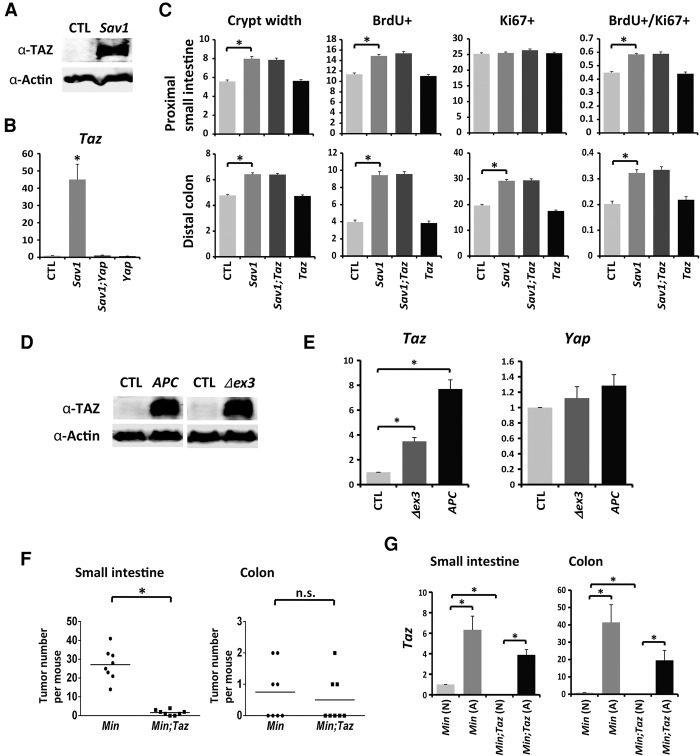
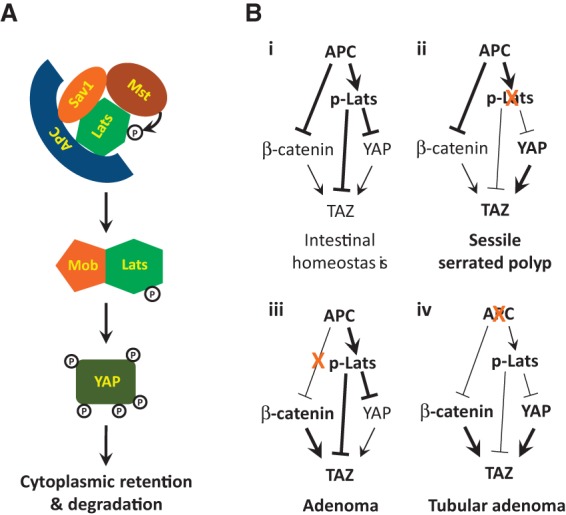
Mutations in Adenomatous polyposis coli (APC) underlie familial adenomatous polyposis (FAP), an inherited cancer syndrome characterized by the widespread development of colorectal polyps. APC is best known as a scaffold protein in the β-catenin destruction complex, whose activity is antagonized by canonical Wnt signaling. Whether other effector pathways mediate APC's tumor suppressor function is less clear. Here we report that activation of YAP, the downstream effector of the Hippo signaling pathway, is a general hallmark of tubular adenomas from FAP patients. We show that APC functions as a scaffold protein that facilitates the Hippo kinase cascade by interacting with Sav1 and Lats1. Consistent with the molecular link between APC and the Hippo signaling pathway, genetic analysis reveals that YAP is absolutely required for the development of APC-deficient adenomas. These findings establish Hippo-YAP signaling as a critical effector pathway downstream from APC, independent from its involvement in the β-catenin destruction complex.

Keywords: APC; Hippo signaling; TAZ; YAP; tumorigenesis; β-catenin.


Figures

Figure 1.
Figure 1.
YAP activation in APCMin/+ mouse colonic adenomas, human tubular adenomas, and acinar cell carcinomas. (AC) β-Catenin, YAP, and p-YAP staining in serial sections of 3-mo-old APCMin/+ mouse colonic adenomas. Black arrows indicate neoplastic colonic epithelia, and red arrows indicate their nonneoplastic neighbors. Bar, 100 µm. (D) Western blot analysis. Protein extracts from normal tissues (N) and adenomas (A) of 3-mo-old APCMin/+ mouse colons were probed with the indicated antibodies. (Top gels) Equal amounts of normal and adenoma extracts were analyzed (1:1). (Bottom gels) Normal extract and fivefold less adenoma extract (1:0.2) were analyzed for YAP, p-YAPS112, and p-YAPS366. The ratios of p-YAPS112 over total YAP and of p-YAPS366 over total YAP were quantified. Data are mean ± SD. n = 3. (*) P < 0.001, t-test. (E,F) β-Catenin and YAP staining in serial sections of human tubular adenomas. Black arrows indicate neoplastic colonic epithelia, and red arrows indicate their nonneoplastic neighbors. Bar, 100 µm. (G,H) β-Catenin and YAP staining in serial sections of human acinar cell carcinomas (ACCs). Black arrows indicate acinar cell carcinomas, and red arrows indicate normal acinar cells. Bar, 100 µm.
Figure 2.
Figure 2.
APC functions independently of β-catenin to restrict YAP activity. (AC) β-Catenin, YAP, and p-YAP staining in serial sections of APC-deficient (Lgr5-EGFP-IRES-creERT2;APCflox/flox) jejunum 15 d after tamoxifen injection. Black arrows indicate APC-deficient crypts, and red arrows indicate normal crypts. Bar, 100 µm. (DF) β-Catenin, YAP, and p-YAP staining in serial sections of β-catenin-stabilized (Lgr5-EGFP-IRES-creERT2;Catnb+/lox(ex3)) jejunum 15 d after tamoxifen injection. Black arrows indicate β-catenin-stabilized crypts, and red arrows indicate normal crypts. Bar, 100 µm. (G) Western blot analysis. Protein extracts from APC-deficient, β-catenin-stabilized, and control jejunal tissues 4 wk after tamoxifen injection were probed with the indicated antibodies. (Top gels) Equal amounts of the indicated extracts (1:1) were analyzed. (Bottom gels) Normal and diluted mutant extracts (1:0.1 for APC, and 1:0.5 for Δex3) were analyzed for YAP, p-YAPS112, and p-YAPS366. The ratios of p-YAPS112 over total YAP and of p-YAPS366 over total YAP were quantified. Data are mean ± SD. n = 3. (*) P < 0.05, t-test. (H) Western blot analysis. Protein extracts from APC-deficient and control jejunal tissues 4 wk after tamoxifen injection and protein extracts from normal tissues and adenomas of 3-mo-old APCMin/+ mouse colons were probed with the indicated antibodies. (Top gels) Equal amounts of the indicated extracts (1:1) were analyzed. (Bottom gels) Normal and diluted mutant extracts (1:0.1 for APC mutant, and 1:0.2 for APCMin/+ adenoma) were analyzed for Lats1 and p-Lats. (I) Western blot analysis. Protein extracts from HEK293 (control), HEK293 with CRISPR–Cas9-engineered APC knockout (APCKO), and HEK293 cells with APC or Lats1/2 RNAi were probed with the indicated antibodies. The ratios of p-Mst over Mst1, p-Lats over Lats1, p-YAPS112 over total YAP, and p-YAPS366 over total YAP were quantified. Data are mean ± SD. n = 3. (*) P < 0.001, t-test.
Figure 3.
Figure 3.
Physical interactions among APC, Sav1, and Lats1 and their regulation by GSK-3β. (AC) APC interacts with Sav1 and Lats1 in HEK293 cells. (A,B) Co-IP between Flag-APC and HA-Sav1 or Myc-Lats1. (C) Co-IP between endogenous APC and Lats1 and between endogenous APC and HA-Sav1. HA-Sav1 was used for co-IP analysis because endogenous Sav1 expression is very low in HEK293 cells. (D) Overexpression of APC enhanced Sav1–Lats1 interactions. (E) siRNA knockdown of endogenous APC decreased Sav1–Lats1 interactions. (F) HEK293 (control) and HEK293 with CRISPR–Cas9-engineered APC knockout (APCKO) were analyzed for co-IP between Sav1 and endogenous Lats1, showing reduced Sav1–Lats1 interaction in the APC knockout cells. (G) Western blot analysis of HEK293 cells after 6-bromoindirubin-3′-oxime (BIO) treatment for the indicated times. (H) Co-IP analysis of β-Trcp–YAP interactions. Note the reduction of β-Trcp–YAP interactions in HEK293 cells treated with BIO for 1 h. (IK) similar to H except that APC–Sav1 (I), APC–Lats1 (J), and Sav1–Lats1 (K) interactions were analyzed.
Figure 4.
Figure 4.
The combined activation of YAP and β-catenin resembles the APC-deficient phenotype. (AC) Histology (A), Ki67 staining (B), and YAP staining (C) in control, Sav1 mutant (Lgr5-EGFP-IRES-creERT2;Sav1flox/flox), β-cateninΔex3 (Lgr5-EGFP-IRES-creERT2;Catnb+/lox(ex3)), β-cateninΔex3;Sav1 double-mutant (Lgr5-EGFP-IRES-creERT2;Catnb+/lox(ex3);Sav1flox/flox), and APC mutant (Lgr5-EGFP-IRES-creERT2;APCflox/flox) jejunum 4 wk after tamoxifen injection. Black arrows indicate crypts. Bar, 100 µm. (D) Microarray analysis. The red circle indicates genes up-regulated by at least twofold in APC mutant jejunum compared with β-cateninΔex3 jejunum. The blue circle indicates genes up-regulated by at least twofold in β-cateninΔex3;Sav1 double-mutant jejunum compared with β-cateninΔex3 jejunum. Nine-hundred-ninety genes representing the overlap of the two gene sets are also shown. (E) Heat map analysis of expression profiles of the 990 shared genes that represent YAP-dependent, β-catenin-independent targets downstream from APC. (F) The top 10 enriched pathways as detected by gene set enrichment analysis of the 990 genes. The 990 shared genes that represent YAP-dependent, β-catenin-independent targets downstream from APC were analyzed.
Figure 5.
Figure 5.
YAP is required for intestinal tumorigenesis in APCMin/+ mice. (A) Quantification of the number of adenomas in the small intestines and the colons of 17 APCMin/+;Yapflox/flox (Min) and 18 VilCre;APCMin/+;Yapflox/flox (Min;Yap) mice at the age of 3 mo. (*) P < 0.005; (**) P < 0.001, t-test. (B) β-Galactosidase staining of Rosa26LacZ reporter in VilCre;APCMin/+;Rosa26LacZ/+ (Min;LacZ/+) and VilCre;APCMin/+;Yapflox/flox;Rosa26LacZ/+ (Min;Yap;LacZ/+) intestines. Note the blue (LacZ-positive) adenomas in the small intestines (SI) and colons of control Min;LacZ/+ mice and the white (LacZ-negative) adenomas in the colon and small intestine of Min;Yap;LacZ/+ mice. Black arrows indicate adenomas. (C) YAP staining in the rare adenomas in the small intestines (SI) and colons of Min;Yap mice. Note the absence of YAP staining in the nonneoplastic crypts (red arrows) and positive YAP staining in the neoplastic epithelia (black arrows). The red arrowhead indicates nonspecific staining of the antibody in the paneth cells in the ilea. Bar, 100 µm. (D) Real-time PCR analysis of Yap mRNA levels in normal tissues (N) and adenomas (A) from the small intestines and colons of APCMin/+; Yapflox/flox(Min) and VilCre;APCMin/+; Yapflox/flox (Min;Yap) mice. Note the sustained expression of Yap in Min;Yap adenomas but not Min;Yap normal tissues. Data are mean ± SD. n = 3. (*) P < 0.005, t-test. (E) Significantly prolonged life span in the Min;Yap mice compared with the control Min mice. Forty-two APCMin/+;Yapflox/flox (Min) and 47 VilCre;APCMin/+;Yapflox/flox (Min;Yap) mice were used for analysis. (Mon) Months.
Figure 6.
Figure 6.
TAZ is transcriptionally regulated by YAP and β-catenin and is functionally required for intestinal tumorigenesis upon loss of APC. (A) Western blot analysis of TAZ in colonic crypts of 1-mo-old control and Sav1-deficient (VilCre;Sav1flox/flox) mice. (B) Real-time PCR analysis of Taz mRNA levels in crypts of 1-mo-old control, Sav1 mutant, Yap mutant (VilCre;Yapflox/flox), and Sav1;Yap double-mutant (VilCre;Sav1flox/flox;Yapflox/flox) distal colons. Data are mean ± SD. n = 3. (*) P < 0.005, t-test. (C) Quantification of crypt width (3 mo old) and proliferation (1 mo old) in control, Sav1 mutant (VilCre;Sav1flox/flox), Taz mutant (VilCre;Tazflox/flox), and Sav1;Taz double-mutant (VilCre;Sav1flox/flox;Tazflox/flox) proximal small intestines and distal colons. Data are mean ± SEM. (*) P < 0.005, t-test. (D) Western blot analysis of TAZ in control, APC mutant (Lgr5-EGFP-IRES-creERT2;APCflox/flox), and β-cateninΔex3 (Lgr5-EGFP-IRES-creERT2;Catnb+/lox(ex3)) jejunal tissues 4 wk after tamoxifen injection. (E) Real-time PCR analysis of Taz and Yap mRNA levels in control, β-cateninΔex3 (Lgr5-EGFP-IRES-creERT2;Catnb+/lox(ex3)), and APC mutant (Lgr5-EGFP-IRES-creERT2;APCflox/flox) jejunum 4 wk after tamoxifen injection. Data are mean ± SD. n = 3. (*) P < 0.005, t-test. (F) Quantification of the number of adenomas in the small intestines and colons of eight APCMin/+;Tazflox/flox (Min) and eight VilCre;APCMin/+;Tazflox/flox (Min;Taz) mice at the age of 3 mo. (*) P < 0.005; (n.s.) not significant, t-test. (G) Real-time PCR analysis of Taz mRNA levels in normal tissues (N) and adenomas (A) from the small intestines and the colons of APCMin/+;Tazflox/flox (Min) and VilCre;APCMin/+;Tazflox/flox (Min;Taz) mice. The Taz mRNA level was dramatically decreased in normal VilCre;APCMin/+;Tazflox/flox (Min;Taz) tissue (0.133 ± 0.031) compared with normal APCMin/+;Tazflox/flox (Min) tissue (set as 1). Both APCMin/+;Tazflox/flox (Min) and VilCre;APCMin/+;Tazflox/flox (Min;Taz) adenomas expressed high levels of Taz mRNA. Data are mean ± SD. n = 3. (*) P < 0.005, t-test.
Figure 7.
Figure 7.
A schematic model showing APC-dependent regulation of Hippo–YAP signaling (A) and the contribution of YAP, β-catenin, and TAZ to intestinal tumorigenesis in various genetic backgrounds (B). (A) APC physically interacts with Sav1 and Lats and facilitates phosphorylation of Lats1/2 by Mst1/2. Activated Lats1/2 in complex with Mob1 phosphorylates YAP, resulting in its cytoplasmic retention and β-Trcp-mediated degradation. (B) Dual regulation of Hippo and Wnt signaling by APC. The transcriptional regulation of TAZ by YAP and β-catenin is also illustrated. (Panel i) Under physiological conditions, APC suppresses both YAP/TAZ and β-catenin to achieve intestinal homeostasis. (Panel ii) When Hippo signaling is perturbed (e.g., loss of Sav1), activation of YAP leads to development of SSPs in the colon, while APC retains its function to inactivate β-catenin. When β-catenin is stabilized through mutations that abolish its phosphorylation by GSK-3β and CK1, APC can still suppress YAP/TAZ activity through Hippo signaling. (Panel iii) Activation of β-catenin alone leads to adenoma development in the intestine. (Panel iv) Upon inactivation of APC, both YAP/TAZ and β-catenin are activated, resulting in the development of tubular adenomas.

References

    1. Abraham SC, Wu T-T, Hruban RH, Lee J-H, Yeo CJ, Conlon K, Brennan M, Cameron JL, Klimstra DS. 2002. Genetic and immunohistochemical analysis of pancreatic acinar cell carcinoma: frequent allelic loss on chromosome 11p and alterations in the APC/β-catenin pathway. Am J Pathol 160: 953–962. - PMC - PubMed
    1. Aoki K, Taketo MM. 2007. Adenomatous polyposis coli (APC): a multi-functional tumor suppressor gene. J Cell Sci 120: 3327–3335. - PubMed
    1. Azzolin L, Zanconato F, Bresolin S, Forcato M, Basso G, Bicciato S, Cordenonsi M, Piccolo S. 2012. Role of TAZ as mediator of Wnt signaling. Cell 151: 1443–1456. - PubMed
    1. Azzolin L, Panciera T, Soligo S, Enzo E, Bicciato S, Dupont S, Bresolin S, Frasson C, Basso G, Guzzardo V. 2014. YAP/TAZ incorporation in the β-catenin destruction complex orchestrates the Wnt response. Cell 158: 157–170. - PubMed
    1. Barker N, van Es JH, Kuipers J, Kujala P, van den Born M, Cozijnsen M, Haegebarth A, Korving J, Begthel H, Peters PJ. 2007. Identification of stem cells in small intestine and colon by marker gene Lgr5. Nature 449: 1003–1007. - PubMed

Publication types

MeSH terms