. 2015 Jul;56(8):4431-8.
doi: 10.1167/iovs.15-16547.

Normal Perceptual Sensitivity Arising From Weakly Reflective Cone Photoreceptors

Affiliations

Normal Perceptual Sensitivity Arising From Weakly Reflective Cone Photoreceptors

Kady S Bruce et al. Invest Ophthalmol Vis Sci. 2015 Jul.

Abstract

Purpose: To determine the light sensitivity of poorly reflective cones observed in retinas of normal subjects, and to establish a relationship between cone reflectivity and perceptual threshold.

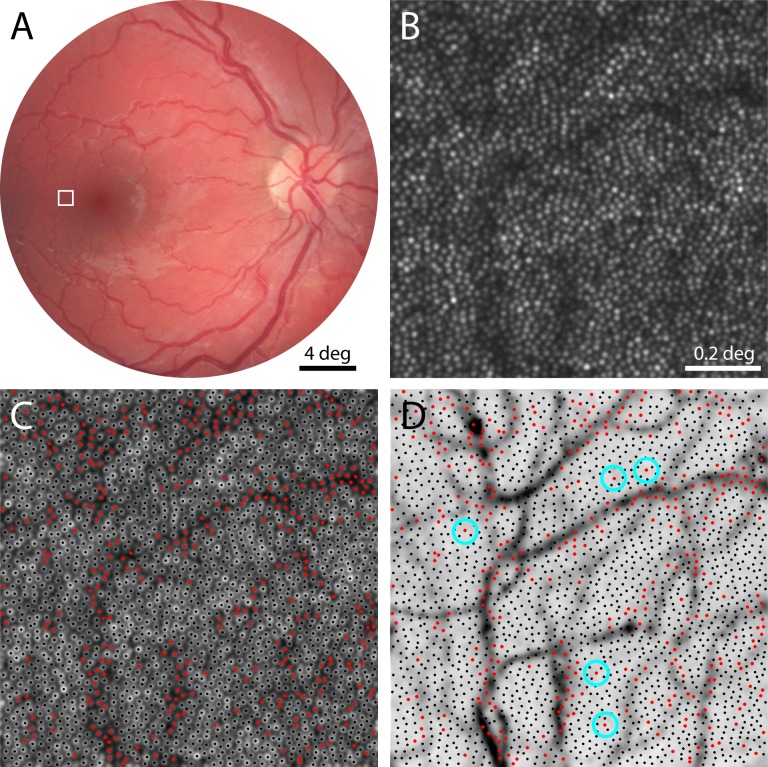
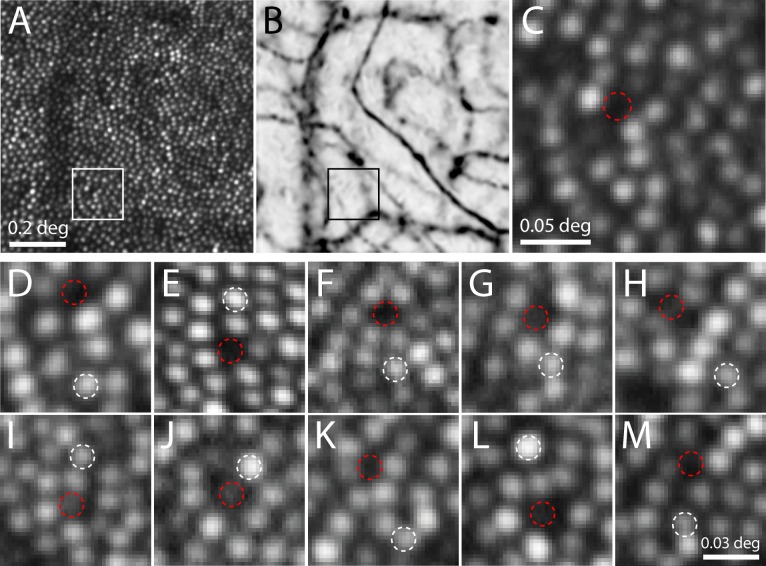
Methods: Five subjects (four male, one female) with normal vision were imaged longitudinally (7-26 imaging sessions, representing 82-896 days) using adaptive optics scanning laser ophthalmoscopy (AOSLO) to monitor cone reflectance. Ten cones with unusually low reflectivity, as well as 10 normally reflective cones serving as controls, were targeted for perceptual testing. Cone-sized stimuli were delivered to the targeted cones and luminance increment thresholds were quantified. Thresholds were measured three to five times per session for each cone in the 10 pairs, all located 2.2 to 3.3° from the center of gaze.

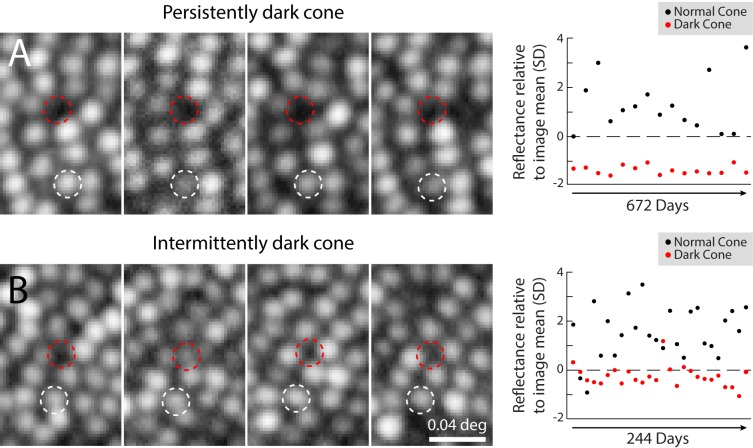
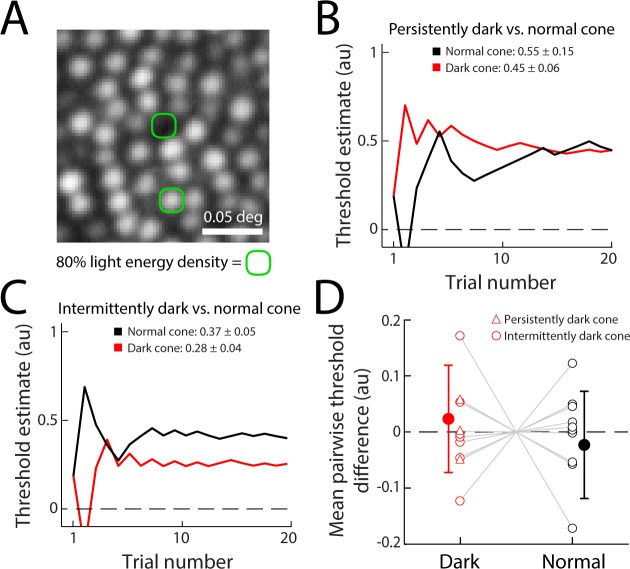
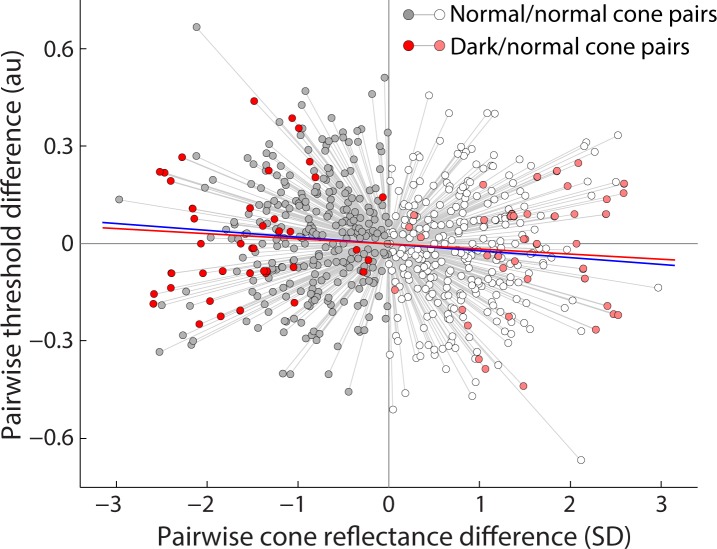
Results: Compared with other cones in the same retinal area, three of 10 monitored dark cones were persistently poorly reflective, while seven occasionally manifested normal reflectance. Tested psychophysically, all 10 dark cones had thresholds comparable with those from normally reflecting cones measured concurrently (P = 0.49). The variation observed in dark cone thresholds also matched the wide variation seen in a large population (n = 56 cone pairs, six subjects) of normal cones; in the latter, no correlation was found between cone reflectivity and threshold (P = 0.0502).

Conclusions: Low cone reflectance cannot be used as a reliable indicator of cone sensitivity to light in normal retinas. To improve assessment of early retinal pathology, other diagnostic criteria should be employed along with imaging and cone-based microperimetry.


Figures

Figure 1
Figure 1
Relationship between poorly reflective cones and retinal vasculature. (A) Fundus photograph of the right eye of one subject. Outlined area shown magnified with AOSLO imaging in (B), where cone photoreceptors appear as bright spots (eccentricity = 2.7°). (C) Same field of view as in (B), with gray levels represented logarithmically to facilitate identification of poorly reflective cones. Cones brighter than the mean image reflectivity are marked with black dots, and those with reflectivity below the mean are indicated with red dots. (D) Vasculature map of same retinal area with cone centers from (C) superimposed, showing that most dark cones are associated with blood vessels. Blue circles mark dark cones that are not situated near blood vessels.
Figure 2
Figure 2
Identifying dark cones for longitudinal imaging and functional testing. AOSLO image (A) and vasculature map (B) from a second subject. Outlined area is magnified in (C), showing a dark gap in the cone mosaic where a cone could ordinarily fit (dashed circle), yet not situated under any blood vessels (eccentricity = 3.3°). (DM) Images of 10 cone pairs on the day they were selected for threshold testing in 5 subjects (white = normal cone, red = dark cone). Persistently dark cones are shown in panels D–F, and intermittently dark cones in panels G–M. All of these sites were confirmed to not reside under blood vessels.
Figure 3
Figure 3
Poor cone reflectivity can be persistent or intermittent. (A) Longitudinal series of AOSLO images from a persistently dark cone in one subject, from the site illustrated in Figures 2A–C, shown on four separate imaging days (left). Dashed circles outline the same set of cones throughout (white = normal cone; red = dark cone), and indicate the locations where microstimulation was targeted for psychophysical testing. The normal cone varied in reflectivity, while the dark cone remained poorly reflective on all imaging days (right). (B) An intermittently dark cone, from the retinal area in Figure 1, is shown during 4 imaging days (left). In this case, the dark cone was intermittently visible (second panel from left), but did not vary as much as the normally reflective cone (right). All images in this figure are on a log intensity scale, to facilitate identification of relatively dark cones (note: this makes cone profiles appear larger; compare Fig. 2). Reflectance measurements were not taken at equal time intervals.
Figure 4
Figure 4
Microstimulation increment thresholds show no difference in light sensitivity between dark and normally reflective cones. (A) Schematic of the approximate size of the microstimuli. Green contour contains 80% of the integrated light energy delivered on the retina for a single stimulus flash. (B) Example staircase threshold estimates and mean values from repeated experiments for the persistently dark/normal cone pair shown in (A) and Figure 3A. Mean thresholds from three measurements (±1 SD) are indicated. (C) Example staircases for the intermittently dark/normal cone pair of Figure 3B, with mean thresholds from five experiments. Estimates in (B) and (C) are given in arbitrary units (au), spanning the range of deliverable light intensity. The threshold estimates are computed from the trial history. (D) Population mean threshold difference measured between 10 pairs of dark and normally reflective cones (filled data points). To compare thresholds across sites, each single-cone threshold was normalized to the mean of the cone pair thresholds for each run. Open data points represent the mean normalized thresholds computed from individual experiments. Dark and normal cone thresholds across the population did not differ significantly (P = 0.49; error bars ±1 SD).
Figure 5
Figure 5
Comparison of single-cone reflectance and threshold. For both normal/normal (grayscale) and dark/normal (red scale) cone pairs, reflectance values for each cone were normalized to the mean reflectance of each pair during one experiment (indicated by connecting gray lines), expressed in SDs of the field gray level from the pairwise mean. Darker shading (toward the left) represents the less reflective cone in each pair. Cone thresholds were normalized to the mean of each cone pair, and plotted in arbitrary units from the pairwise mean. Linear regression reveals a 3.6% difference in mean threshold between normal cones with less versus more reflectivity (blue line, P = 0.0502, 284 paired threshold measurements). This trend was matched by dark/normal cone pairs, but also did not reach significance (red line, P = 0.49, 41 paired threshold measurements).

References

    1. Carroll J,, Kay DB,, Scoles D,, Dubra A,, Lombardo M. Adaptive optics retinal imaging--clinical opportunities and challenges. Curr Eye Res. 2013; 38: 709–721. - PMC - PubMed
    1. Williams DR. Imaging single cells in the living retina. Vision Res. 2011; 51: 1379–1396. - PMC - PubMed
    1. Lombardo M,, Parravano M,, Lombardo G,, et al. Adaptive optics imaging of parafoveal cones in type 1 diabetes. Retina. 2014; 34: 546–557. - PubMed
    1. Choi SS,, Zawadzki RJ,, Lim MC,, et al. Evidence of outer retinal changes in glaucoma patients as revealed by ultrahigh-resolution in vivo retinal imaging. Br J Ophthalmol. 2011; 95: 131–141. - PMC - PubMed
    1. Chen Y,, Ratnam K,, Sundquist SM,, et al. Cone photoreceptor abnormalities correlate with vision loss in patients with Stargardt disease. Invest Ophthalmol Vis Sci. 2011; 52: 3281–3292. - PMC - PubMed

Publication types