

Olfactory deposition of inhaled nanoparticles in humans
- PMID: 26194036
- PMCID: PMC4745908
- DOI: 10.3109/08958378.2015.1066904
Olfactory deposition of inhaled nanoparticles in humans
Abstract
Context: Inhaled nanoparticles can migrate to the brain via the olfactory bulb, as demonstrated in experiments in several animal species. This route of exposure may be the mechanism behind the correlation between air pollution and human neurodegenerative diseases, including Alzheimer's disease and Parkinson's disease.
Objectives: This article aims to (i) estimate the dose of inhaled nanoparticles that deposit in the human olfactory epithelium during nasal breathing at rest and (ii) compare the olfactory dose in humans with our earlier dose estimates for rats.
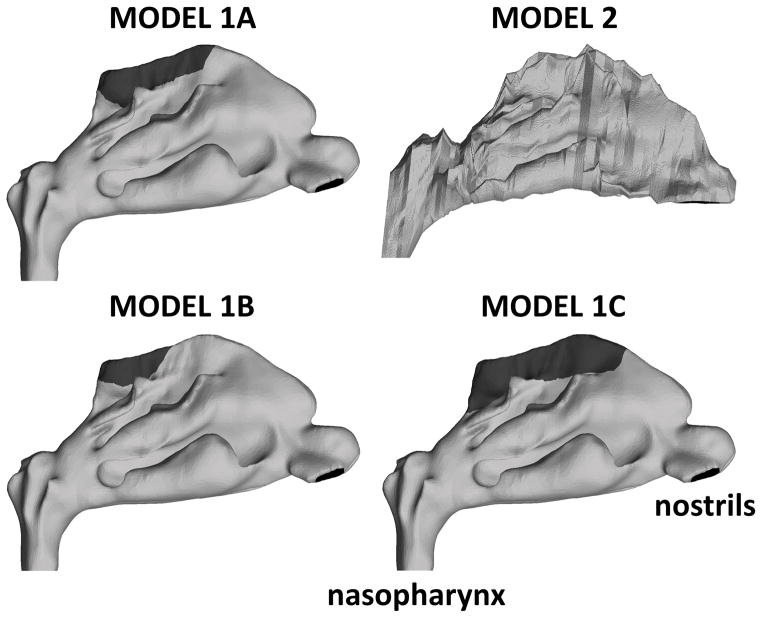
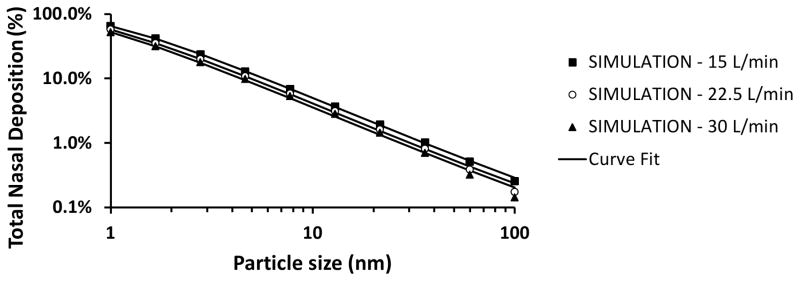
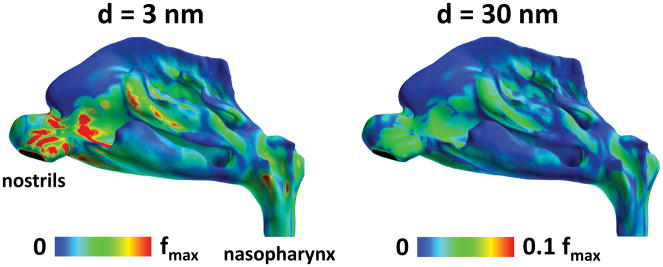
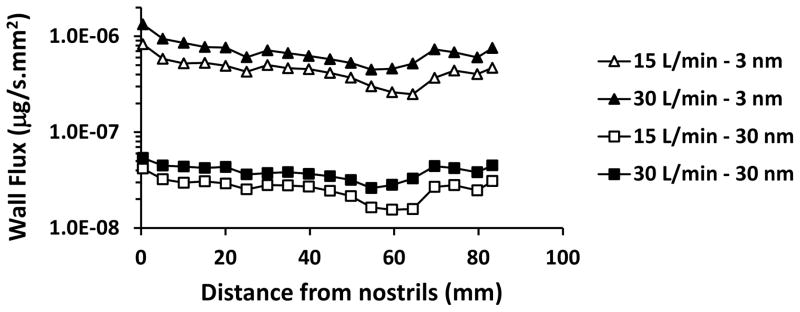
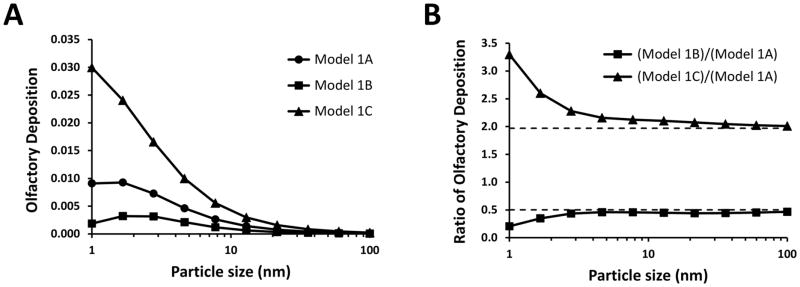
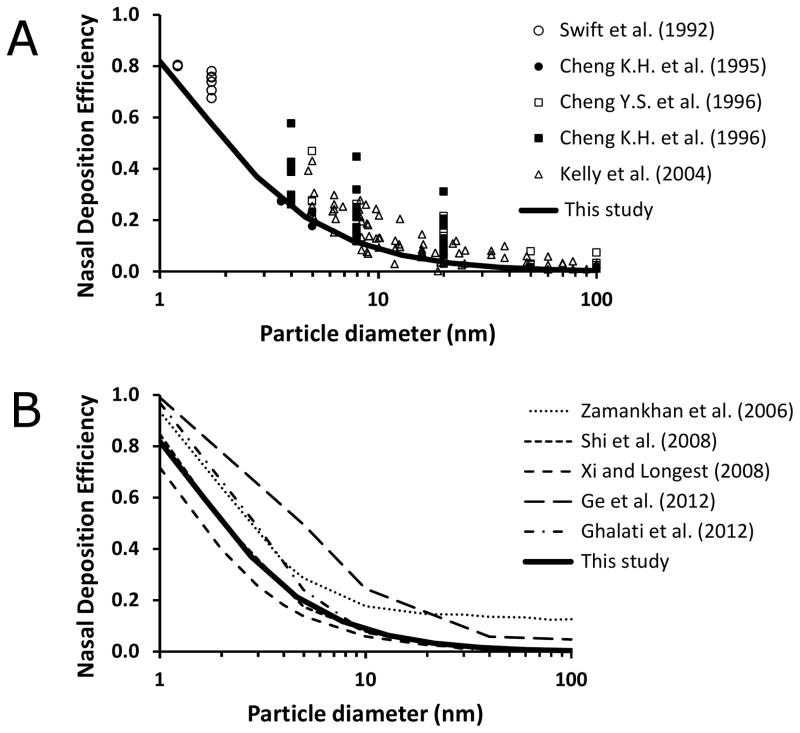
Materials and methods: An anatomically-accurate model of the human nasal cavity was developed based on computed tomography scans. The deposition of 1-100 nm particles in the whole nasal cavity and its olfactory region were estimated via computational fluid dynamics (CFD) simulations. Our CFD methods were validated by comparing our numerical predictions for whole-nose deposition with experimental data and previous CFD studies in the literature.
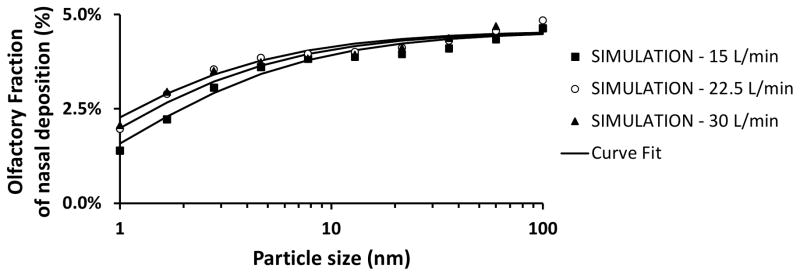
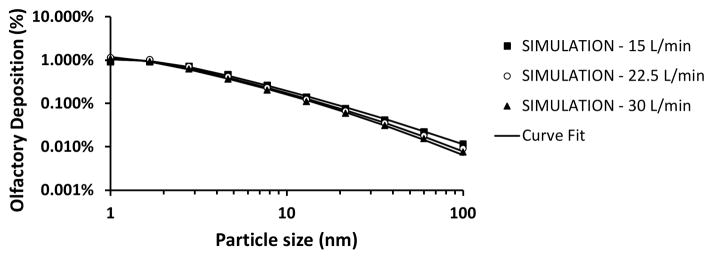
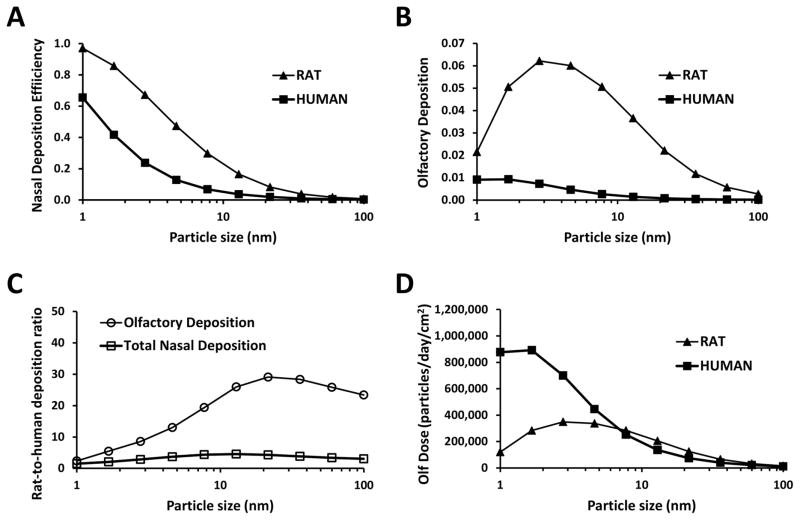
Results: In humans, olfactory dose of inhaled nanoparticles is highest for 1-2 nm particles with ∼1% of inhaled particles depositing in the olfactory region. As particle size grows to 100 nm, olfactory deposition decreases to 0.01% of inhaled particles.
Discussion and conclusion: Our results suggest that the percentage of inhaled particles that deposit in the olfactory region is lower in humans than in rats. However, olfactory dose per unit surface area is estimated to be higher in humans in the 1--7 nm size range due to the larger inhalation rate in humans. These dose estimates are important for risk assessment and dose-response studies investigating the neurotoxicity of inhaled nanoparticles.
Keywords: Computational fluid dynamics simulations; nanoparticle toxicology; nasal filtration; neurotoxicity; olfactory epithelium; particle deposition; risk assessment; ultrafine aerosols.
Conflict of interest statement
Financial support provided by the National Institute for Occupational Safety and Health (NIOSH) via purchase order #211-2008-M-27275. This publication was supported in part by the National Center for Research Resources, the National Center for Advancing Translational Sciences, and the Office of the Director, National Institutes of Health, through Grant Number 8KL2TR000056. Its contents are solely the responsibility of the authors and do not necessarily represent the official views of the NIH.
Figures
References
-
- Antonini JM, Santamaria AB, Jenkins NT, Albini E, Lucchini R. Fate of manganese associated with the inhalation of welding fumes: potential neurological effects. Neurotoxicology. 2006;27:304–310. - PubMed
-
- Balasubramanian SK, Poh KW, Ong CN, Kreyling WG, Ong WY, Yu LE. The effect of primary particle size on biodistribution of inhaled gold nano-agglomerates. Biomaterials. 2013;34:5439–5452. - PubMed
-
- Calderon-Garciduenas L, Azzarelli B, Acuna H, Garcia R, Gambling TM, Osnaya N, Monroy S, DELT MR, Carson JL, Villarreal-Calderon A, Rewcastle B. Air pollution and brain damage. Toxicologic pathology. 2002;30:373–389. - PubMed
-
- Calderon-Garciduenas L, Maronpot RR, Torres-Jardon R, Henriquez-Roldan C, Schoonhoven R, Acuna-Ayala H, Villarreal-Calderon A, Nakamura J, Fernando R, Reed W, Azzarelli B, Swenberg JA. DNA damage in nasal and brain tissues of canines exposed to air pollutants is associated with evidence of chronic brain inflammation and neurodegeneration. Toxicologic pathology. 2003;31:524–538. - PubMed
Publication types
MeSH terms
Grants and funding
LinkOut - more resources
Full Text Sources
Other Literature Sources
Research Materials
Miscellaneous