Review
. 2015 Jul;11(7):757-71.
doi: 10.1016/j.jalz.2015.05.001.

The Alzheimer's Disease Neuroimaging Initiative 2 PET Core: 2015

Affiliations
Review

The Alzheimer's Disease Neuroimaging Initiative 2 PET Core: 2015

William J Jagust et al. Alzheimers Dement. 2015 Jul.

Abstract

Introduction: This article reviews the work done in the Alzheimer's Disease Neuroimaging Initiative positron emission tomography (ADNI PET) core over the past 5 years, largely concerning techniques, methods, and results related to amyloid imaging in ADNI.

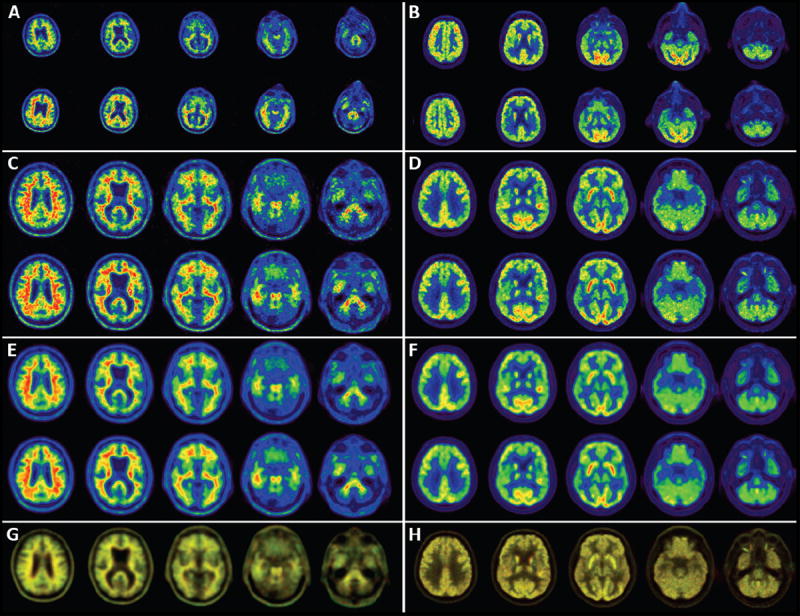
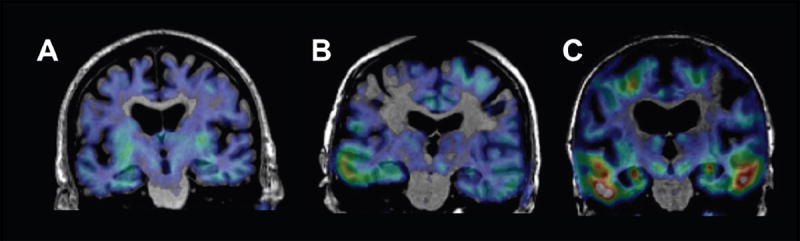
Methods: The PET Core has used [(18)F]florbetapir routinely on ADNI participants, with over 1600 scans available for download. Four different laboratories are involved in data analysis, and have examined factors such as longitudinal florbetapir analysis, use of [(18)F]fluorodeoxyglucose (FDG)-PET in clinical trials, and relationships between different biomarkers and cognition.

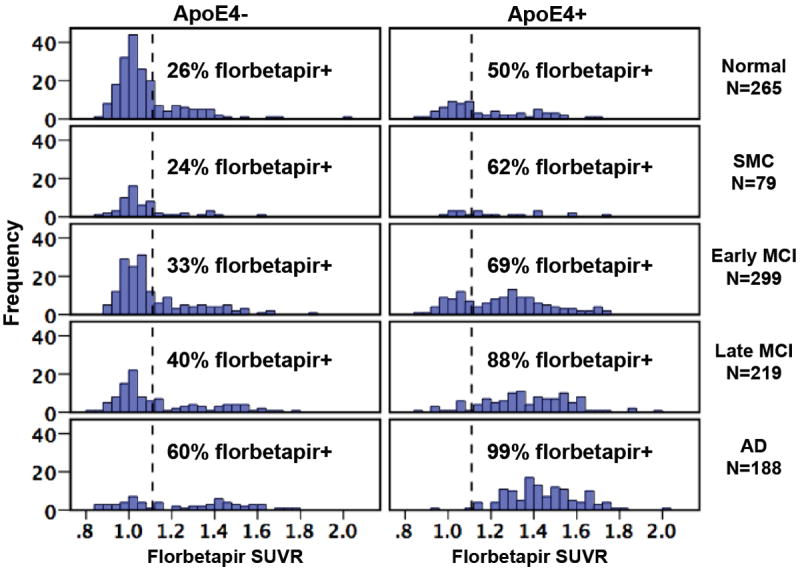
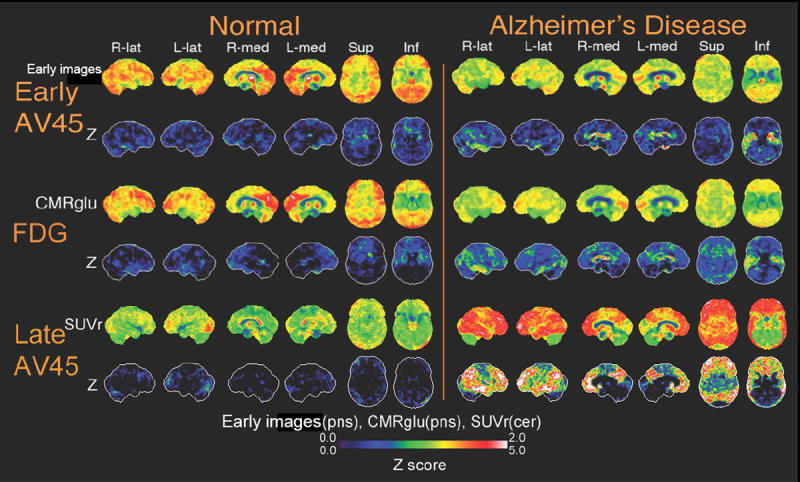
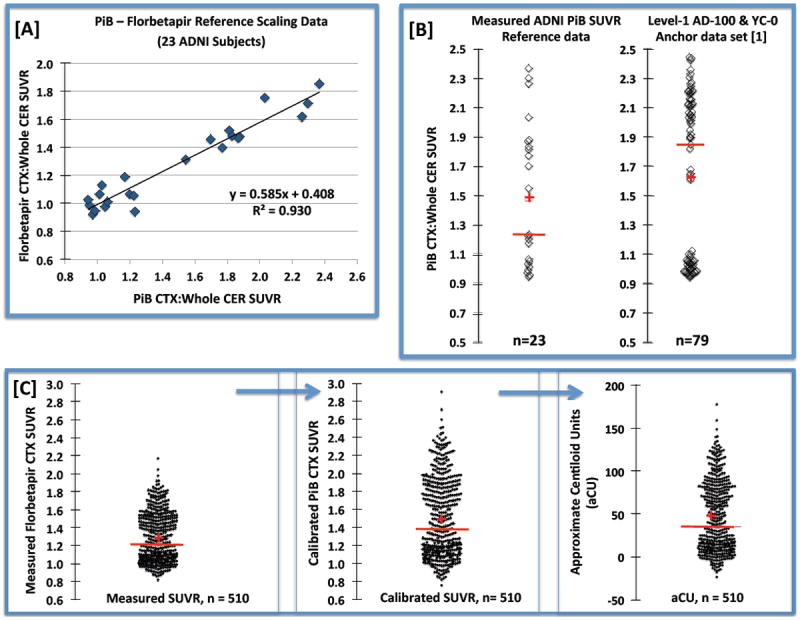
Results: Converging evidence from the PET Core has indicated that cross-sectional and longitudinal florbetapir analyses require different reference regions. Studies have also examined the relationship between florbetapir data obtained immediately after injection, which reflects perfusion, and FDG-PET results. Finally, standardization has included the translation of florbetapir PET data to a centiloid scale.

Conclusion: The PET Core has demonstrated a variety of methods for the standardization of biomarkers such as florbetapir PET in a multicenter setting.

Keywords: Alzheimer's disease; Amyloid; Fluorodeoxyglucose; Mild cognitive impairment; PET imaging.


Figures

Figure 1
Figure 1
All panels on the left side of the figure are from one LMCI subject scanned with florbetapir on a PET-only Siemens ECAT-Exact HR+. Shown on the right are FDG images from a different LMCI subject scanned on a GE Discovery-STE PET/CT. Panels A-F show slices from two scans; baseline (top) and 2-year follow-up (bottom). Panels A and B show slices from pre-processed image set 2. These are “native-space” as seen by different head orientations for the baseline and 2-year scans. Different in-plane voxel-sizes for the HR+ (2.57 mm; A) and STE (2.0 mm; B) are apparent. The image intensities appear different, as the 2-year florbetapir scan had higher counts than at baseline, while the baseline FDG had slightly higher counts than the 2-year follow-up. Panels C and D show pre-processed image set 3, following co-registration to the standard orientation and intensity normalization (derived from A and B, respectively). Panels E and F show the pre-processed image set 4, following smoothing to 8 mm (derived from C and D, respectively). Panel G shows an overlay of the baseline image (in red) and the follow up image (in green) for the smoothed images from E, while panel H shows the overlay of the unsmoothed images from D. See text for full explanation of this overlay.
Figure 2
Figure 2
Frequency histograms for a total of 1050 ADNI subjects show the distribution of florbetapir cortical SUVRs by clinical diagnosis and stratified by APOE4 status. SUVRs were calculated using a whole cerebellum reference region, and the dotted vertical line shows the positivity threshold of 1.11 that has been previously validated [5].
Figure 3
Figure 3
Neurostat SSP surface maps of uptake and Z scores for early phase florbetapir (0-20 min post-injection), FDG, and late phase florbetapir images (50-70 min post-injection) are shown comparing one normal subject and one AD subject. Early florbetapir cerebral blood flow rate is normalized to the pons value. FDG glucose metabolic rate is normalized to pons. Late florbetapir uptake value is normalized to the cerebellum. The normal subject shows few deficits in cerebral blood flow, metabolism and amyloid binding. The AD subject shows similar regions for deficits in cerebral blood flow and metabolism. The AD subject also shows significant accumulation of amyloid.
Figure 4
Figure 4
Example data for the approximate Centiloid scaling process. [A] Strong linearity was observed between the ADNI reference data acquired for 23 subjects who underwent PiB and florbetapir PET imaging within a 24-month interval. [B] Comparison of the distribution of PiB SUVR values observed for the ADNI reference data (left) and the Level-1 anchor data reported in [12] (right). [C] Distributions of the 510 measured ADNI florbetapir SUVR values (left), calculated “PiB-calibrated” florbetapir SUVR values (middle) and the converted approximate Centiloid units, or aCU (right). The median and mean are depicted, respectively, by the red bar and cross.
Figure 5
Figure 5
PET images of tau accumulation superimposed on subjects’ MRI scans. Tau imaging utilized the tracer [18F]AV-1451. Subject A is a normal older control, with a pattern of tracer retention suggesting minimal tau accumulation in the medial temporal lobes. Subject B, also a normal control, shows tracer retention into the temporal neocortex; this individual also shows evidence of widespread β-amyloid accumulation with [11C]PIB imaging (not shown). Subject C is a patient with AD who shows extensive tracer retention in temporal lobes and parietal lobes.

Similar articles

Cited by

References

    1. Jagust WJ, Bandy D, Chen K, Foster NL, Landau SM, Mathis CA, et al. The Alzheimer’s Disease Neuroimaging Initiative positron emission tomography core. Alzheimers Dement. 2010;6:221–9. - PMC - PubMed
    1. Salloway S, Sperling R, Fox NC, Blennow K, Klunk W, Raskind M, et al. Two phase 3 trials of bapineuzumab in mild-to-moderate Alzheimer’s disease. N Engl J Med. 2014;370:322–33. - PMC - PubMed
    1. Sperling RA, Rentz DM, Johnson KA, Karlawish J, Donohue M, Salmon DP, et al. The A4 study: stopping AD before symptoms begin? Sci Transl Med. 2014;6:228fs13. - PMC - PubMed
    1. Talairach J, Tournoux P. Co-planar Stereotaxic Atlas of the Human Brain. New York: Thieme; 1988.
    1. Landau SM, Mintun MA, Joshi AD, Koeppe RA, Petersen RC, Aisen PS, et al. Amyloid deposition, hypometabolism, and longitudinal cognitive decline. Ann Neurol. 2012;72:578–86. - PMC - PubMed

MeSH terms