Review
. 2015 Jul;11(7):772-91.
doi: 10.1016/j.jalz.2015.05.003.

The Alzheimer's Disease Neuroimaging Initiative 2 Biomarker Core: A review of progress and plans

Affiliations
Review

The Alzheimer's Disease Neuroimaging Initiative 2 Biomarker Core: A review of progress and plans

Ju-Hee Kang et al. Alzheimers Dement. 2015 Jul.

Abstract

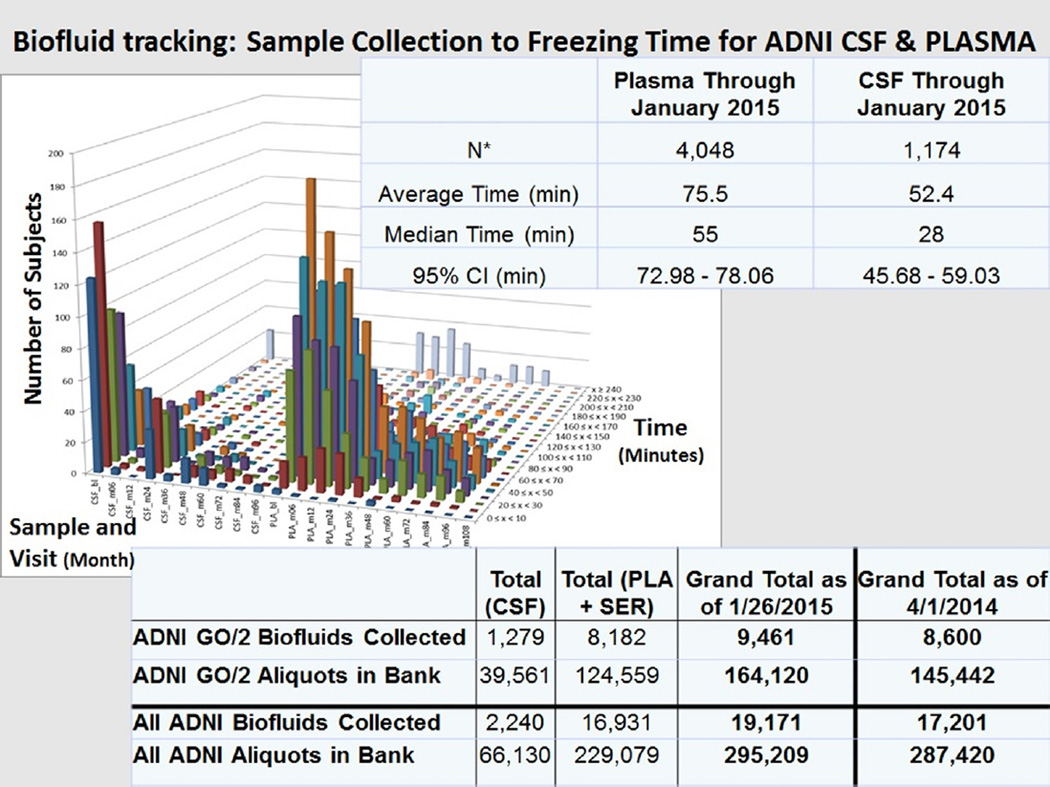
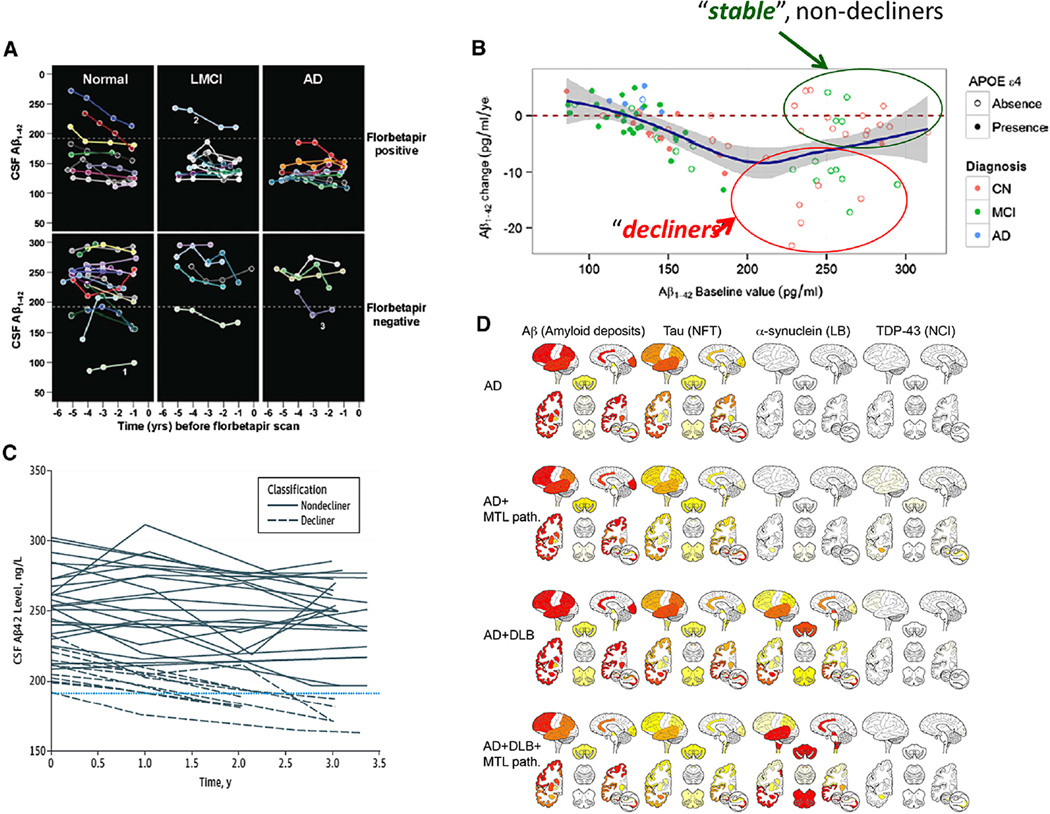
Introduction: We describe Alzheimer's Disease Neuroimaging Initiative (ADNI) Biomarker Core progress including: the Biobank; cerebrospinal fluid (CSF) amyloid beta (Aβ1-42), t-tau, and p-tau181 analytical performance, definition of Alzheimer's disease (AD) profile for plaque, and tangle burden detection and increased risk for progression to AD; AD disease heterogeneity; progress in standardization; and new studies using ADNI biofluids.

Methods: Review publications authored or coauthored by ADNI Biomarker core faculty and selected non-ADNI studies to deepen the understanding and interpretation of CSF Aβ1-42, t-tau, and p-tau181 data.

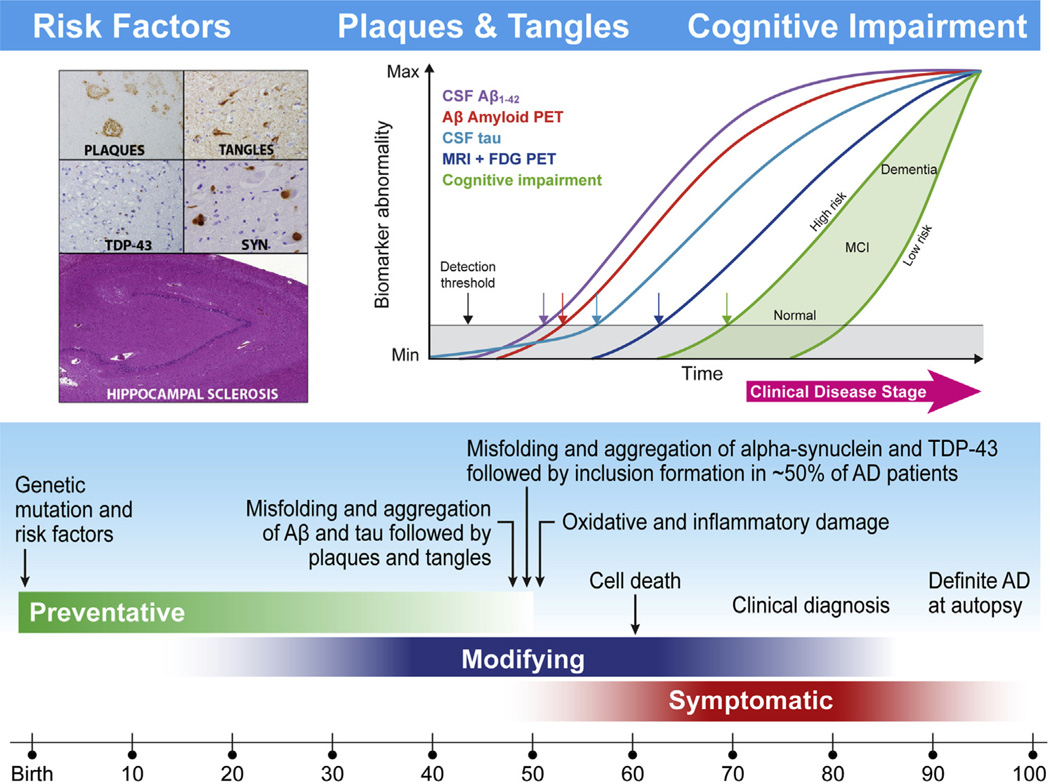
Results: CSF AD biomarker measurements with the qualified AlzBio3 immunoassay detects neuropathologic AD hallmarks in preclinical and prodromal disease stages, based on CSF studies in non-ADNI living subjects followed by the autopsy confirmation of AD. Collaboration across ADNI cores generated the temporal ordering model of AD biomarkers varying across individuals because of genetic/environmental factors that increase/decrease resilience to AD pathologies.

Discussion: Further studies will refine this model and enable the use of biomarkers studied in ADNI clinically and in disease-modifying therapeutic trials.

Keywords: ADNI; Alzheimer's disease; Aβ(1–42); Biomarkers; Cerebrospinal fluid; Disease-modifying therapy; Immunoassay; Mild cognitive impairment; Plasma; Tau.


Figures

Fig. 1
Fig. 1
This figure is a newly adapted schematic depicted in two previous Alzheimer’s Disease Neuroimaging Initiative (ADNI) reviews [47,124] that updates the current understanding of the hypothetical time line for the onset and progression of Alzheimer’s disease (AD) neurodegeneration and cognitive impairments progressing from normal controls (NC) to mild cognitive impairment (MCI) and then to AD. Age is indicated at the bottom, whereas the green, blue, and red bars indicate the time at which preventive, disease-modifying, and symptomatic interventions, respectively, are likely to be most effective. Within the aqua bar are shown milestones in the pathobiology of AD that culminate in death and autopsy confirmation of AD. The proposed ADNI model of the temporal ordering of biomarkers of AD pathology relative to stages in the clinical onset and progression of AD is shown in the insert at the upper right based on Jack et al. [58], whereas the insert at the left illustrates the defining plaque and tangle pathologies of AD and common comorbid pathologies including Lewy body pathology (LBP), transactive response DNA binding protein 43 kDa (TDP-43), and hippocampal sclerosis. In the insert on the right, clinical disease is on the horizontal axis and it is divided into three stages; cognitively normal, MCI, and dementia. The vertical axis indicates the range from normal to abnormal for each of the biomarkers and for measures of memory and functional impairments. The plot in the upper right of this figure is taken from reference # with permission.
Fig. 2
Fig. 2
Summary of (1) biofluid tracking: time from sample collection to freezing for Alzheimer’s Disease Neuroimaging Initiative (ADNI) cerebrospinal fluid (CSF) and plasma samples and (2) ADNI GO/2 number of biofluids collected and number of aliquots in the Penn ADNI Biobank and the total of ADNI 1/2/GO biofluids collected and banked as of January 26, 2015. This collection time data for each ADNI biofluid sample is tracked in the Penn ADNI Biofluid Biobank database.
Fig. 3
Fig. 3
(A) Plot of cerebrospinal fluid (CSF) amyloid beta (Aβ1–42) concentration (pg/mL) versus time (years) before florbetapir scan in the 27 normal, 17 mild cognitively impairment (MCI), and 16 Alzheimer’s disease (AD) subjects in the Alzheimer’s Disease Neuroimaging Initiative (ADNI) study. These are the subjects who participated in the ADNI longitudinal CSF biomarker study and who also had a florbetapir scan. Each colored line corresponds to an individual subject and each point on a line corresponds to a CSFAβ1–42 value from a single lumbar puncture (with permission from reference #43). The horizontal dotted line in each panel represents the CSFAβ1–42 cutoff value of 192 pg/mL. (B) Plot of the change (pg/mL/year) in CSFAβ1–42 concentration during 3–4 years follow-up time (Y axis) versus CSFAβ1–42 concentration at baseline in the 141 ADNI subjects who participated in the longitudinal CSF biomarker study (with permission from reference #53). The green circle includes the 20 study participants whose baseline Aβ1–42 value was normal (above 192 pg/mL) and whose Aβ1–42 value remained stable at an average yearly rate of −0.5 pg/mL/year for 3–4 years; the red circle includes the 15 participants whose baseline Aβ1–42 value was normal and whose Aβ1–42 value declined at an average yearly rate of −9.2 pg/mL/year over 3–4 years. (C) Plot of CSFAβ1–42 concentration (pg/mL) versus time for the 35 participants whose Aβ1–42 values were normal (above the 192 pg/mL cutoff) in the ADNI longitudinal study. The horizontal dashed line corresponds to the Aβ1–42 cutoff value (with permission from reference #45). (D) Heatmaps summarizing the semiquantitative neuropathological grading (from left to right: amyloid deposits, neurofibrillary tangles (NFT), Lewy bodies (LBs), and neuronal cytoplasmatic TDP-immunoreactive inclusions (NCI) for the different neuropathologic diagnostic groups (from top to bottom: AD, AD + medial temporal lobe (MTL) pathology, AD + dementia with Lewy bodies (DLB), AD + DLB + MTL pathology, and DLB + MTL pathology) (with permission from reference #46).

References

    1. Schneider JA, Arvanitakis Z, Bang W, Bennett DA. Mixed brain pathologies account for most dementia cases in community-dwelling older persons. Neurology. 2007;69:2197–2204. - PubMed
    1. White L, Small BJ, Petrovitch H, Ross GW, Masaki K, Abbott RD, et al. Recent clinical-pathologic research on the causes of dementia in late life: update from the Honolulu-Asia Aging Study. J Geriatr Psychiatry Neurol. 2005;18:224–227. - PubMed
    1. Gomez-Isla T, Hollister R, West H, Mui S, Growdon JH, Petersen RC, et al. Neuronal loss correlates with but exceeds neurofibrillary tangles in Alzheimer’s disease. Ann Neurol. 1997;41:17–24. - PubMed
    1. Savva GM, Wharton SB, Ince PG, Forster G, Matthews FE, Brayne C, et al. Age, neuropathology, and dementia. N Engl J Med. 2009;360:2302–2309. - PubMed
    1. Terry RD, Masliah E, Salmon DP, Butters N, DeTeresa R, Hill R, et al. Physical basis of cognitive alterations in Alzheimer’s disease: synapse loss is the major correlate of cognitive impairment. Ann Neurol. 1991;30:572–580. - PubMed

Publication types

MeSH terms