. 2015 Sep 5;370(1676):20140243.
doi: 10.1098/rstb.2014.0243.

Inferring processes underlying B-cell repertoire diversity

Affiliations

Inferring processes underlying B-cell repertoire diversity

Yuval Elhanati et al. Philos Trans R Soc Lond B Biol Sci. .

Abstract

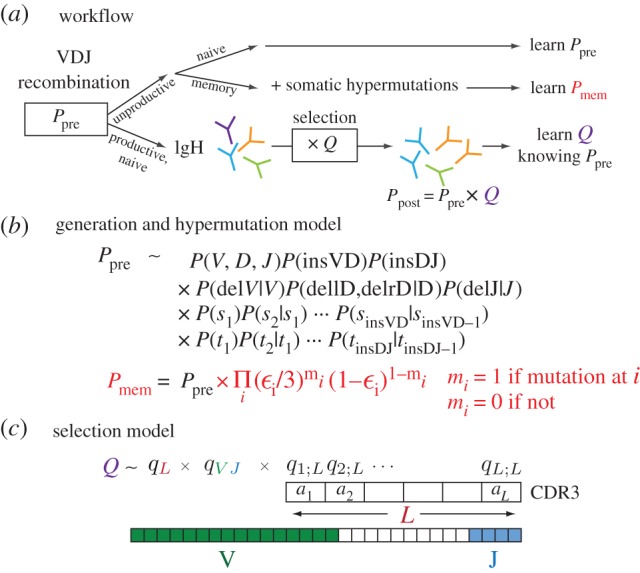
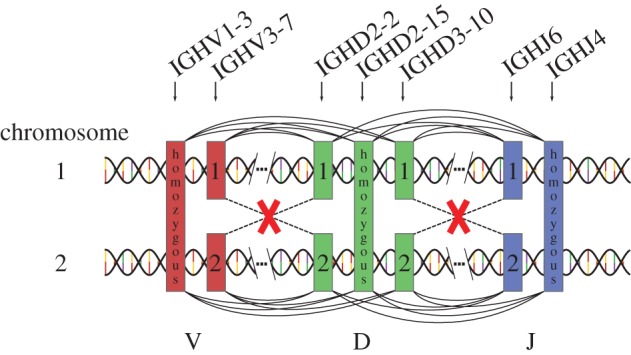
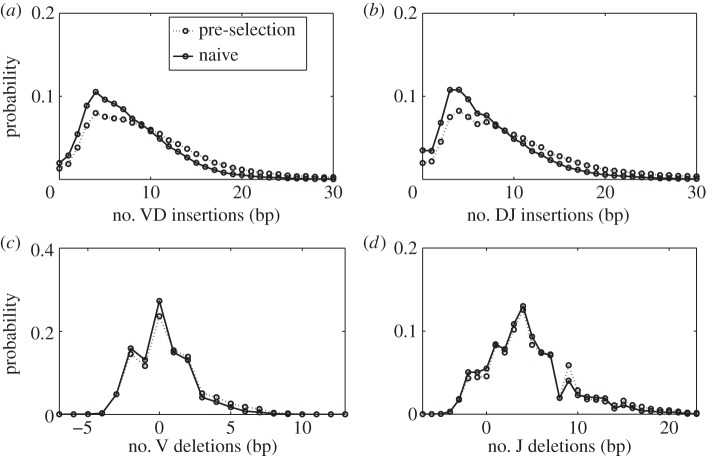
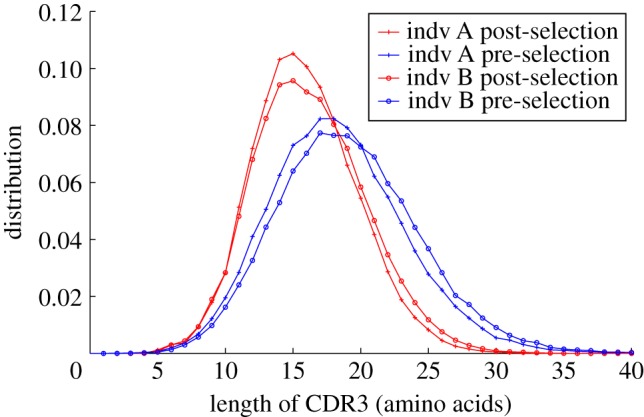
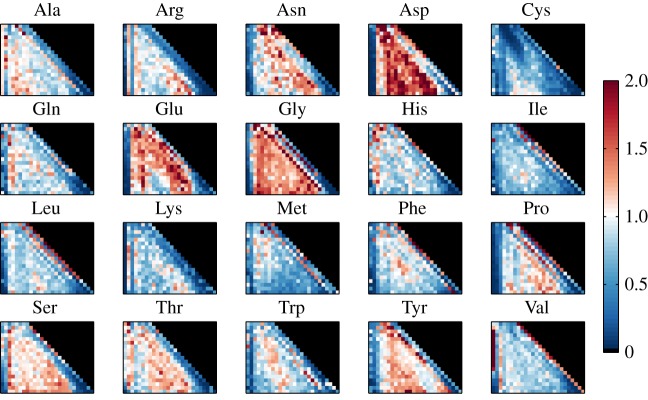
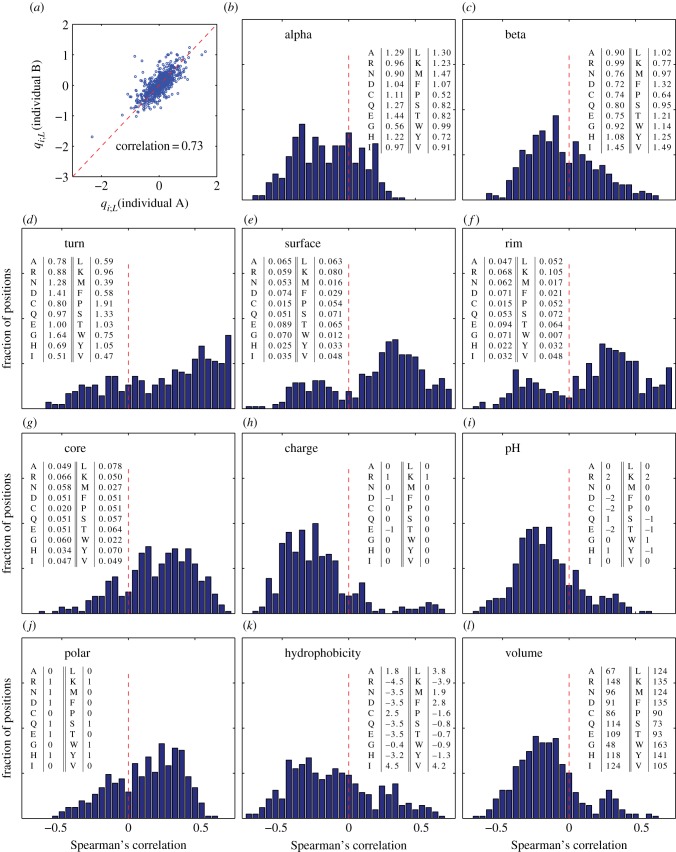
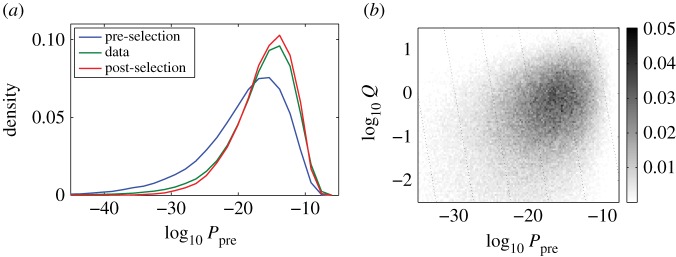
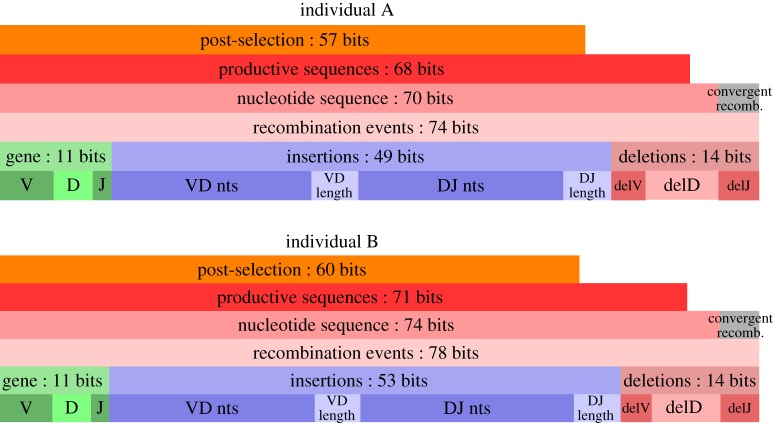
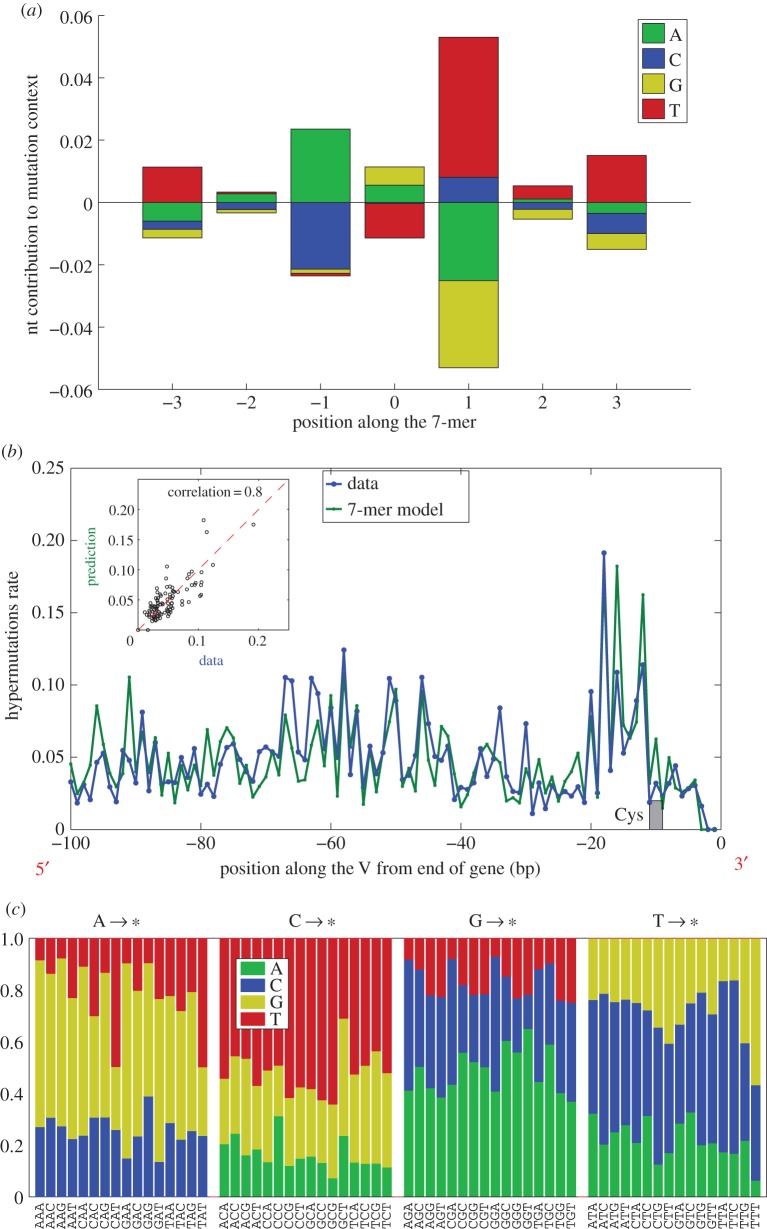
We quantify the VDJ recombination and somatic hypermutation processes in human B cells using probabilistic inference methods on high-throughput DNA sequence repertoires of human B-cell receptor heavy chains. Our analysis captures the statistical properties of the naive repertoire, first after its initial generation via VDJ recombination and then after selection for functionality. We also infer statistical properties of the somatic hypermutation machinery (exclusive of subsequent effects of selection). Our main results are the following: the B-cell repertoire is substantially more diverse than T-cell repertoires, owing to longer junctional insertions; sequences that pass initial selection are distinguished by having a higher probability of being generated in a VDJ recombination event; somatic hypermutations have a non-uniform distribution along the V gene that is well explained by an independent site model for the sequence context around the hypermutation site.

Keywords: B cell; IgH; VDJ recombination; immune repertoire; somatic hypermutations; statistical inference.


Figures

Figure 1.
Figure 1.
(a) BCR heavy chain sequences are formed during VDJ recombination according to a probability distribution Ppre that we infer from the unproductive naive sequence repertoire. The unproductive memory repertoire is used to infer the rate and sequence dependence of somatic hypermutation. Productive sequences are selected for entry into the naive peripheral repertoire with a sequence-dependent factor Q, resulting in the observed distribution of receptor sequences Ppost. (b) Recombined sequences arise via a scenario involving independent choices of which gene segments to recombine as well as of numbers of deletions and insertions. The probability distribution of these choices is not known unambiguously from the observed sequences and is estimated probabilistically in an iterative procedure. (c) The selection factor Q is assumed to be a product of factors for V and J gene choice together with factors qi;L(a) for the choice of the specific amino acid a at each position i in a CDR3 of length L. These factors are determined from the naive productive sequence repertoire by an iterative procedure.
Figure 2.
Figure 2.
The organization of heterozygous genes into chromosomes can be probabilistically determined. Every recombination event ties together a V, a D, and a J gene, as indicated by the arcs drawn above and below the two chromosomes. Links that recombine alleles on different chromosomes are forbidden (red crosses). Our method gives the probability P(V, D, J) of all possible linkages between three genes (distinguishing between alleles of the same gene), but does not address how the various alleles are grouped on chromosomes. We find the best chromosomal segregation by minimizing the sum of all terms in P(V, D, J) that contain forbidden links (red crosses).
Figure 3.
Figure 3.
Distributions of insertions and deletions for the pre- and post-selection repertoires. (a,b) The distribution of numbers of nucleotide insertions in the DJ and VD joints. These distributions are independent of the identities of the genes on either side of the junction, and the VD and DJ insertions are very similar. The selection process that acts on going from the primitively generated to the naive repertoire causes the mean number of insertions to decrease significantly. (c,d) The distribution of deletions from the V and J genes (negative deletions account for palindromic insertions). Deletions are gene-dependent and the plots show the deletion profile averaged over all genes (gene-dependent profiles are shown in electronic supplementary material, figure S8). Selection has little effect on deletion profiles.
Figure 4.
Figure 4.
Length distributions (in amino acids) of the CDR3 for different repertoires. The post-selection distributions are derived from the productive sequences in the naive repertoires. The pre-selection distribution is derived from a synthetic repertoire of productive sequences drawn from the generative model Ppre that has been inferred from naive unproductive data sequences. Notable features include the progressive shortening and narrowing of the distribution as selective pressure is applied, and the close similarity, but not identity, between the two individuals.
Figure 5.
Figure 5.
Heat plot of the inferred amino acid selection factors qi;L for each amino acid, ordered by length L of the CDR3 region (ordinate) and position i within that region (abscissa). The CDR3 region is bounded on the left by a Cys residue and by a Trp residue on the right. There is a clear pattern of amino acid preference (or anti-preference) within a few positions of these boundaries, independent of overall CDR3 length L.
Figure 6.
Figure 6.
(a) Scatter plot of the logarithms of the amino acid selection factors qi;L(a) between individuals A and B. The selection factors for the two individuals are strongly, if not perfectly, correlated. This justifies a joint analysis of the properties of those factors, as done in the following panels (b–l), showing correlation of the selection factors with several biochemical properties. Each panel shows the histogram, over all positions and lengths of both individuals, of Spearman's correlation coefficient between the selection factors for a given amino acid and the biochemical properties of that amino acid. The following biochemical properties are considered (from left to right, top to bottom): preference to appear in α-helices (b), β-sheets (c), turns (d) (source for (bd): electronic supplementary material, table 3.3 [29]). Residues that are exposed to solvent in protein–protein complexes (following definitions and data from [30]) are divided into three groups: surface (interface) residues that have unchanged accessibility area when the interaction partner is present (e), rim (interface) residues that have changed accessibility area, but no atoms with zero accessibility in the complex (f) and core (interface) residues that have changed accessibility area and at least one atom with zero accessibility in the complex (g). Finally, we plot the basic biochemical amino acid properties (http://en.wikipedia.org/wiki/Amino_acid; http://en.wikipedia.org/wiki/Proteinogenic_amino_acid): charge (h), pH (i), polarity (j), hydrophobicity (k) and volume (l). For all properties, the actual numerical values used to calculate the correlations are listed in the inset tables.
Figure 7.
Figure 7.
(a) The distribution of generation probabilities (as inferred from the pre-selection model Ppre) for the pre-selection model itself (blue), the post-selection model Ppost (red) and the naive functional sequence repertoire itself (green). The key feature is that sequences in the selected repertoire have systematically higher generation probability. Panel (b) makes the same point via a scatter plot of the primitive generation probability versus the selection factor Q for a synthetic repertoire of sequences generated according to Ppre.
Figure 8.
Figure 8.
Total sequence entropy partitioned into its various elementary contributions for the two individuals. The bottom three horizontal bars in each stack display the partitioning of the entropy of the probability distribution of recombination scenarios. Because multiple scenarios can generate the same sequence, the nucleotide sequence entropy of the sequences directly produced by recombination is smaller than the recombination scenario entropy. Out of those, productivity of the sequence further restricts the diversity by constraining frame and forbidding stop codons appearing, as depicted in the smaller bar above. Finally, as seen in the topmost bar, the initial selection process itself significantly reduces the diversity of those productive sequences. It is worth noticing that while the initial diversity of both individuals is different, consistent with their different CDR3 length distributions, the reduction effect of the selection is quite similar, keeping the same difference in entropy.
Figure 9.
Figure 9.
Sequence dependence of somatic hypermutations. (a) The model mutation probability depends on the central base (position 0) and on the sequence context, three base pairs on each side. The log relative probability of a mutation is the sum of contributions (positive and negative) read off from the sequence motif according to the sequence at each of the seven positions. (b) Comparison of the predictions of this model with the observed hypermutation rate at different positions within the V gene. Mutation ‘hotspots’ are well predicted, and the scatter plot (inset) between data and prediction shows strong correlation. The location of the Cys anchor of the CDR3 is indicated, and we note that the hypermutation rate (in data and model) is low within this special codon. (c) Substitution probabilities to the different bases as stacked columns versus the local trimer context, grouped by the central base. Substitution is not uniform, depending primarily on the base being mutated, but varying with the context.

Similar articles

Cited by

References

    1. Teng G, Papavasiliou FN. 2007. Immunoglobulin somatic hypermutation. Annu. Rev. Genet. 41, 107–120. (10.1146/annurev.genet.41.110306.130340) - DOI - PubMed
    1. Janeway C, Murphy KP, Travers P, Walport M. 2008. Janeway‘s immunobiology. New York, NY: Garland Science.
    1. Six A, et al. 2013. The past, present and future of immune repertoire biology—the rise of next-generation repertoire analysis. Front. Immunol. 4, 413 (10.3389/fimmu.2013.00413) - DOI - PMC - PubMed
    1. Robins H. 2013. Immunosequencing: applications of immune repertoire deep sequencing. Curr. Opin. Immunol. 25, 646–652. (10.1016/j.coi.2013.09.017) - DOI - PubMed
    1. Murugan A, Mora T, Walczak AM, Callan CG. 2012. Statistical inference of the generation probability of T-cell receptors from sequence repertoires. Proc. Natl Acad. Sci. USA 109, 16 161–16 166. (10.1073/pnas.1212755109) - DOI - PMC - PubMed

Publication types

Substances

LinkOut - more resources