Review
. 2015;91(7):305-20.
doi: 10.2183/pjab.91.305.

Strength and precision of neurotransmission at mammalian presynaptic terminals

Affiliations
Review

Strength and precision of neurotransmission at mammalian presynaptic terminals

Tomoyuki Takahashi. Proc Jpn Acad Ser B Phys Biol Sci. 2015.

Abstract

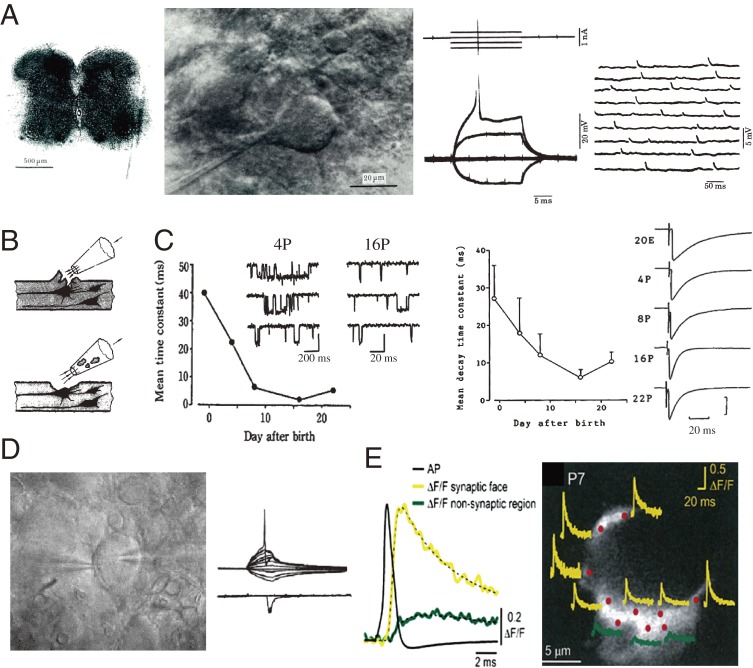
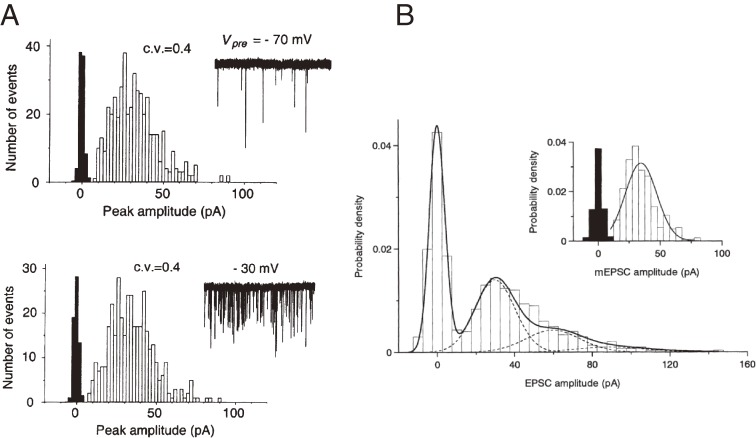
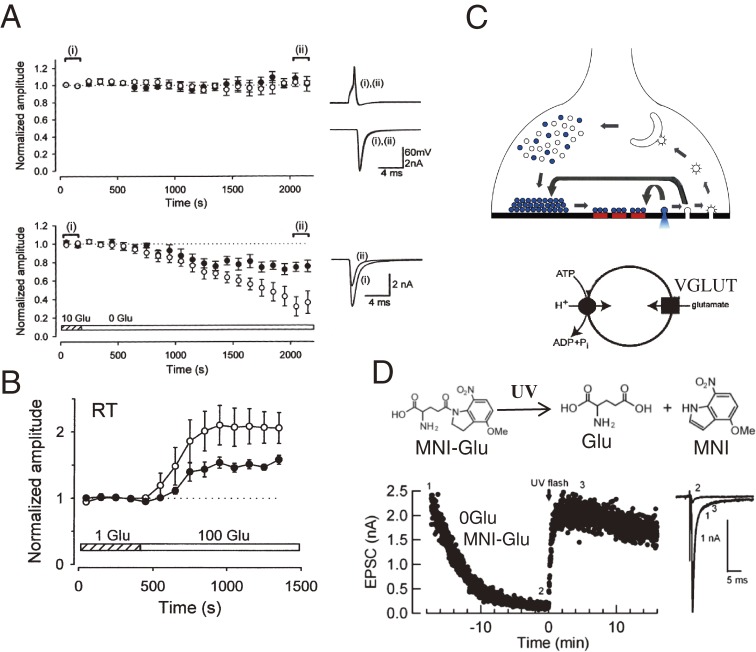
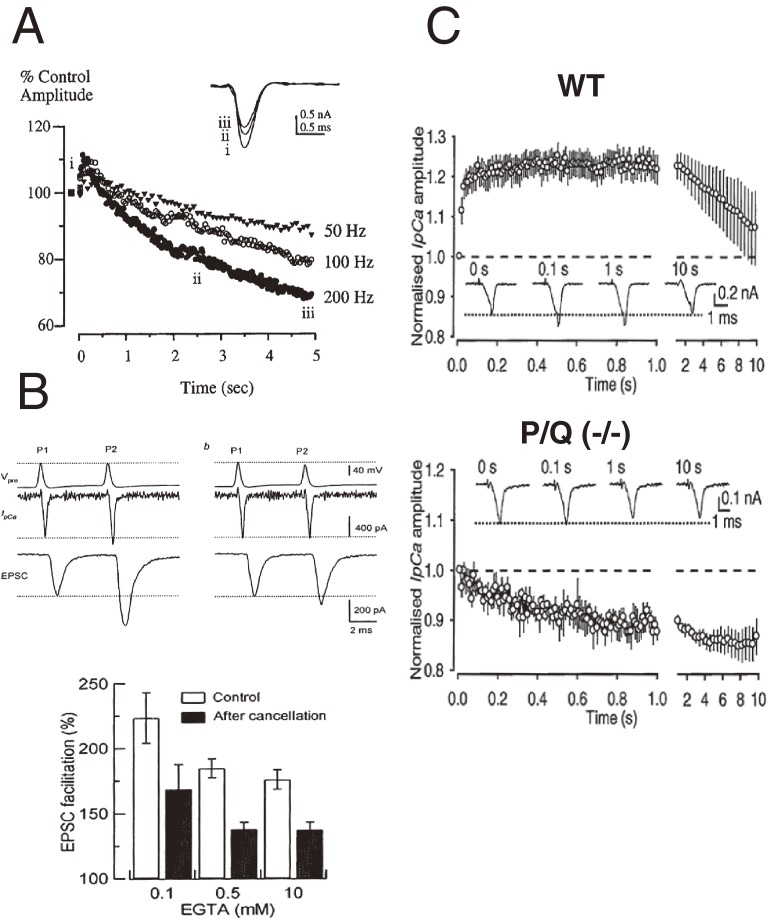
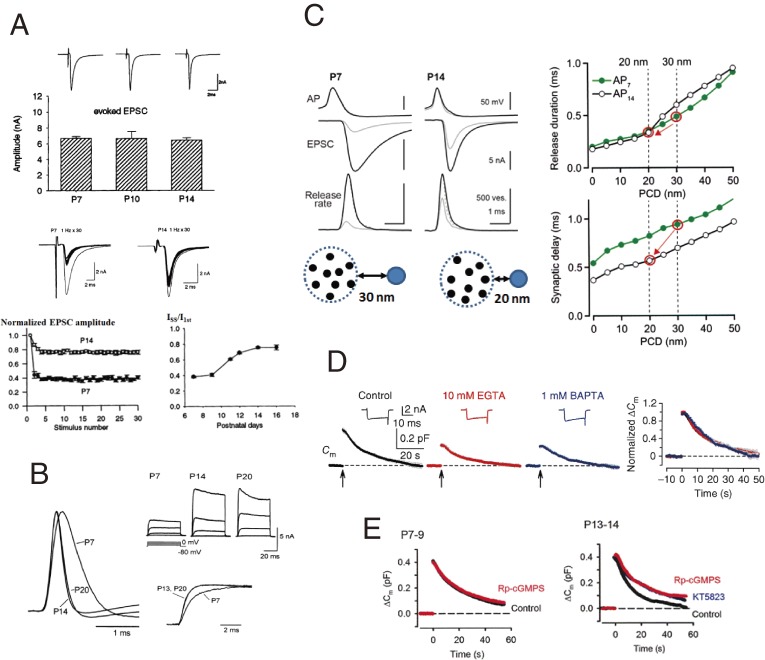
Classically, the basic concept of chemical synaptic transmission was established at the frog neuromuscular junction, and direct intracellular recordings from presynaptic terminals at the squid giant presynaptic terminal have further clarified principles of neurotransmitter release. More recently, whole-cell patch-camp recordings from the calyx of Held in rodent brainstem slices have extended the classical concept to mammalian synapses providing new insights into the mechanisms underlying strength and precision of neurotransmission and developmental changes therein. This review summarizes findings from our laboratory and others on these subjects, mainly at the calyx of Held, with a particular focus on precise, high-fidelity, fast neurotransmission. The mechanisms by which presynaptic terminals acquire strong, precise neurotransmission during postnatal development are also discussed.


Figures

Figure 1.
Figure 1.
Development of slice preparations and recording techniques. A, Left panel, a thin slice preparation of neonatal rat spinal cord immobilized on a cover glass with fibrin clots.12) Middle left, neurons in the ventral horn are visualized with a Nomarski differential interference condenser and a 40X water immersion objective. A glass microelectrode for intracellular recording is advanced from the left. Middle right, an action potential elicited by a supra-threshold depolarizing current pulse (upper traces) superimposed with subthreshold and hyperpolarizing potentials. Right, spontaneous synaptic potentials recorded from the neuron. B, Cleaning the neuronal surface to facilitate GΩ seal formation with patch-clamp pipettes.13) C, Postnatal developmental acceleration of glycine receptor channel current kinetics.14) Glycine-induced single channel currents in outside-out patches excised from a dorsal horn neuron in 4-day-old (4P; time scale, 200 ms) and 16P (right; time scale, 20 ms) rats. Graph indicates single channel mean open time (left panel) undergoing developmental shortening. Right panel, mean decay time constant of glycinergic inhibitory postsynaptic currents (sample records on the right), undergoing developmental acceleration of their decay times. D, Simultaneous pre- and postsynaptic whole-cell recording from the calyx of Held (left pipette) and a principal cell in the medial nucleus of the trapezoid body (MNTB, right pipette). A presynaptic action potential (AP, upper trace) elicits an EPSC (lower traces). E, AP-induced Ca2+ transients recorded from different confocal spots on the calyx of Held terminal loaded with the Ca2+ indicator Oregon green BAPTA-5N (100 µM).72) Left sample traces, a Ca2+ transient from a hot spot on the release face (yellow) and that from the non-release face (green) are superimposed with an AP. Right, a calyx terminal is visualized with Alexa 594 co-loaded with the Ca2+ indicator. Ca2+ transients from different spots (red) on the release face (yellow) and on the non-release face (green) on the calyx are shown.
Figure 2.
Figure 2.
Quantal nature of postsynaptic currents at the calyx of Held synapse.27) A, Amplitude histograms of mEPSCs at a presynaptic holding potential of −70 mV (upper panel) and −30 mV (lower panel). Sample records of mEPSCs are shown in insets. Upon presynaptic depolarization, mEPSC frequency increases from 8.5 Hz (at −70 mV) to 166 Hz (at −30 mV), but neither the mean amplitude nor the coefficient of variation (CV = standard deviation/mean) of mEPSCs changed. B, Quantal nature of evoked EPSCs. Upper right panel, amplitude histograms of mEPSCs and background noise (black). Lower left panel, amplitude histogram of evoked EPSCs, including failure events, in 0.65 mM [Ca2+]-4.5 mM [Mg2+] artificial cerebro-spinal fluid (aCSF), with multiple Gaussian curves (dashed lines) calculated from Poisson’s law.
Figure 3.
Figure 3.
Whole-cell manipulation of vesicular glutamate content.37,42) A, Mean amplitudes of evoked EPSCs (open circles) and mEPSCs (filled circles) in the presence (upper panel) or absence (lower panel) of l-glutamate (10 mM) in presynaptic terminal cytosol.37) Inset records are presynaptic APs and EPSCs sampled from two epochs (i and ii) during whole terminal dialysis. B, Potentiation of evoked EPSCs (open circles) and mEPSCs (filled circles) after loading l-glutamate (100 mM) into presynaptic cytosol. C, Schematic drawing of vesicle recycling and reuse in the nerve terminal. The bottom scheme represents vesicle refilling with glutamate that is driven by the electrochemical proton gradient produced by vacuolar ATPase and mediated by vesicular glutamate transporter (VGLUT). D, Direct estimation for the vesicle glutamate refilling rate. The speed of vesicle refilling with glutamate estimated at the calyx of Held, using the MNI-glutamate photolysis.42)
Figure 4.
Figure 4.
Activity-dependent VGCC facilitation. A, Repetitive activation of presynaptic Ca2+ currents causes transient facilitation followed by sustained inactivation of VGCCs at the calyx of Held.51) B, Paired-pulse presynaptic stimulation using AP-waveform command pulses (top trace) induces facilitation of VGCCs (second traces) and ensuing EPSC facilitation (bottom trace) at the calyx of Held (left panel). Manual attenuation of the AP-waveform command pulse amplitude to cancel VGCC facilitation reduces EPSC facilitation (right panel). The percentage contribution of VGCC facilitation to EPSC facilitation is about 50%, irrespective of the intracellular Ca2+ buffer strength (lower bar graphs).58) In these experiments, p is lowered with botulinum toxin E included in presynaptic pipettes to minimize synaptic depression. C, VGCC facilitation during repetitive stimulation at the calyx of Held in wild type mice (WT, upper panel, with sample records in inset) and VGCC inactivation in P/Q-type VGCC knockout mice, where N-type VGCCs take over the P/Q-type VGCC current (lower panel).60)
Figure 5.
Figure 5.
Synaptic vesicle endocytosis. A, The principle of membrane capacitance measurements. Exocytic fusion of vesicles increases the surface area of nerve terminal plasma membranes, thereby causing an abrupt increase in presynaptic membrane capacitance (ΔCm) as monitored with a whole-cell patch pipette connected to a lock-in amplifier. During endocytosis, membrane retrieval of multiple vesicles gradually decreases whole-terminal membrane capacitance. B, GTPγS (200 µM) loaded into the calyx terminal blocks endocytosis with no immediate effect on exocytosis (upper traces, with or without GTPγS, superimposed).62) However, exocytosis gradually declines to a low level during repetitive stimulation in a use-dependent manner (lower panel). C, Intra-terminal loading of EGTA (10 mM, red trace) or BAPTA (1 mM, blue) attenuates both exocytosis and endocytosis at the calyx of Held before hearing onset. In the bottom panel, records are normalized at the exocytic ΔCm amplitude and superimposed to show the time course of endocytosis slowed by Ca2+ chelators.66)
Figure 6.
Figure 6.
Retrograde feedback mechanism for maintenance of fidelity of high-frequency synaptic transmission at the calyx of Held.68,69) A, The feedback cascade starting from exocytic release of glutamate, and acceleration of vesicle endocytosis via PIP2 upregulation. B, Whole-cell loading of the PKG inhibitor Rp-cGMPS (3 µM) into the calyx presynaptic terminal (scheme in top panel) impairs fidelity of synaptic transmission (output/input AP ratio, bottom panel) during 100 Hz continuous stimulation of a presynaptic terminal (“input” in top panel). Postsynaptic AP firings (sample traces in the middle panel at different epochs [a–d] during stimulation, control in black and with Rp-cGMPS in red) are monitored with an extracellular electrode attached to an MNTB neuron (“output” in top panel).
Figure 7.
Figure 7.
VGCC-vesicle coupling in the calyx presynaptic terminal.72) A, Freeze-fracture immunogold labeling of Cav2.1 at the calyx of Held of P14 rats. Upper left panel, Cav2.1 particles (5 nm) co-exist with active zone protein RIM immunogold particles (2 nm) within the same cluster (encircled in green). Lower panel, Cav2.1 particles (artificially labeled in green) forming 4 clusters. Right panel, many Cav2.1 clusters on the presynaptic surface. B, Attenuation of EPSC amplitude by 10 mM EGTA switched at time 0 from 0.1 mM EGTA using pipette perfusion. C, Schematic drawing of the topography of a VGCC cluster and synaptic vesicles. D, Perimeter coupling model. Top panel, contour plots for isovalue lines of EGTA inhibition (percentage of inhibition of EPSCs by 10 mM EGTA) around open VGCC clusters. Bottom panel, EGTA-inhibition vs perimeter coupling distance (PCD, upper panel) and vesicle release probability (Pv) vs PCD (lower panel) assuming various number of open VGCCs in a cluster (1–64).
Figure 8.
Figure 8.
Developmental switch of VGCC subtypes. A, Multiple VGCC subtypes mediate synaptic transmission at CNS synapses.75) Bar graphs indicate the proportion of VGCCs resistant to blockers of P/Q-type channels (filled bars), N-type channels (open bars) and L-type channels (hatched bars) at cerebellar synapses (left column), spinal cord (middle) and hippocampus (right). B, Developmental changes in the ω-conotoxin-sensitive (N-type) fraction of postsynaptic currents.76) The N-type channel-dependent fraction becomes undetectable after P20 in the calyx of Held, cerebellar PC-DCN and reticulo-thalamic synapses, whereas it remains essentially constant throughout development at cerebellar and spinal cord synapses. C, The N-to-P/Q type switch at cerebellar PC-DCN inhibitory synapses.76) IPSCs are sensitive to ω-conotoxin at P7 (top panel), but become resistant at P16 (middle panel). Developmental decline in the ω-conotoxin-sensitive fraction of IPSCs (bottom panel). D, Effects of TTX, the pan-Trk antagonist k252a, or neurotrophins +TTX, included in culture media, on the N-type channel (ω-conotoxin-sensitive) fraction of IPSCs.78) ω-conotoxin sensitivity of IPSCs is tested in their absence at DIV12–14.
Figure 9.
Figure 9.
Postnatal developmental changes in synaptic strength and precision. A, Developmental increase in synaptic strength to high frequency inputs at the calyx of Held.79) Upper panel, EPSCs with similar amplitudes, evoked at 0.05 Hz at P7, P10 and P14. Lower panels, EPSCs evoked at 1 Hz (sample records superimposed) undergo stronger depression at P7 than at P14 (left panel). Developmental increase in steady state EPSC amplitude (Iss) during 1 Hz stimulation (right panel, Iss/I1st in ordinate). B, Mechanisms underlying developmental acceleration of presynaptic APs.82) Presynaptic APs at P7, P14 and P20 (left traces, superimposed). Voltage-gated potassium currents evoked by depolarizing calyceal terminals from −80 mV to 0 mV in 20 mV steps at P7, P14 and P20 (right upper panel). Developmental acceleration in the rising phase of potassium currents from P7 to P14 and P20 (superimposed after normalizing current amplitudes in the right lower panel). C, Developmental increase in synaptic precision.72) APs (top traces), EPSCs (middle traces) and vesicular release rate (bottom traces) calculated by deconvolution of EPSCs with mEPSCs at P7 (left traces) and P14 (right) calyces of Held. Gray traces are those in the presence of 10 mM EGTA. Right panels indicate release rates (upper panel) and synaptic delays (lower panel) predicted by simulation for different PCDs (abscissae). AP waveforms at P7 (green lines) and P14 (black lines) are used for the simulation. Left bottom, schematic drawings for vesicle (blue)-VGCC (black) couplings at P7 and P14. D, Developmental decrease in the Ca2+ domain area involved in vesicle endocytosis.66) 10 mM EGTA (red trace) or 1 mM BAPTA (blue trace) no longer attenuates endocytic capacitance change after hearing onset (cf. Fig. 5C). Exocytic capacitance magnitudes are normalized and superimposed in the rightmost panel. E, Developmental acquisition of the PKG-dependent signal cascade for endocytic acceleration.68) Capacitance change induced by a 20 ms depolarizing pulse at P7 (left) and P14 (right) calyces, in the presence (red) or absence (black) of the PKG inhibitor Rp-cGMPS (3 µM), in presynaptic terminals. Note the similar endocytic time course between P7 and P14 in the presence of the PKG inhibitor.

References

    1. Sherrington, C. (1906) The Integrative Action of the Nervous System. Yale Univ. Press, New Haven.
    1. Katz B., Miledi R. (1967) The timing of calcium action during neuromuscular transmission. J. Physiol. 189, 535–544. - PMC - PubMed
    1. Del Castillo J., Katz B. (1954) Quantal components of the end-plate potential. J. Physiol. 124, 560–573. - PMC - PubMed
    1. Katz, B. (1969) The Release of Neural Transmitter Substances. The Sherrington Lectures X, Liverpool Univ. Press, Liverpool.
    1. Hagiwara S., Tasaki I. (1958) A study on the mechanism of impulse transmission across the gian synapse of the squid. J. Physiol. 143, 114–137. - PMC - PubMed