

Losartan ameliorates dystrophic epidermolysis bullosa and uncovers new disease mechanisms
- PMID: 26194911
- PMCID: PMC4568953
- DOI: 10.15252/emmm.201505061
Losartan ameliorates dystrophic epidermolysis bullosa and uncovers new disease mechanisms
Abstract
Genetic loss of collagen VII causes recessive dystrophic epidermolysis bullosa (RDEB)-a severe skin fragility disorder associated with lifelong blistering and disabling progressive soft tissue fibrosis. Causative therapies for this complex disorder face major hurdles, and clinical implementation remains elusive. Here, we report an alternative evidence-based approach to ameliorate fibrosis and relieve symptoms in RDEB. Based on the findings that TGF-β activity is elevated in injured RDEB skin, we targeted TGF-β activity with losartan in a preclinical setting. Long-term treatment of RDEB mice efficiently reduced TGF-β signaling in chronically injured forepaws and halted fibrosis and subsequent fusion of the digits. In addition, proteomics analysis of losartan- vs. vehicle-treated RDEB skin uncovered changes in multiple proteins related to tissue inflammation. In line with this, losartan reduced inflammation and diminished TNF-α and IL-6 expression in injured forepaws. Collectively, the data argue that RDEB fibrosis is a consequence of a cascade encompassing tissue damage, TGF-β-mediated inflammation, and matrix remodeling. Inhibition of TGF-β activity limits these unwanted outcomes and thereby substantially ameliorates long-term symptoms.
Keywords: TGF‐β; collagen VII; dystrophic epidermolysis bullosa; fibrosis; losartan.
© 2015 The Authors. Published under the terms of the CC BY 4.0 license.
Figures
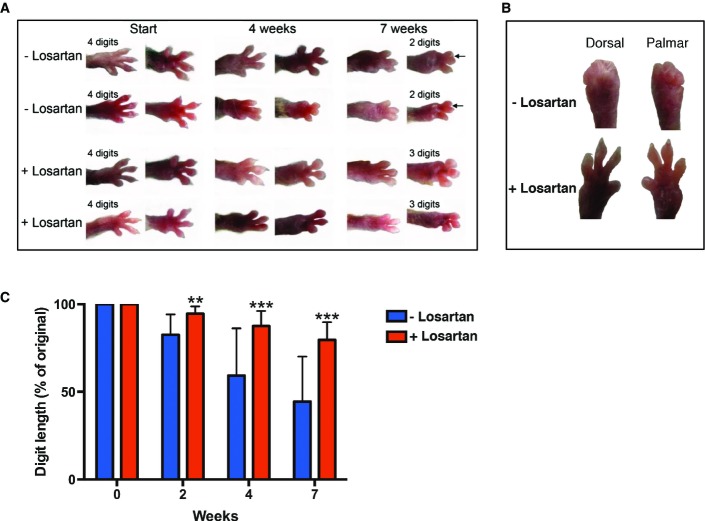
Dorsal and palmar view of the right forepaw of the C7-hypomorphic mice. At the start of treatment, the mice were on average 5.5 weeks old. The treated group received 0.6 g losartan per liter drinking water. Shown are photographs of two untreated mice and two mice receiving losartan at the start, after 4 weeks, and at the end of the experiment after 7 weeks. Note the fibrosis-driven loss and fusion of digits with time; the arrows indicate digit fusion.
Forepaws viewed dorsally or palmary after 7 weeks of treatment ± losartan. Shown is a good responder of losartan treatment and one mouse from the control group with rapid mutilation rate.
Bar graph of forepaw digit length in age-matched untreated (blue) vs. losartan-treated C7-hypomorphic mice (red) after 2, 4, and 7 weeks of treatment. The length of digits at the start of the experiment was set to 100%; the quantification procedure is described in detail in the Materials and Methods section. Losartan very potently inhibited the reduction of digit length. Values represent mean ± S.D. Due to the inherent heterogeneity in disease progression, equal variance could not be expected and statistical significance was therefore analyzed by the unpaired t-test with Welch’s correction; for 2 weeks, **P = 0.0021, and for 4 and 7 weeks, ***P < 0.001 (n = 14 per group).
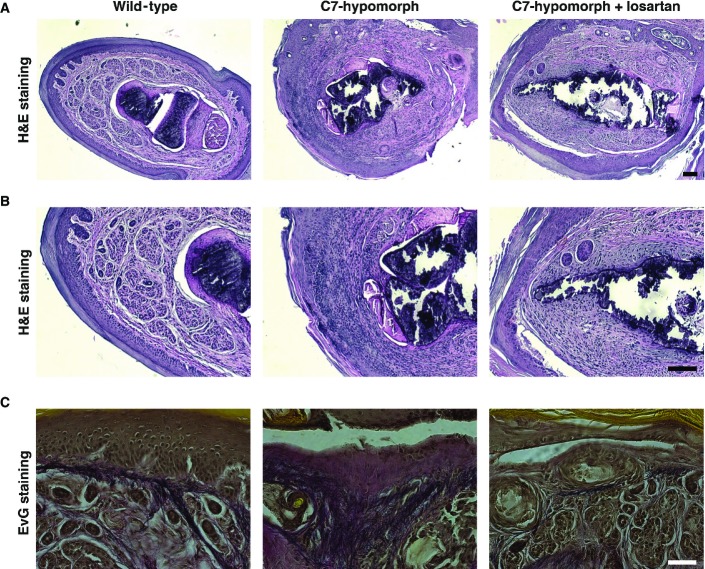
A, B H&E staining in low (A) and higher (B) magnification of the same forepaw digits. Note widening of the dermis, rich infiltration of inflammatory cells, and deposition of dense material in untreated C7-hypomorphic forepaw digits compared to wild-type. Losartan effectively reduced dermal width, inflammatory infiltrates, and deposition of dense fibrotic material. However, losartan treatment did not protect against friction-induced dermal–epidermal separation visible as epidermal detachment in untreated and losartan-treated C7-hypomorphic digits. Scale bars = 100 μm.
C EvG staining of forepaw digits as in (A, B). In wild-type digits, the dermis elastic fibers (black) are densely organized in the papillary dermis. Untreated C7-hypomorphic digits show increased collagen deposition (red) and loosening and disarrangement of elastic fiber organization (black), losartan treatment reduces collagen deposition and improves the appearance of elastic fibers. Scale bar = 50 μm.
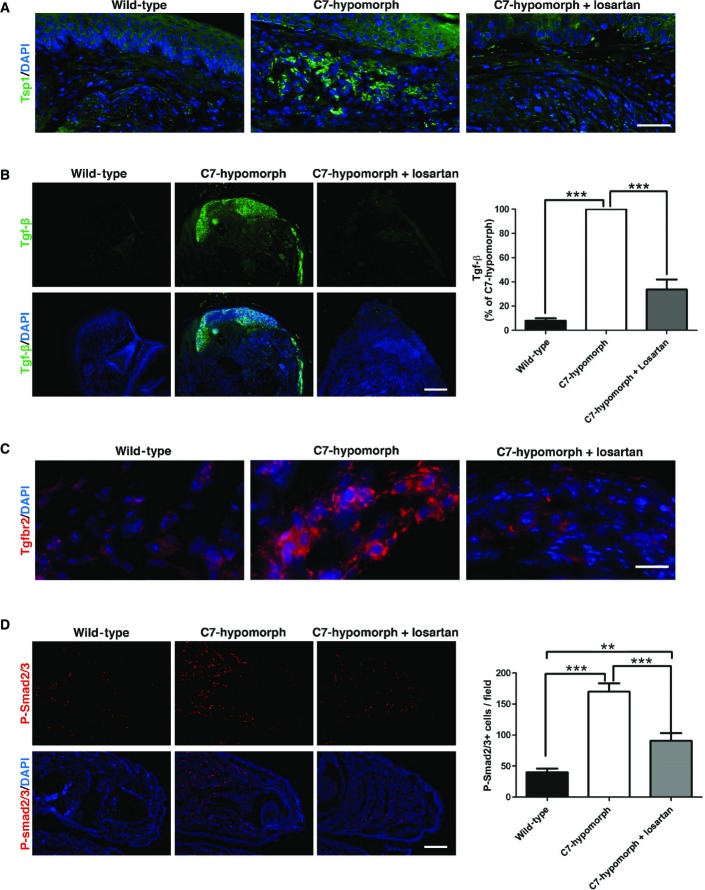
A–D C7-hypomorphic mice were treated with losartan for 7 weeks, and the forepaws of age-matched untreated, losartan-treated, and wild-type mice were subjected to immunofluorescence staining with antibodies to active thrombospondin 1 (Tsp1, green) (A), active Tgf-β1 (green) (B), TGF-β receptor II (Tgfbr2, red) (C), and phospho-Smad2 and 3 (P-Smad2/3, red) (D). The nuclei were counterstained with DAPI (blue). Images were acquired with a 20× objective (scale bar = 100 μm) (A), with a 4× objective (scale bar = 200 μm) (B, D), and with a 40× objective (scale bar = 50 μm) (C). The bar graphs on the right show quantification of the stainings in the left panel of (B) and (D). Paired values were normalized to the staining intensity of untreated C7-hypomorphic paws, which were set to 100%. Values represent mean ± S.E.M., n = 6, paired Student’s t-test, ***P-value wild-type vs. C7-hypomorph receiving no treatment = 0.0004; ***P-value losartan treatment vs. no treatment = 0.0005 (B). Values represent mean ± S.E.M., n ≥ 7, unpaired t-test with Welch’s correction used, ***P-value wild-type vs. C7-hypomorph < 0.0001; ***P-value C7-hypomorph + losartan vs. C7-hypomorph = 0.0002; **P-value wild-type vs. C7-hypomorph + losartan = 0.0016 (D).
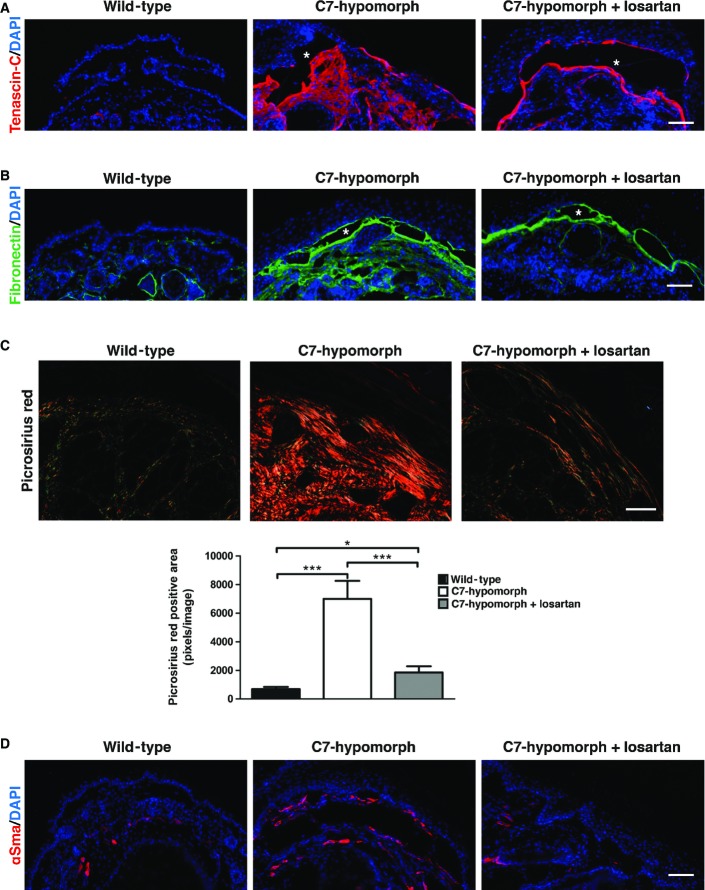
A, B Tenascin-C (red) (A), fibronectin (green) (B). The nuclei were visualized with DAPI (blue). Images acquired with a 20× objective, scale bar = 100 μm. Note that losartan did not completely abolish the staining, but effectively limited fibrosis to the site of initial tissue damage, that is, adjacent to the dermal–epidermal blistering (denoted by white asterisks) in C7-hypomorphic skin.
C Picrosirius red staining and visualization of the collagen fibers under cross polarizing light. Under this light, thin fibers appear green and thick rigid collagen bundles orange-red. The staining revealed significantly reduced collagen fiber size in losartan-treated skin, indicating softer tissue similar to wild-type skin. Below, the bar graph shows quantification of picrosirius red-positive areas, n ≥ 19 areas quantified, values represent mean ± S.E.M. Unpaired t-test with Welch’s correction, ***P-value wild-type vs. C7-hypomorph < 0.0001; ***P-value C7-hypomorph + losartan vs. C7-hypomorph = 0.0004; *P-value wild-type vs. C7-hypomorph + losartan = 0.0189. Images acquired with a 20× objective, scale bar = 50 μm.
D Immunofluorescence staining of forepaws as above with an antibody to αSma (red). αSma is present both around blood vessels and in myofibroblasts. Note the increase of αSma+ myofibroblasts in C7-hypomorphic paws and reduced number of αSma+ cells in losartan-treated C7-hypomorphic forepaws. Images acquired with a 20× objective, scale bar = 100 μm.
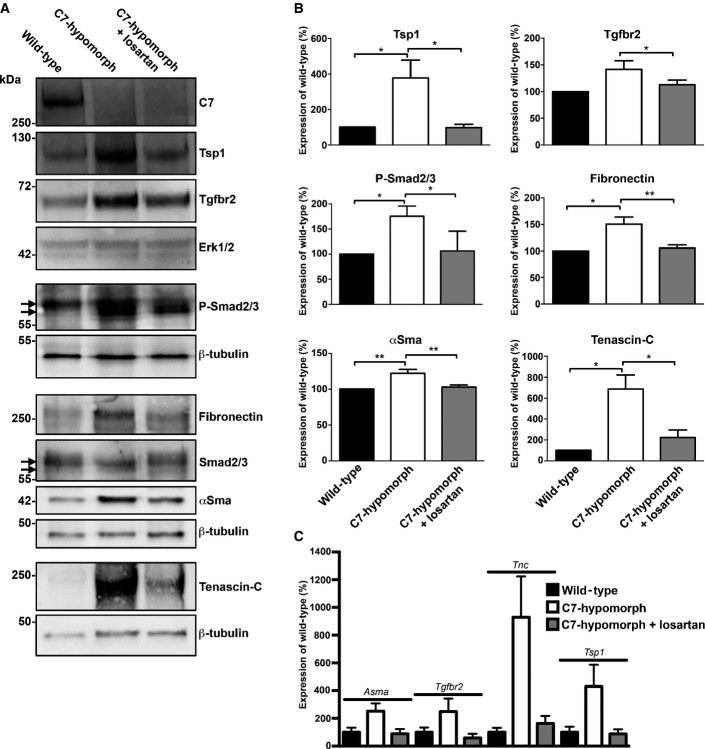
Representative Western blots of whole forepaw skin lysates from age-matched wild-type, untreated C7-hypomorphic, and C7-hypomorphic mice treated with losartan for 7 weeks, probed for proteins analyzed in Figs3 and 4. Erk1/2 or β-tubulin was used as a loading control. While losartan did not increase the expression of C7, it effectively attenuated fibrosis by reducing Tgf-β signaling and subsequent Tgf-β-regulated protein expression. Arrows point to bands corresponding to Smad2 and Smad3.
Densitometric quantification of Western blots as in (A) from multiple different mice per group (n ≥ 3). Expression was normalized to a loading control (Erk1/2 or β-tubulin) and protein level expressed as percentage of wild-type. Values represent mean ± S.E.M. The data were analyzed by Student’s paired t-test; P-values wild-type vs. C7-hypomorph: Tsp1 *P = 0.0490, Tgfbr2 P = 0.0812, P-Smad2/3 *P = 0.0346, fibronectin *P = 0.0115, αSma *P = 0.0038, tenascin-C *P = 0.0228; P-values C7-hypomorph + losartan vs. C7-hypomorph: Tsp1 *P = 0.0415, Tgfbr2 *P = 0.0483, P-Smad2/3 *P = 0.0272, fibronectin **P = 0.0025, αSma **P = 0.0038, tenascin-C *P = 0.0134; P-values wild-type vs. C7-hypomorph + losartan: all not significant.
Quantitative real-time PCR (qPCR) analysis of RNA isolated from whole forepaw skin of mice as in (A). Expression of Asma (Acta2), Tgfbr2, Tsp1 (Thsb1), and Tnc normalized to the expression of Gapdh and shown as the percentage of wild-type expression. Losartan treatment downregulated the expression of all four genes that were elevated in untreated C7-hypomorphic mouse paws. The reduction of Asma, Tgfbr2, and Tsp1 did not reach statistical significance in one or two conditions due to large variation in the samples. Values represent mean ± S.E.M., unpaired t-test with Welch’s correction used; P-values wild-type vs. C7-hypomorph: Asma P = 0.059, Tgfbr2 P = 0.17, Tnc *P = 0.019, Tsp1 P = 0.098; P-values C7-hypomorph + losartan vs. C7-hypomorph: Asma *P = 0.048, Tgfbr2 P = 0.089, Tnc *P = 0.028, Tsp1 P = 0.087; P-values wild-type vs. C7-hypomorph + losartan: Asma P = 0.81, Tgfbr2 P = 0.36, Tnc P = 0.33, Tsp1 P = 0.81; n ≥ 5 different paws per group.
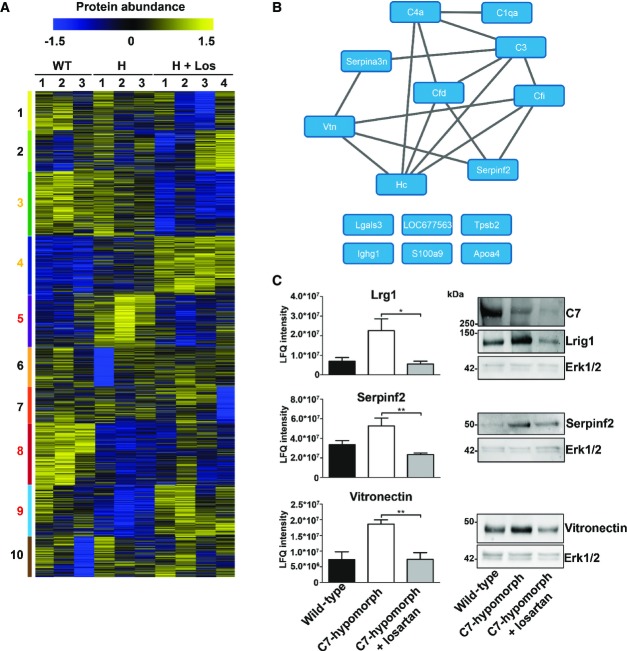
Heat map of cluster analysis of protein abundances determined by label-free quantification mass spectrometry. Extracted ion currents were used to determine protein abundances, and respective intensities were log2-transformed and normalized (z-score). Samples were clustered hierarchically, and protein abundances were clustered by k-means. Cluster sizes are indicated by color code on the left. Clusters 3, 4, 5, 8, and 9 highlight losartan-induced changes. The general patterns of protein abundance in clusters 5, 8, and 9 are similar in wild-type and losartan-treated C7-hypomorphic mice and thus contain downstream targets of losartan involved in RDEB disease progression. WT, wild-type; H, hypomorphic; H + Los, losartan-treated C7-hypomorphic skin.
Proteins from cluster 5 carrying GO terms related to inflammation were short-listed and analyzed on potential interactions using default settings in STRING DB (confidence score 0.4) (Szklarczyk et al, 2015).
Bar graphs show abundance of selected representative proteins in cluster 5 that were normalized by losartan treatment. Shown to the left are the mean ± S.E.M. of the normalized protein abundance (LFQ intensity) of groups of individual mice corresponding to wild-type, untreated, and losartan-treated C7-hypomorphic mice as indicated in the figure. Unpaired t-test was used to calculate significance. Abundance of Lrg1: *P-value C7-hypomorphic vs. losartan-treated C7-hypomorphic mice = 0.022; abundance of serpin f2: **P-value untreated C7-hypomorphic vs. losartan-treated C7-hypomorphic mice = 0.0084; abundance of vitronectin: **P-value untreated C7-hypomorphic vs. losartan-treated C7-hypomorphic mice = 0.0094. Right, validation of proteomics analysis by Western blotting of independent biological replicates. Representative Western blots of skin lysates from wild-type, untreated C7-hypomorphic, and 7-week losartan-treated C7-hypomorphic mice not used for proteomics. Blots were probed with antibodies against proteins as indicated. Erk1/2 and β-tubulin served as loading controls. The analysis shows that there is a good correlation between proteomics data and abundance detected by Western blotting (n = 3 per group).
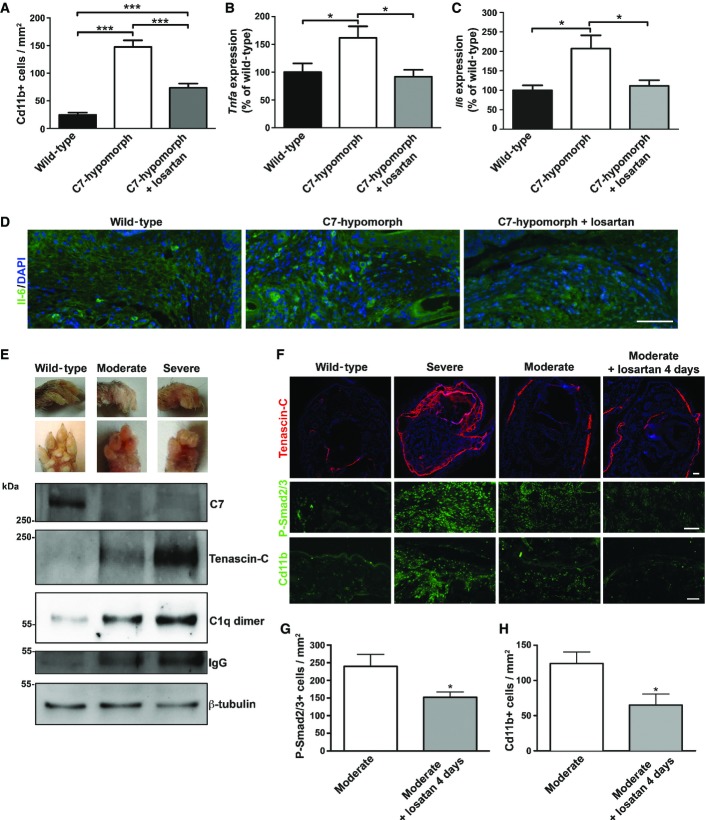
A Quantification of Cd11b-positive cells shows that losartan treatment significantly reduced the number of these cells in C7-hypomorphic paws. Values represent mean Cd11b-positive cells per 1 mm2 ± S.E.M. Unpaired t-test with Welch’s correction was used, ***P-value wild-type vs. C7-hypomorph < 0.0001; ***P-value C7-hypomorph + losartan vs. C7-hypomorph = 0.0008; ***P-value wild-type vs. C7-hypomorph + losartan < 0.0001 (n = 5).
B, C qPCR analysis of Tnfa and Il6 mRNA expression in forepaws, normalized to the housekeeping gene Gapdh. Treatment with losartan significantly lowered the elevated expression of both genes in C7-hypomorphic paws. Values are expressed as percentage of expression in age-matched wild-type forepaws and represent mean ± S.E.M. Unpaired t-test with Welch’s correction used for data analysis. (B) *P-value wild-type vs. C7-hypomorph = 0.033; *P-value C7-hypomorph +losartan vs. C7-hypomorph = 0.015; P-value wild-type vs. C7-hypomorph + losartan = 0.57, n = 5. (C) *P-value wild-type vs. C7-hypomorph = 0.69; *P-value C7-hypomorph + losartan vs. C7-hypomorph = 0.029; P-value wild-type vs. C7-hypomorph + losartan = 0.57, n = 5.
D Immunofluorescence staining of age-matched wild-type, untreated and losartan-treated C7-hypomorphic forepaws with an antibody to Il-6. The number of Il-6-positive bright cells (green) is clearly increased in untreated C7-deficient skin, and nearly normalized after 7-week losartan treatment. Nuclei visualized with DAPI. Images acquired with a 20× objective, scale bar = 100 μm.
E Correlation of tissue inflammation with disease progression in RDEB. Photographs of wild-type and moderately and severely affected C7-hypomorphic forepaws. These paws were processed for Western blotting shown below. The blots were probed with antibodies detecting C7, tenascin-C, C1q, and IgG. β-tubulin was used as a loading control. Shown for C1q is a dimeric form (Wing et al, 1993). Note the difference between moderately and severely affected paws. The C7 expression does not differ, but the severely affected paw with more extensive fibrosis and tenascin-C expression indicating remodeling also displays more tissue inflammation, as shown by increased C1q and IgG levels.
F Short-term losartan treatment rapidly alleviated inflammation through reduction of Tgf-β signaling. Sections of forepaws as in (E) plus sections of forepaws of C7-hypomorphic mice with moderately affected paws treated with losartan for 4 days were stained for tenascin-C, P-Smad2/3, and Cd11b. There is a clear correlation between the extent of fibrosis, as revealed by tenascin-C staining; Tgf-β signaling, as detected by P-Smad2/3; and inflammation, as indicated by Cd11b+ cells in the C7-hypomorphic forepaws. The 4-day losartan treatment efficiently reduced Tgf-β signaling (P-Smad2/3) and inflammation (Cd11b+) in moderately affected paws, as compared to untreated C7-hypomorphic paws with similar degree of fibrosis. Collectively, the data show that TGF-β-mediated inflammation is a driver of disease progression in RDEB and a major losartan target. Scale bars = 100 μm.
G, H Quantification of stainings of moderately affected C7-hypomorphic forepaws with or without a 4-day losartan treatment as in (F). Positively stained cells were quantified after background had been subtracted by applying equal threshold. The values were expressed as positive cells per mm2. Values represent mean ± S.E.M. Data were analyzed with unpaired t-test with Welch’s correction. (G) P-Smad2/3 staining, *P = 0.033. (H) Cd11b+ cells, *P = 0.027. n = 3 different mice per group.
References
-
- Bruckner-Tuderman L. Dystrophic epidermolysis bullosa: pathogenesis and clinical features. Dermatol Clin. 2010;28:107–114. - PubMed
-
- Campistol JM, Inigo P, Jimenez W, Lario S, Clesca PH, Oppenheimer F, Rivera F. Losartan decreases plasma levels of TGF-beta1 in transplant patients with chronic allograft nephropathy. Kidney Int. 1999;56:714–719. - PubMed
-
- Colmenero J, Bataller R, Sancho-Bru P, Dominguez M, Moreno M, Forns X, Bruguera M, Arroyo V, Brenner DA, Gines P. Effects of losartan on hepatic expression of nonphagocytic NADPH oxidase and fibrogenic genes in patients with chronic hepatitis C. Am J Physiol Gastrointest Liver Physiol. 2009;297:G726–G734. - PMC - PubMed
Publication types
MeSH terms
Substances
LinkOut - more resources
Full Text Sources
Other Literature Sources
Medical
Molecular Biology Databases
