

Low-grade inflammation in symptomatic knee osteoarthritis: prognostic value of inflammatory plasma lipids and peripheral blood leukocyte biomarkers
- PMID: 26195278
- PMCID: PMC4626321
- DOI: 10.1002/art.39279
Low-grade inflammation in symptomatic knee osteoarthritis: prognostic value of inflammatory plasma lipids and peripheral blood leukocyte biomarkers
Abstract
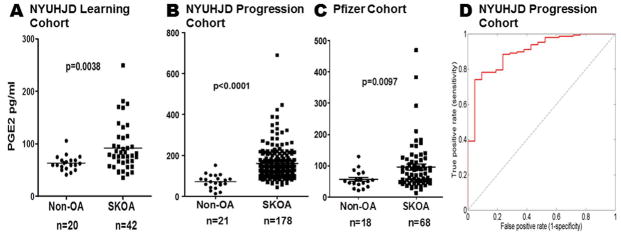
Objective: Inflammatory mediators, such as prostaglandin E2 (PGE2 ) and interleukin-1β (IL-1β), are produced by osteoarthritic (OA) joint tissue, where they may contribute to disease pathogenesis. We undertook the present study to examine whether inflammation, evidenced in plasma and peripheral blood leukocytes (PBLs), reflects the presence, progression, or specific symptoms of symptomatic knee OA.
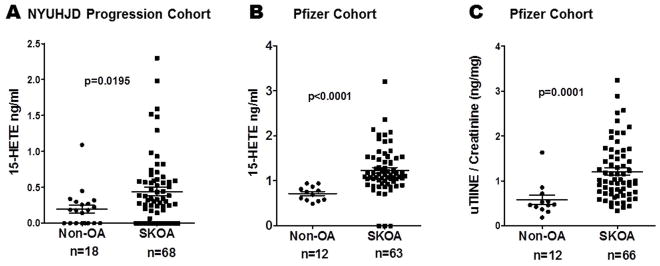
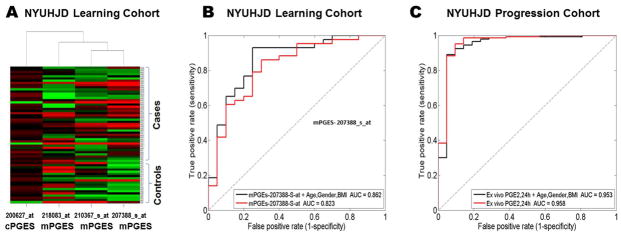
Methods: Patients with symptomatic knee OA were enrolled in a 24-month prospective study of radiographic progression. Standardized knee radiographs were obtained at baseline and 24 months. At baseline, levels of the plasma lipids PGE2 and 15-hydroxyeicosatetraenoic acid (15-HETE) were measured, and transcriptome analysis of PBLs was performed by microarray and quantitative polymerase chain reaction.
Results: Baseline PGE2 synthase (PGES) levels determined by PBL microarray gene expression and plasma PGE2 levels distinguished patients with symptomatic knee OA from non-OA controls (area under the receiver operating characteristic curve [AUC] 0.87 and 0.89, respectively, P < 0.0001). Baseline plasma 15-HETE levels were significantly elevated in patients with symptomatic knee OA versus non-OA controls (P < 0.0195). In the 146 patients who completed the 24-month study, elevated baseline expression of IL-1β, tumor necrosis factor α, and cyclooxygenase 2 (COX-2) messenger RNA in PBLs predicted higher risk of radiographic progression as evidenced by joint space narrowing (JSN). In a multivariate model, AUC point estimates of models containing COX-2 in combination with demographic traits overlapped the confidence interval of the base model in 2 of the 3 JSN outcome measures (JSN >0.0 mm, JSN >0.2 mm, and JSN >0.5 mm; AUC 0.62-0.67).
Conclusion: The inflammatory plasma lipid biomarkers PGE2 and 15-HETE identify patients with symptomatic knee OA, and the PBL inflammatory transcriptome identifies a subset of patients with symptomatic knee OA who are at increased risk of radiographic progression. These findings may reflect low-grade inflammation in OA and may be useful as diagnostic and prognostic biomarkers in clinical development of disease-modifying OA drugs.
© 2015, American College of Rheumatology.
Figures
Comment in
-
Editorial: inflammatory activity in symptomatic knee osteoarthritis: not all inflammation is local.Arthritis Rheumatol. 2015 Nov;67(11):2797-800. doi: 10.1002/art.39304. Arthritis Rheumatol. 2015. PMID: 26246460 Free PMC article. No abstract available.
References
-
- Abramson SB, Attur M, Yazici Y. Prospects for disease modification in osteoarthritis. Nat Clin Pract Rheumatol. 2006;2:304–12. - PubMed
-
- Attur M, Belitskaya-Levy I, Oh C, Krasnokutsky S, Greenberg J, Samuels J, et al. Increased interleukin-1beta gene expression in peripheral blood leukocytes is associated with increased pain and predicts risk for progression of symptomatic knee osteoarthritis. Arthritis Rheum. 2011;63:1908–17. - PMC - PubMed
-
- Berenbaum F. Osteoarthritis as an inflammatory disease (osteoarthritis is not osteoarthrosis!) Osteoarthritis Cartilage. 2013;21:16–21. - PubMed
Publication types
MeSH terms
Substances
Grants and funding
LinkOut - more resources
Full Text Sources
Other Literature Sources
Research Materials
