. 2015 Jul 20;210(2):257-72.
doi: 10.1083/jcb.201411045.

IQGAP1 promotes CXCR4 chemokine receptor function and trafficking via EEA-1+ endosomes

Affiliations

IQGAP1 promotes CXCR4 chemokine receptor function and trafficking via EEA-1+ endosomes

Adebowale O Bamidele et al. J Cell Biol. .

Abstract

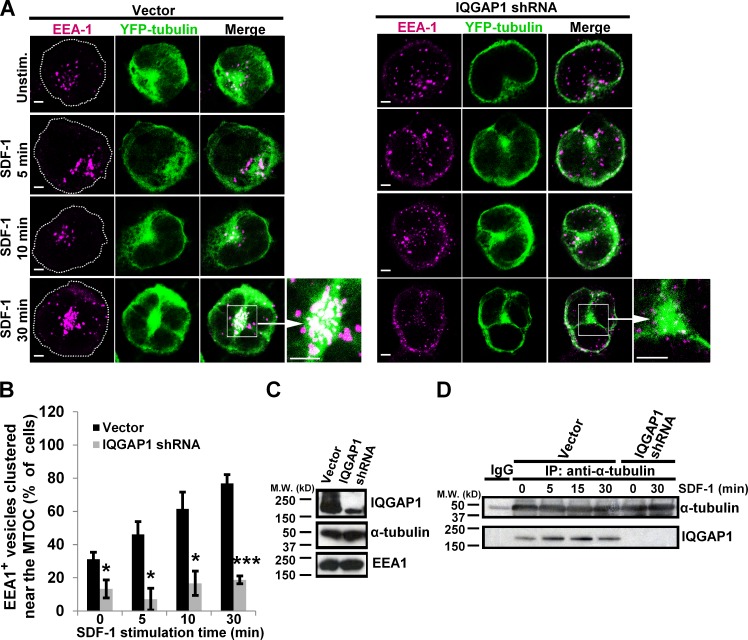
IQ motif-containing GTPase-activating protein 1 (IQGAP1) is a cytoskeleton-interacting scaffold protein. CXCR4 is a chemokine receptor that binds stromal cell-derived factor-1 (SDF-1; also known as CXCL12). Both IQGAP1 and CXCR4 are overexpressed in cancer cell types, yet it was unclear whether these molecules functionally interact. Here, we show that depleting IQGAP1 in Jurkat T leukemic cells reduced CXCR4 expression, disrupted trafficking of endocytosed CXCR4 via EEA-1(+) endosomes, and decreased efficiency of CXCR4 recycling. SDF-1-induced cell migration and activation of extracellular signal-regulated kinases 1 and 2 (ERK) MAPK were strongly inhibited, even when forced overexpression restored CXCR4 levels. Similar results were seen in KMBC and HEK293 cells. Exploring the mechanism, we found that SDF-1 treatment induced IQGAP1 binding to α-tubulin and localization to CXCR4-containing endosomes and that CXCR4-containing EEA-1(+) endosomes were abnormally located distal from the microtubule (MT)-organizing center (MTOC) in IQGAP1-deficient cells. Thus, IQGAP1 critically mediates CXCR4 cell surface expression and signaling, evidently by regulating EEA-1(+) endosome interactions with MTs during CXCR4 trafficking and recycling. IQGAP1 may similarly promote CXCR4 functions in other cancer cell types.


Figures

Figure 1.
Figure 1.
Depletion of IQGAP1 via shRNA inhibits SDF-1–induced ERK activation and migration of Jurkat T leukemic cells. Cells transfected with either IQGAP1 shRNA–encoding plasmid or vector control plasmid were analyzed 72 h later. Both plasmids also encoded GFP to enable identification of transfected cells. (A) Whole cell lysates were immunoblotted for IQGAP1; the same membrane was stripped and reblotted for β-actin as a control. (B) Cells were stimulated as indicated with SDF-1, and then active, phosphorylated ERK in GFP+ cells was determined via flow cytometric analysis of permeabilized cells incubated with specific mAb. Representative results are shown. (C) Summary of multiple experiments performed as in B and including B showing mean responses ± SEM; n = 4; *, P < 0.05; **, P < 0.01. (D) Cell migration was assayed in response to SDF-1 ± SD; n = 4; ***, P < 0.001. Result shown is representative of three independent experiments.
Figure 2.
Figure 2.
IQGAP1 depletion substantially reduces CXCR4 expression on the cell surface. Jurkat cells were transfected as in Fig. 1. (A) Cell surface CXCR4 levels determined by FACS of transfected (GFP+) cells decreased with time after transfection. Representative results are shown. (B) Summary of multiple experiments as in A ± SEM; n = 4. (C) Mean cell surface (Surface) and total cellular (Perm.) CXCR4 protein per cell was determined via flow cytometry 72 h after transfection ± SEM; n = 3. Positive control, Jurkat transfected with CXCR4 shRNA. (D) CXCR4 mRNA determined via quantitative RT-PCR 72 h after transfection. Bars denote mean results compared with 18s mRNA ± SEM; n = 3. (E) No significant differences were seen in TCR cell surface expression in the same cells from A and B; means ± SEM are shown; n = 4. For B–D: ***, P < 0.001.
Figure 3.
Figure 3.
Defective SDF-1–induced ERK activation and migration in IQGAP1-deficient cells are not restored by rescuing CXCR4 expression. (A–C) Jurkat cells were transfected as in Figs. 1 and 2 plus either no (−), low (+), or high (++) amounts of CXCR4-YFP. (A) 48 h after transfection, CXCR4 and TCR cell surface levels were determined as in Fig. 2 (B and E). Bars denote means ± SEM; n = 3. (B) Whole cell lysates of cells from experiments in A and C, immunoblotted with IQGAP1 and ZAP-70 as a control. (C) ERK activation was assayed as in Fig. 1 (B and C). Mean results of multiple experiments are shown ± SEM; n = 4; *, P < 0.05. (D and E) Cells transfected as in A–C were analyzed 72 h later for CXCR4 cell surface expression as in Fig. 2 A (D) or migration as in Fig. 1 D (E). Mean migration ± SD is shown; n = 4; ***, P < 0.001. (F) Cells transfected as in A–C were pretreated with either PTX-b (control) or PTX and then assayed for SDF-1–mediated inhibition of forskolin-induced cAMP. Bars denote the mean cAMP ± SD; n = 3; *, P < 0.05. For A, E, and F, each is representative of three independent experiments.
Figure 4.
Figure 4.
IQGAP1 colocalizes with endocytosed CXCR4 after SDF-1 treatment. Jurkat cells were transfected with CXCR4-YFP, stimulated with SDF-1, and then fixed and stained for YFP and IQGAP1. (A) Representative cell images of 15–30 cells imaged per condition analyzed on three separate days. The dotted line denotes the plasma membrane as seen on DIC images; the boxed region is expanded to show IQGAP1 and CXCR4-YFP colocalization. (B) Line scan intensity profiles of merged images in A. (C) Quantitation of multiple experiments performed as in A and B and including A and B, showing the change in the percentage of cells displaying intracellular CXCR4-YFP, IQGAP1, or colocalized CXCR4-YFP and IQGAP1 at the indicated times after SDF-1 addition ± SEM; n = 3; *, P < 0.05; **, P < 0.01; bars, 2 µm.
Figure 5.
Figure 5.
IQGAP1 depletion disrupts the intracellular trafficking of endocytosed CXCR4 into endosomes clustered near the MTOC. Jurkat cells were transfected as in Fig. 3, and then CXCR4 endocytosis and trafficking were analyzed as indicated. (A and B) CXCR4 endocytosis in response to 30-min SDF-1 treatment was assayed by FACS. (A) Representative result of three separate experiments. (B) Summary of all three experiments performed as in A and including A, showing substantial, but nevertheless deficient, SDF-1–induced endocytosis in IQGAP1-deficient cells. Means ± SEM; n = 3. (C and D) CXCR4-YFP intracellular trafficking visualized via confocal imaging of live, transfected cells 48 h after transfection. 0-min confocal images were taken, then SDF-1 was added, and additional images of the same cell were taken 15 and 30 min later. (C) Representative z-slice images of 11–13 cells analyzed on three separate days. (D) Results of multiple experiments performed as in C and including C, showing the percentage of cells analyzed in each day’s experiment in which CXCR4-YFP–containing endosomes were clustered ± SEM; n = 3 experiments. (E–G) Jurkat cells transfected as in C and D were analyzed 72 h later. Cells were stimulated ± SDF-1 and then fixed and stained as in Fig. 4 A for YFP and α-tubulin. (E) Representative images of 15–30 cells analyzed per condition from experiments performed on three separate days. The dotted lines denote the plasma membrane as seen in DIC images. The area within each cell with the highest α-tubulin staining (the MTOC) was enlarged to show the clustering of CXCR4-YFP–containing endosomes in control (Vector) but not IQGAP1 shRNA–transfected cells. (F) Quantitation of multiple experiments as in E, showing the mean percentage of cells analyzed in each day’s experiment in which ≥30% of the CXCR4-YFP–containing endosomes in the cell were clustered near the MTOC ± SEM; n = 3. (G) Line scan intensity profiles in merged images from E. For B–F: *, P < 0.05; **, P < 0.01; ***, P < 0.001; bars, 2 µm.
Figure 6.
Figure 6.
IQGAP1-deficient Jurkat cells display abnormal CXCR4 trafficking via EEA-1+ endosomes. Jurkat cells were transfected as in Fig. 5 (E and F). 48 h later, cells were stimulated with SDF-1 and then fixed and stained for YFP, EEA-1, Rab7, and/or LAMP2. (A) Representative images are shown; the boxed EEA-1+ regions are enlarged; dotted lines denote the plasma membrane as seen on DIC images. (B) Quantitation of multiple experiments as in A, showing the mean percentage of CXCR4-YFP+ endosomes colocalizing with EEA-1+ vesicles in each cell analyzed in each day’s experiment ± SEM. (C) Representative images are shown. Box, enlarged to show colocalization of CXCR4-YFP and IQGAP1. (D and E) Quantitation of multiple experiments as in C, showing the mean percentage of CXCR4-YFP+ endosomes that colocalized with Rab7+ or LAMP2+ vesicles in each cell analyzed in each day’s experiment ± SEM. For A–E: n = 3 experiments; ***, P < 0.001; bars, 2 µm.
Figure 7.
Figure 7.
IQGAP1 regulates EEA-1+ endosome location relative to the MT cytoskeleton. Jurkat cells were transfected as in Fig. 5 (E and F) plus YFP-tagged tubulin. 72 h later, cells were stimulated with SDF-1 and then fixed and stained for EEA-1 and YFP. (A) Representative results; dotted lines denote the plasma membrane as seen on DIC images; the boxed MTOC areas are enlarged. Bars, 2 µm. (B) Quantitation of multiple experiments as in A, showing the percentage of cells in which ≥30% of EEA-1+ endosomes clustered near the MTOC ± SEM; n = 3; *, P < 0.05; ***, P < 0.001. (C) Immunoblot of whole cell lysates from A and B. (D) Jurkat cells were transfected with vector or IQGAP1 shRNA as in Fig. 1. 72 h later, cells were stimulated with SDF-1, lysed, immunoprecipitated with either anti–α-tubulin or control IgG, and immunoblotted with IQGAP1 and α-tubulin. Result is representative of three independent experiments.
Figure 8.
Figure 8.
IQGAP1 is similarly required for CXCR4 signaling and trafficking via EEA-1+ endosomes in KMBC cholangiocarcinoma and HEK293 cell lines. (A and B) The indicated cell lines were transfected and analyzed as in Figs. 5 E and 6 A. The dotted lines denote the plasma membrane as seen on DIC images. Representative images are shown after 0 or 60 min of SDF-1 treatment. Bars, 5 µm. (C) Whole cell lysates of cells in A and B were immunoblotted for IQGAP1 or α-tubulin as a control. (D) Multiple experiments as in A and B were quantitated as in Figs. 5 F and 6 B ± SEM. (E and F) Cell surface CXCR4 levels of cells in A–D were assayed in Fig. 2 A. (E) Representative results. (F) Means of multiple experiments as in E ± SEM. (G) CXCR4 mRNA levels of cells in A–D were assayed as in Fig. 2 D ± SEM. (H) CXCR4-YFP expression in cells as in A–D performed as in Fig. 3; representative result is shown. (I) Cells expressing CXCR4-YFP as in H were stimulated with SDF-1 and assayed for active ERK as in Fig. 3 C; bars show means ± SEM. (J) Whole cell lysates of cells in H and I were immunoblotted for IQGAP1 and γ-tubulin as a control. For D, F, G, and I: n = 3; *, P < 0.05; **, P < 0.01; ***, P < 0.001.
Figure 9.
Figure 9.
IQGAP1 depletion in Jurkat cells similarly impairs the trafficking and signaling of an ectopically expressed GPCR, DOR1. (A) Jurkat cells stably expressing FLAG-tagged DOR1 were transfected either with IQGAP1 shRNA or a control plasmid as in Fig. 1 A. 72 h later, whole cell lysates were immunoblotted to confirm depletion of IQGAP1 protein. (B) Flow cytometric assay of cell surface DOR1 ± treatment with the DOR1 agonist, Deltorphin; n = 3. (C–E) Deltorphin-induced DOR1 trafficking was assayed as in Fig. 6 A, except that DOR1 was visualized with anti-FLAG. (C and D) Representative images of 15–30 cells analyzed per condition on three separate days are shown. Dotted lines denote the plasma membrane as seen on DIC images. (E) Line scan intensity profiles of the indicated selected merged images from C and D; bars, 2 µm. (F and G) Quantitation as in Figs. 5 F and 6 B of multiple experiments performed as in C and D ± SEM. (H) DOR1-expressing Jurkat cells depleted of IQGAP1 as in A–G were stimulated with Deltorphin and assayed for ERK activation as in Fig. 1 C. Bars denote means ± SEM. For F–H: n = 3; *, P < 0.05; ***, P < 0.001.
Figure 10.
Figure 10.
IQGAP1 is required for efficient CXCR4 recycling after SDF-1 stimulation. (A–C) Jurkat cells were transfected as in Fig. 1 and then assayed for the ability of CXCR4 to recycle back to the cell surface after endocytosis as follows. Either CHX or vehicle (DMSO) was applied to cells before and during the experiment to prevent de novo protein synthesis. CXCR4 cell surface levels were determined by FACS as in Fig. 2 A. (A) Results for unstimulated cells (black bars), cells immediately after 30 min of SDF-1 treatment (white bars), and cells after 30 min of SDF-1 treatment, washing, and additional incubation at 37°C for 1 h to allow CXCR4 recycling (gray bars). Means are shown normalized to CXCR4 levels on control cells (DMSO-treated, vector-transfected, unstimulated cells) ± SEM; n = 4; **, P < 0.01. (B) Same results as in A, replotted to show the fold changes. (C) Control immunoblot showing IQGAP1 protein depletion. Mcl-1 blot confirms CHX inhibition of protein synthesis; total ERK2 is a loading control. (D) Jurkat cells were transfected as in Fig. 5 E, treated with SDF-1, and then fixed and stained for YFP and Rab11. Representative images (top) and line scan intensity profiles of the indicated selected merged images (bottom) of 15–30 cells analyzed per condition on three separate days are shown; dotted lines denote the plasma membrane as seen on DIC images; bars, 2 µm. (E) See Model for IQGAP1 regulation of CXCR4 trafficking and signaling in leukemic cells in Results.

References

    1. Beas A.O., Taupin V., Teodorof C., Nguyen L.T., Garcia-Marcos M., and Farquhar M.G.. 2012. Gαs promotes EEA1 endosome maturation and shuts down proliferative signaling through interaction with GIV (Girdin). Mol. Biol. Cell. 23:4623–4634. 10.1091/mbc.E12-02-0133 - DOI - PMC - PubMed
    1. Bhandari D., Trejo J., Benovic J.L., and Marchese A.. 2007. Arrestin-2 interacts with the ubiquitin-protein isopeptide ligase atrophin-interacting protein 4 and mediates endosomal sorting of the chemokine receptor CXCR4. J. Biol. Chem. 282:36971–36979. 10.1074/jbc.M705085200 - DOI - PubMed
    1. Bhandari D., Robia S.L., and Marchese A.. 2009. The E3 ubiquitin ligase atrophin interacting protein 4 binds directly to the chemokine receptor CXCR4 via a novel WW domain-mediated interaction. Mol. Biol. Cell. 20:1324–1339. 10.1091/mbc.E08-03-0308 - DOI - PMC - PubMed
    1. Bivona T.G., Pérez De Castro I., Ahearn I.M., Grana T.M., Chiu V.K., Lockyer P.J., Cullen P.J., Pellicer A., Cox A.D., and Philips M.R.. 2003. Phospholipase Cγ activates Ras on the Golgi apparatus by means of RasGRP1. Nature. 424:694–698. 10.1038/nature01806 - DOI - PubMed
    1. Brown M.D., Bry L., Li Z., and Sacks D.B.. 2007. IQGAP1 regulates Salmonella invasion through interactions with actin, Rac1, and Cdc42. J. Biol. Chem. 282:30265–30272. 10.1074/jbc.M702537200 - DOI - PubMed

Publication types