. 2015 Aug 4;112(31):E4272-80.
doi: 10.1073/pnas.1423449112. Epub 2015 Jul 20.

Keap1 regulates inflammatory signaling in Mycobacterium avium-infected human macrophages

Affiliations

Keap1 regulates inflammatory signaling in Mycobacterium avium-infected human macrophages

Jane Atesoh Awuh et al. Proc Natl Acad Sci U S A. .

Abstract

Several mechanisms are involved in controlling intracellular survival of pathogenic mycobacteria in host macrophages, but how these mechanisms are regulated remains poorly understood. We report a role for Kelch-like ECH-associated protein 1 (Keap1), an oxidative stress sensor, in regulating inflammation induced by infection with Mycobacterium avium in human primary macrophages. By using confocal microscopy, we found that Keap1 associated with mycobacterial phagosomes in a time-dependent manner, whereas siRNA-mediated knockdown of Keap1 increased M. avium-induced expression of inflammatory cytokines and type I interferons (IFNs). We show evidence of a mechanism whereby Keap1, as part of an E3 ubiquitin ligase complex with Cul3 and Rbx1, facilitates ubiquitination and degradation of IκB kinase (IKK)-β thus terminating IKK activity. Keap1 knockdown led to increased nuclear translocation of transcription factors NF-κB, IFN regulatory factor (IRF) 1, and IRF5 driving the expression of inflammatory cytokines and IFN-β. Furthermore, knockdown of other members of the Cul3 ubiquitin ligase complex also led to increased cytokine expression, further implicating this ligase complex in the regulation of the IKK family. Finally, increased inflammatory responses in Keap1-silenced cells contributed to decreased intracellular growth of M. avium in primary human macrophages that was reconstituted with inhibitors of IKKβ or TANK-binding kinase 1 (TBK1). Taken together, we propose that Keap1 acts as a negative regulator for the control of inflammatory signaling in M. avium-infected human primary macrophages. Although this might be important to avoid sustained or overwhelming inflammation, our data suggest that a negative consequence could be facilitated growth of pathogens like M. avium inside macrophages.

Keywords: Keap1; Mycobacterium avium; human primary macrophages; infection; inflammation.


Conflict of interest statement

The authors declare no conflict of interest.

Figures

Fig. 1.
Fig. 1.
M. avium induced cellular ROS generation and recruitment of Keap1 to its phagosome. (A) M. avium induction of cellular ROS production in human primary macrophages detected by confocal microscopy. After a 1-h infection, ROS was analyzed by a fluorogenic marker for ROS in live cells, 5-(and-6)-carboxy-2′,7′-dichlorodihydrofluoresceindiacetate (carboxy-H2DCFDA), and TBHP was used as a positive control. NAC 5 mM was used to inhibit ROS production. (B) Quantification of ROS induction per cell by using Imaris Cell module from three independent experiments counting at least 100 cells for each condition. (C) MDMs were infected with CFP-M. avium for 4 h and fixed in 2% PFA, and localization of Keap1 was assessed by immunofluorescence staining. (D) Quantification of Keap1 association with M. avium phagosomes at 4 and 24 h after infection by immunofluorescence from three independent experiments, counting at least 50 infected cells per condition. (E) Quantification of the effect of ROS inhibition on Keap1 association with M. avium phagosomes. Macrophages were pretreated with ROS inhibitors NAC and DPI, 100 µM, for 30 min, and then cells were infected for 4 h, fixed, and stained for Keap1. (F) Quantification of the effect of p62 siRNA knockdown (sip62) on Keap1 association with M. avium phagosomes. Macrophages were pretreated with siNTC or sip62, 20 nM, for 72 h, and then cells were infected for 4 h, fixed, and stained for Keap1. Untr, untreated. (Scale bars: A, 20 μm; C 10 μm.) Data shown are mean ± SEM (*P < 0.05, **P < 0.01, and ***P < 0.001, Student t test).
Fig. 2.
Fig. 2.
Keap1 down-regulates inflammatory cytokine expression during M. avium infection. (A and B) MDMs were transfected with 20 nM pooled siRNA against Keap1 (siKeap1) or siNTC. Keap1 knockdown was analyzed by qPCR or immunoblotting and normalized to GAPDH. (C) Effect of M. avium infection on cytokine mRNA expression after siNTC treatment (white bars) or Keap1 knockdown (black bars) was analyzed in MDMs 4 h after M. avium infection. (D) Keap1 effect on cytokine protein expression in response to M. avium infection as measured by ELISA in supernatants of cells harvested for mRNA analysis (white bars, siNTC-treated MDMs; black bars, siKEAP-treated MDMs). All fold induction values have been calculated relative to uninfected control cells treated with siNTC or siKEAP, respectively. All experiments were repeated n = 4–8 times from cells obtained from different blood donors, and data shown are the mean ± SEM (*P < 0.05 and **P < 0.01, Student t test; Fig. S1 and Table S1).
Fig. S1.
Fig. S1.
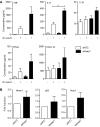
Keap1 knockdown increased Mycobacterium avium-induced cytokine production and transcription of Nrf2-driven cytoprotective genes. MDMs were pretreated with siKeap1 or siNTC. (A) M. avium infection for 4 h. TNF, IL-6, IL-1β, IFN-β, and CXCL10 protein levels were measured by ELISA in supernatants of cells harvested for mRNA analysis (Fig. 2). Results show absolute values of cytokines in uninfected and infected cells. (B) Heme oxygenase 1 (Hmox1), p62, and NAD(P)H dehydrogenase (quinone 1, Nqo1) transcripts in uninfected cells. Results are shown as fold induction. All experiments were repeated n = 4–8 times from cells obtained from different blood donors, and data shown are the mean ± SEM (*P< 0.05 and **P< 0.01, Student t test).
Fig. 3.
Fig. 3.
NF-κB, IRF1, and IRF5 show increased nuclear accumulation in macrophages upon M. avium infection during Keap1 knockdown. (A) MDMs were infected with M. avium for 1 h and 4 h, fixed, and stained for various transcription factors, and Alexa 546 (red) IgG was used as secondary antibody for imaging. Hoechst (blue) was used as a nuclear stain. Images are representative of three independent experiments. (B) Macrophages were siRNA-treated for 72 h and infected for 1 h. Cells were then fixed and stained for the different transcription factors. Quantification of translocation in bar charts represents observations from three independent experiments with two replicates in each, and data shown are the mean ± SEM (*P< 0.05, Student t test). (C) The effect of inhibition of inflammatory signaling by using IKKβ inhibitor VIII and the TBK1 inhibitor BX795 or MRT67307 on the translocation of NF-κB, IRF1, and IRF5. MDMs were pretreated for 30 min with 5 µM inhibitors, then infected for indicated time periods and assessed by immunostaining and Scan^R analysis. Duplicate samples were analyzed in five independent experiments. Inhibitor treatment significantly affected nuclear translocation of transcription factors. Data shown are the mean ± SEM (*P < 0.05, **P < 0.01, and ***P < 0.001, Student t test; Fig. S2).
Fig. S2.
Fig. S2.
Knockdown of NF-κB, IRF1, and IRF5 inhibited inflammatory cytokine expression during M. avium infection. MDMs were transfected with 20 nM pooled siRNA against the different transcription factors or siNTC. Knockdown was analyzed by qPCR and normalized to GAPDH. Fold effects on TNF and IFN-β mRNA expression after siRNA treatment 4 h after M. avium infection was calculated relative to uninfected controls. Data are shown for n = 2–9 independent experiments with different donors as the mean ± SEM (*P < 0.05).
Fig. 4.
Fig. 4.
Keap1 knockdown stabilizes the IKK complex and TBK1 protein levels. MDMs were transfected with siRNA and Keap1 siRNA knockdown levels analyzed by Western blotting compared with siNTC sample 30 min, 60 min, and 4 h after M. avium infection. Phosphorylated and total protein levels were examined with anti-phospho (p-) or anti-total (t-) antibodies at the same time points after infection. Cells were infected with M. avium 72 h after siRNA treatments, and blots from one representative experiment are shown. Quantification of protein in bar charts represent observations from n = 6–8 independent experiments normalized to GAPDH or COX4 using different blood donors. Data shown are the mean ± SEM (*P < 0.05, Student t test; Fig. S3).
Fig. S3.
Fig. S3.
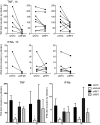
Keap1 knockdown showed no effect on IκB and IRF protein levels and IKKβ and TBK1 mRNA expression during M. avium infection. MDMs were transfected with siKeap1, and knockdown levels were analyzed by Western blotting compared with siNTC samples 30 min, 60 min, and 4 h after M. avium infection. (A) Phosphorylated and total protein levels were examined with anti-phospho (p-) or anti-total (t-) antibodies at the same time points after infection for IκB. (B) Protein levels for some members of the IRF family. (C) IKKβ and TBK1 mRNA expression was analyzed by qPCR 4 h after infection. All fold induction values have been calculated relative to uninfected controls. All experiments were repeated independently n = 4–6 times from cells obtained from different donors, and data shown are the mean ± SEM. P values obtained by Student t test were not significant.
Fig. 5.
Fig. 5.
The Keap1/Cul3-Rbx1 ubiquitin ligase complex regulates M. avium-induced cytokine responses through ubiquitination and degradation of IKKβ. MDMs were transfected with 20 nM pooled siRNA against Cul3, Rbx1, Nrf2, and p62 (siCul3, siRbx1, siNrf2, and sip62, respectively) or siNTC. Effect of knockdown on cytokine mRNA expression in siRNA-treated MDMs was analyzed 4 h after M. avium infection. As in Fig. 2, results are presented as fold induction in response to infection. (A) Effect of Cul3 and Rbx1 knockdown on infection-induced TNF and IFN-β mRNA expression. (B) Effect of Nrf2 (siNrf2) knockdown on TNF and p62 knockdown (sip62) on TNF mRNA expression in comparison with siNTC. Results represent at least two independent experiments with two replicates, and data shown are the mean ± SEM (*P < 0.05, Student t test). (C) The effect of Keap1 on ubiquitination of IKKs was analyzed by IP of IKKβ and subsequent staining for ubiquitination was performed after Keap1 knockdown and infection for 2 h. Cells were pretreated with or without 10 µM MG132, a proteasome inhibitor. A representative blot is shown, and bar charts are quantifications from four independent experiments. Data shown are the mean ± SEM (*P < 0.05 and **P < 0.01).
Fig. S4.
Fig. S4.
IKKβ but not TBK1 is ubiquitinated following M. avium infection of MDMs. (A) MDMs were transfected with siNTC, siCul3, or siRbx1. Knockdown levels of Cul3 and Rbx1 were analyzed by real-time PCR and are presented as fold induction relative to siNTC-treated controls. (B) MDMs were pretreated with 10 µM of the proteasome inhibitor MG132 before M. avium infection for 2 h. Ubiquitination of IKKs was analyzed by immunoprecipitations of IKKβ or TBK1 and subsequent staining for ubiquitin. A representative blot from one of two experiments is shown.
Fig. 6.
Fig. 6.
Keap1 knockdown restricts the growth of M. avium in MDMs. (A) Single siRNA duplexes against Keap1 and the pooled duplexes were transfected into MDMs before cells were infected with luciferase-expressing M. avium. Bacterial survival was quantified 4 h, 24 h, 48 h, and 72 h after infection by analyzing luciferase activity of bacteria as a measure of survival (RLU, relative luciferase unit). (B) The effect of inhibition of inflammatory signaling using IKKβ inhibitor VIII (2 µM), the TBK1 inhibitor MRT67307, and its inactive analog, MRT166 (both 1 µM). siRNA-treated cells were pretreated for 30 min with inhibitors and then infected for 4, 24, and 48 h. Triplicate groups were analyzed in three independent experiments. Differences between siNTC and siKeap1 were highly significant at P < 0.05 at 48 and 72 h after infection. Data shown are the mean ± SEM (Fig. S5).
Fig. S5.
Fig. S5.
The effect of Keap1 knockdown, ROS inhibitors, or addition of cytokines on intracellular growth of M. avium in MDMs. (A) MDMs were pretreated with siKeap1 or siNTC before infection with luciferase-expressing M. avium. Bacterial numbers were quantified over time by cfu counts. Bars represent data from two independent experiments with cfu counts analyzed in triplicate. Data shown are the mean ± SEM (*P < 0.05, Student t test). (B) MDMs were pretreated with recombinant TNF (500 ng/mL), IL-1β (100 ng/mL), or IFN-β (100 ng/mL) for 30 min before infection with luciferase-expressing M. avium. Cytokines were from R&D Systems. Bacterial growth was quantified by luciferase activity (RLU, relative luciferase units) over time. Data shown are the mean ± SEM (triplicate cell parallels each assayed in duplicate for luciferase activity) from two donors.

References

    1. Wagner D, Young LS. Nontuberculous mycobacterial infections: A clinical review. Infection. 2004;32(5):257–270. - PubMed
    1. Appelberg R. Pathogenesis of Mycobacterium avium infection: Typical responses to an atypical mycobacterium? Immunol Res. 2006;35(3):179–190. - PubMed
    1. Ernst JD. The immunological life cycle of tuberculosis. Nat Rev Immunol. 2012;12(8):581–591. - PubMed
    1. Halaas O, et al. Intracellular Mycobacterium avium intersect transferrin in the Rab11(+) recycling endocytic pathway and avoid lipocalin 2 trafficking to the lysosomal pathway. J Infect Dis. 2010;201(5):783–792. - PMC - PubMed
    1. Jo E-K. Mycobacterial interaction with innate receptors: TLRs, C-type lectins, and NLRs. CurrOpin Infect Dis. 2008;21(3):279–286. - PubMed

Publication types

MeSH terms

LinkOut - more resources