. 2015 Aug 4;112(31):9614-9.
doi: 10.1073/pnas.1512799112. Epub 2015 Jul 20.

Conformational propensities of intrinsically disordered proteins influence the mechanism of binding and folding

Affiliations

Conformational propensities of intrinsically disordered proteins influence the mechanism of binding and folding

Munehito Arai et al. Proc Natl Acad Sci U S A. .

Abstract

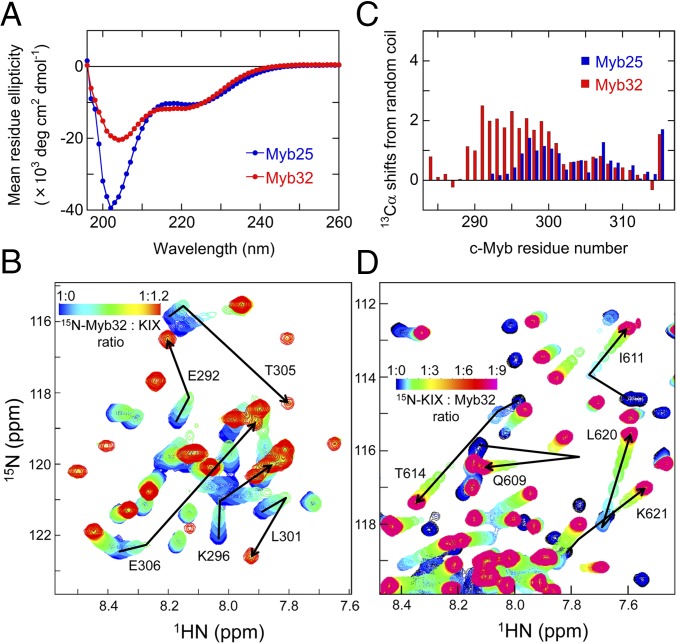
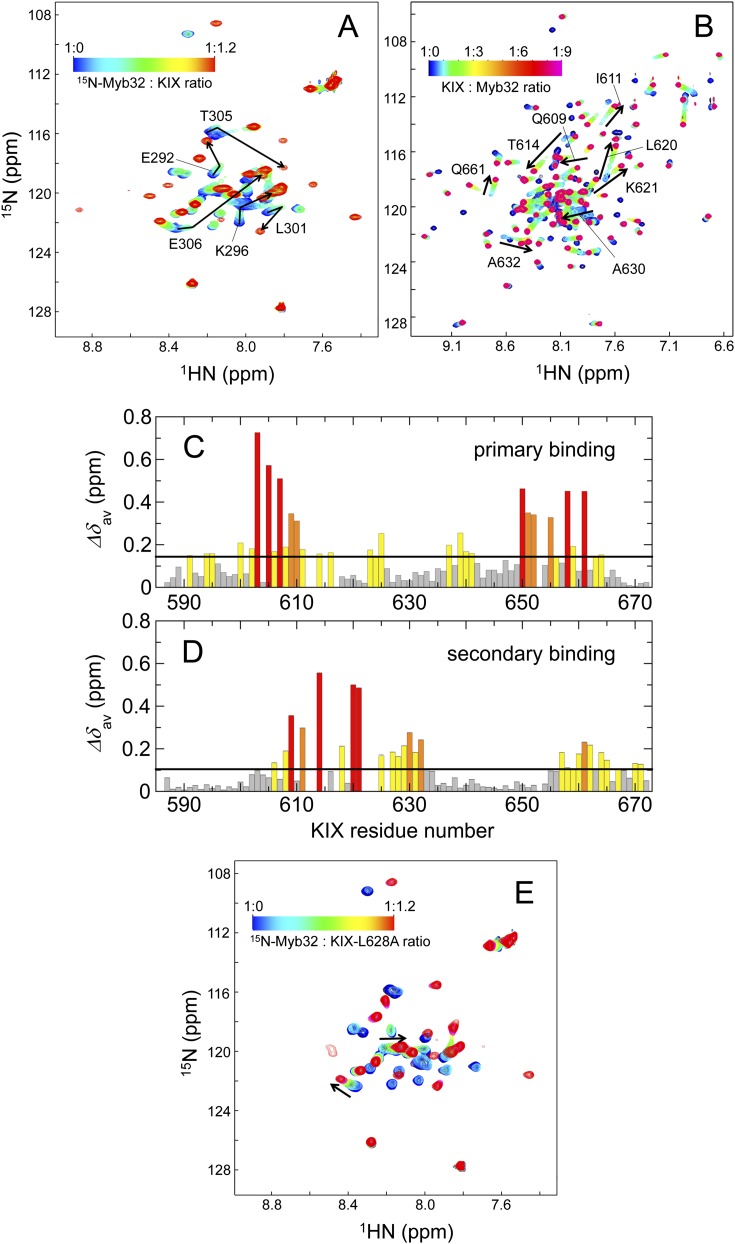
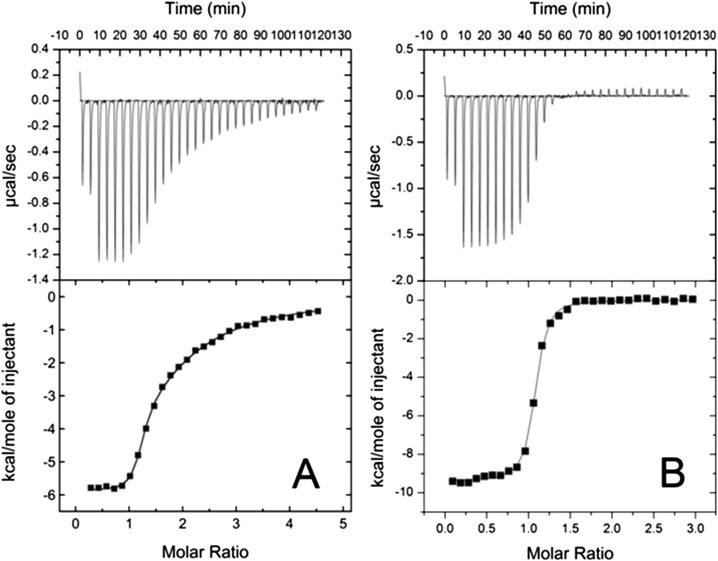
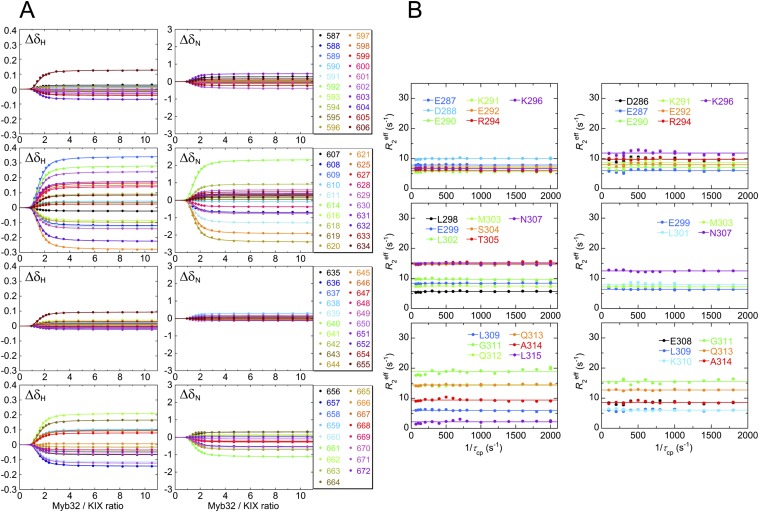
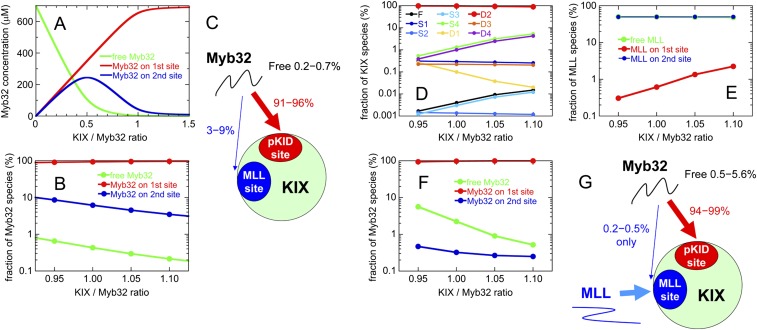
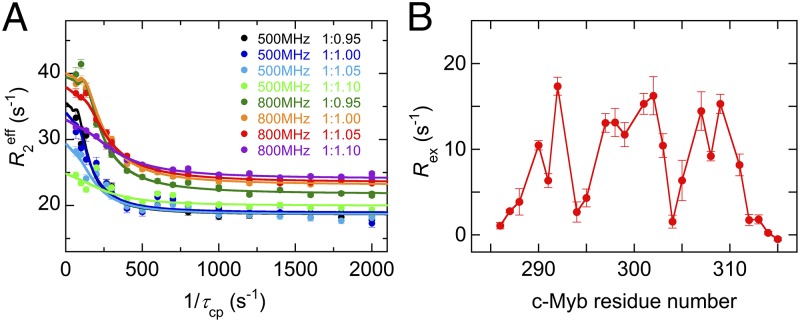
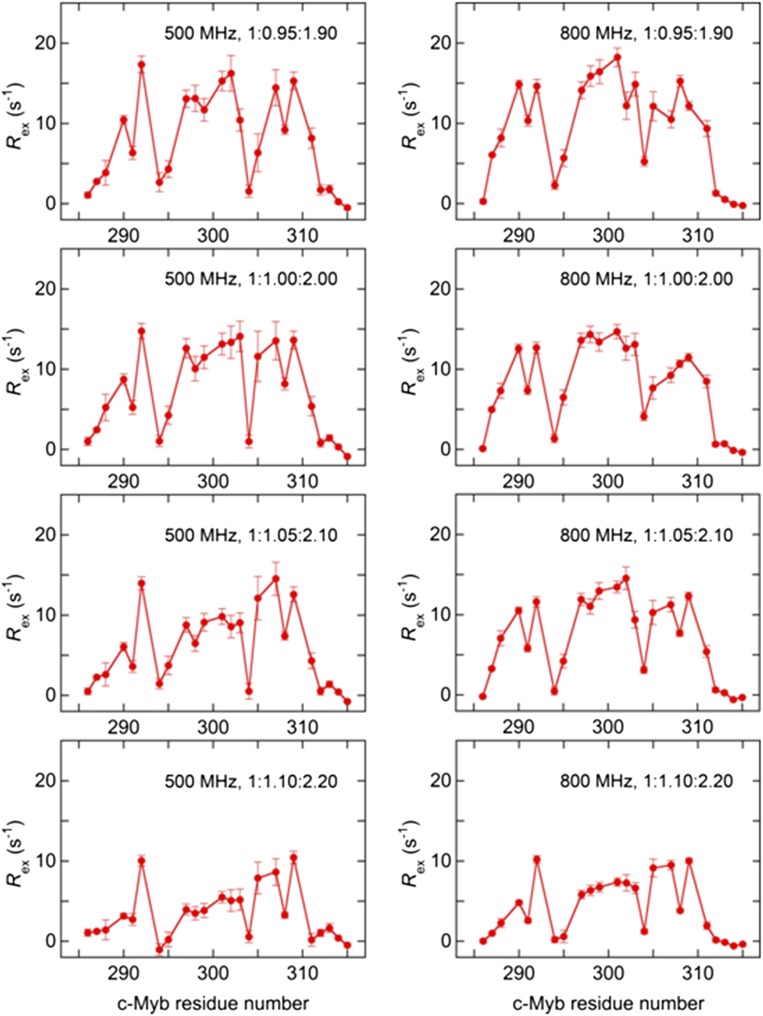
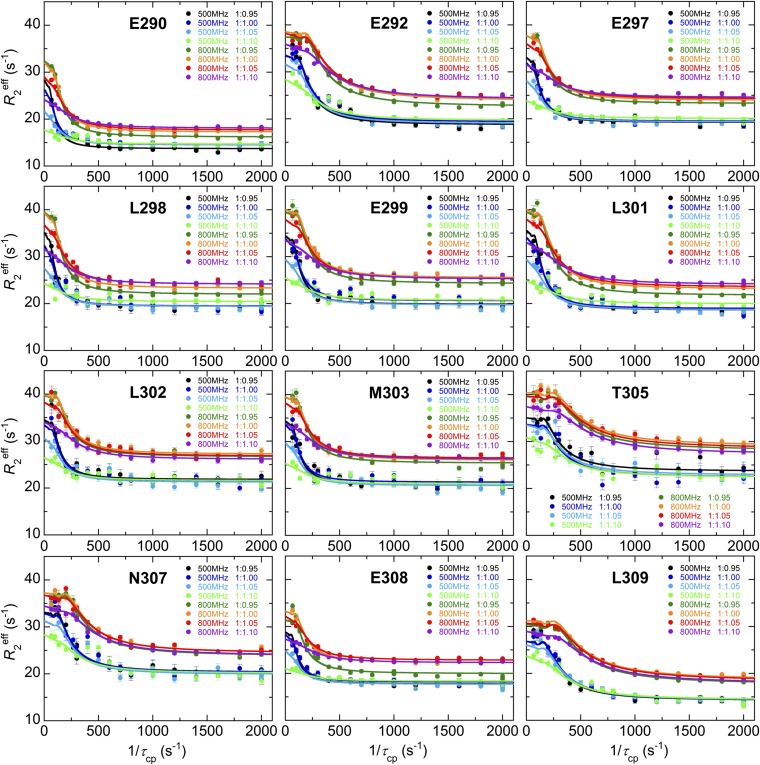
Intrinsically disordered proteins (IDPs) frequently function in protein interaction networks that regulate crucial cellular signaling pathways. Many IDPs undergo transitions from disordered conformational ensembles to folded structures upon binding to their cellular targets. Several possible binding mechanisms for coupled folding and binding have been identified: folding of the IDP after association with the target ("induced fit"), or binding of a prefolded state in the conformational ensemble of the IDP to the target protein ("conformational selection"), or some combination of these two extremes. The interaction of the intrinsically disordered phosphorylated kinase-inducible domain (pKID) of the cAMP-response element binding (CREB) protein with the KIX domain of a general transcriptional coactivator CREB-binding protein (CBP) provides an example of the induced-fit mechanism. Here we show by NMR relaxation dispersion experiments that a different intrinsically disordered ligand, the transactivation domain of the transcription factor c-Myb, interacts with KIX at the same site as pKID but via a different binding mechanism that involves elements of conformational selection and induced fit. In contrast to pKID, the c-Myb activation domain has a strong propensity for spontaneous helix formation in its N-terminal region, which binds to KIX in a predominantly folded conformation. The C-terminal region of c-Myb exhibits a much smaller helical propensity and likely folds via an induced-fit process after binding to KIX. We propose that the intrinsic secondary structure propensities of pKID and c-Myb determine their binding mechanisms, consistent with their functions as inducible and constitutive transcriptional activators.

Keywords: NMR relaxation; coupled folding and binding; intrinsically disordered protein; transcriptional activator c-Myb; transcriptional coactivator CBP.


Figures

Fig. 1.
Fig. 1.
Conformational propensities of free c-Myb. (A) Far-UV CD spectra of free Myb32 (red) and Myb25 (blue). (B) Portion of a series of 1H-15N HSQC spectra of 15N-labeled Myb32 showing chemical shift changes upon titration with KIX. The cross-peak color changes gradually from blue (free) to red (bound) according to the concentration ratios shown. The complete spectrum is shown in Fig. S1. (C) Secondary 13Cα chemical shifts of free Myb32 (red) and Myb25 (blue). (D) Portion of a series of 1H-15N HSQC spectra of 15N-labeled KIX showing chemical shift changes upon titration with Myb32. The cross-peak color changes gradually from black (free) to magenta (bound) according to the concentration ratios shown. The complete spectrum is shown in Fig. S1.
Fig. S1.
Fig. S1.
(A) 1H-15N HSQC spectra of 15N-labeled Myb32 showing chemical shift changes upon titration with KIX. Assignments are shown for residues showing fast-exchange shifts. The cross-peak color changes gradually from blue (free) to red (bound) according to the concentration ratios shown. (B) 1H-15N HSQC spectra of 15N-labeled KIX showing chemical shift changes upon titration with Myb32. The cross-peak color changes gradually from black (free) to magenta (bound) according to the concentration ratios shown. (C and D) Histograms of the averaged chemical shift differences Δδav for the primary (C) and secondary (D) binding of Myb32 to KIX. The black horizontal line shows the mean of all Δδav (0.144 ppm and 0.105 ppm for primary and secondary binding, respectively). The residues are categorized into the following groups: red, greater than or equal to mean + 2 × SD; orange, mean + 1 SD to mean + 2 SD; yellow, mean to mean + 1 SD; and gray, less than mean. (C) 1H and 15N chemical shifts of KIX for the c-Myb bound form at a 1:0.8 KIX:Myb32 ratio were subtracted from those of free KIX to get ΔδH and ΔδN. The data at a 1:0.8 ratio (rather than at 1:1) were used for primary binding to eliminate the effect of secondary c-Myb binding to KIX. (D) ΔδH and ΔδN obtained from the titration analysis (Fig. S3A) were used to calculate Δδav. The data at a 1:0.8 ratio were used as a reference. (E) 1H-15N HSQC spectra of 15N-labeled Myb32 showing chemical shift changes upon titration with the KIX-L628A mutant. The cross-peak color changes gradually from blue (free) to red (bound) according to the concentration ratios shown. Fast-exchange shifts are observed for some peaks in the titrations of small amounts of KIX, suggesting the presence of secondary c-Myb binding on KIX.
Fig. 2.
Fig. 2.
c-Myb:KIX interactions. (A and B) Primary (A) and secondary (B) c-Myb binding sites on KIX. The weighted average chemical shift differences between the free and bound KIX amide resonances are mapped onto the surface of KIX in the KIX:c-Myb:MLL ternary complex (Protein Data Bank ID 2AGH) (14). Changes in chemical shift greater than 2 × SD from the mean (red), between 1 SD and 2 SD from the mean (orange), and between mean and 1 SD from the mean (yellow) are indicated. c-Myb (residues 290–315) and MLL (residues 2,842–2,860) are shown in blue and green, respectively. (C) 15N-labeled Myb32 titration with KIX in the presence of a twofold excess of MLL28 over the KIX concentration. (D) 15N-labeled KIX titration with Myb32 in the presence of MLL28 in a twofold excess to KIX. The cross-peak color changes gradually from blue (free) to red (bound) in C and from black (free) to magenta (bound) in D according to the concentration ratios shown.
Fig. S2.
Fig. S2.
(A and B) ITC titration profiles (Upper) and binding isotherms (Lower) for the Myb32:KIX interactions in the absence (A) and the presence (B) of MLL28 [20 mM Tris-acetate (pH 7.0), 50 mM NaCl, 30 °C]. (A) 0.8 mM Myb32 was titrated into 45 μM KIX. Two titration curves from duplicate measurements were globally fitted assuming a two-site binding model. Thermodynamic parameters are Kd1 = 0.23 ± 0.06 μM, N1 = 1.1 ± 0.2, ΔG1 = –9.2 ± 0.2 kcal/mol, ΔH1 = –5 ± 1 kcal/mol, TΔS1 = –4 ± 1 kcal/mol, Kd2 = 43 ± 14 μM, N2 = 0.8 ± 0.2, ΔG2 = –6.1 ± 0.2 kcal/mol, ΔH2 = –7 ± 3 kcal/mol, TΔS2 = 1 ± 3 kcal/mol. A correction factor for the Myb32 concentration was 1.1 ± 0.2. (B) 0.6 mM Myb32 was titrated into 45 μM KIX in the presence of 90 μM MLL28. The titration curve was fitted to a one-site binding model. Thermodynamic parameters are Kd = 0.213 ± 0.008 μM, N = 1.04 ± 0.01, ΔG = –9.3 ± 0.2 kcal/mol, ΔH = –9.5 ± 0.1 kcal/mol, and TΔS = –0.3 ± 0.1 kcal/mol.
Fig. S3.
Fig. S3.
(A) Global fitting of the titration curves for the 15N-KIX titration with unlabeled Myb32, referenced to the shifts at a 1:0.8 KIX:Myb32 ratio (24). 1H (A, Left) and 15N (A, Right) chemical shift changes of HSQC cross-peaks of 15N-KIX are plotted as a function of the Myb32/KIX concentration ratio. Only the peaks showing clear fast-exchange shifts were used for fitting (154 curves for 77 assigned peaks). Color codes are shown (A, Right) along with the residue number. In the fitting, we assumed that Kd1 is 0.213 μM, which was obtained by the ITC experiment for the Myb32 binding to the primary site on KIX in the presence of excess MLL28 and that ΔδH and ΔδN in the primary binding site are zero (23). The global fitting gave a Kd2 of 46 ± 1 μM. A correction factor for the Myb32 concentration was 1.174 ± 0.002 (24). (B) 15N R2 relaxation dispersion curves for 15N-Myb32 in the free form (B, Left) and for 15N-Myb32 in the presence of twofold excess of MLL28 (B, Right) measured with an 800-MHz spectrometer at 0.7 mM Myb32. Color codes are shown in each panel along with the residue number.
Fig. S4.
Fig. S4.
(A) Concentrations of various Myb32 species dependent on a KIX:Myb32 concentration ratio from 0 to 1.5 at 0.7 mM Myb32. Red, Myb32 bound to the primary c-Myb binding site on KIX; blue, Myb32 bound to the secondary c-Myb binding site on KIX; and green, free Myb32. (B) Fractions of various Myb32 species under the conditions for R2 relaxation dispersion experiments (from 1:0.95 to 1:1.10 Myb32:KIX concentration ratios at 0.7 mM Myb32), plotted in a logarithmic scale. (C) The results show that 3–9% of Myb32 binds to the secondary, low-affinity site. See SI Text for details of the calculations. (D–F) Fractions of various KIX (D), MLL28 (E), and Myb32 (F) species under the conditions for R2 relaxation dispersion experiments plotted on a logarithmic scale (the KIX:Myb32:MLL28 concentration ratio = 1:0.95:1.90, 1:1.00:2.00, 1:1.05:2.10, and 1:1.10:2.20 at 0.7 mM Myb32). (D) The D2 form, in which Myb32 and MLL bind at the primary (c-Myb/pKID) and secondary (MLL) sites, respectively, is the most dominant form under these conditions. See SI Text for the definitions of various KIX forms. (E) Almost half of MLL28 binds to the MLL site, and the rest is mostly in the free form. Less than 2% of MLL28 binds to the primary site. Such a small amount of secondary MLL28 binding to KIX will not affect the Myb32 binding to the primary site on KIX. (F and G) More than 94% of Myb32 is bound to the primary site, 0.5–5.6% is in the free form, and only less than 0.5% is bound to the secondary site. Such a small fraction of secondary Myb32 binding to KIX will not be detected in the R2 relaxation dispersion experiments.
Fig. 3.
Fig. 3.
R2 relaxation dispersion experiments. (A) 15N R2 relaxation dispersion profile for L301 of Myb32 recorded at 500-MHz and 800-MHz spectrometers and at 1:0.95–1:1.10 Myb32:KIX concentration ratios in the presence a twofold excess of MLL28 over KIX. (B) 15N Rex of Myb32 at 500 MHz at a concentration ratio of 1:0.95:1.90 Myb32:KIX:MLL28. Rex was estimated from the differences in R2eff at the lowest and highest 1/τcp values. Errors were estimated from duplicate measurements (10).
Fig. S5.
Fig. S5.
15N Rex of Myb32 in the presence of KIX and MLL28 measured by the R2 relaxation dispersion experiments with 500-MHz (Left) and 800-MHz (Right) spectrometers. 15N-Myb32:KIX:MLL28 concentration ratios are shown in each panel. Rex was estimated from the difference in R2eff at the lowest and highest 1/τcp values.
Fig. S6.
Fig. S6.
15N R2 relaxation dispersion curves for 12 residues of 15N-Myb32 in complex with KIX and MLL28 used for global analysis. In each panel, the Myb32:KIX concentration ratios and the color codes are shown. The MLL28 concentration was twofold excess of the KIX concentration. Solid lines are the fits to the two-state binding model.
Fig. 4.
Fig. 4.
Representative mechanisms of coupled folding and binding reactions of IDPs. kON and kOFF are the association and dissociation rates for c-Myb binding to KIX; kIB and kBI are the rates for the folding and unfolding reactions of c-Myb on the surface of KIX; kUH and kHU are the folding and unfolding rates of free c-Myb; c-Myb* denotes c-Myb in disordered structures; and c-MybU and c-MybH denote free c-Myb in the unfolded and helical states, respectively.
Fig. 5.
Fig. 5.
Kinetic and structural parameters derived from relaxation dispersion experiments. (A and B) kON (A) and kOFF (B) for c-Myb residues, obtained by fitting to the two-state model. Large characters indicate the 12 residues used in global analysis of the dispersion curves. Error bars show fitting errors. (C) Correlation of 15N chemical shift differences (ΔωFB) for Myb32 determined by fitting the dispersion curves to the two-state model with equilibrium 15N chemical shift differences (ΔδFB) between free Myb32 and the KIX-bound form in the presence of MLL28. The linear regression line (slope = 1.01, y intercept = 0.02, correlation coefficient r = 0.97) is shown. (D) Correlation between the association rate for binding of c-Myb mutants to KIX [data taken from Giri et al. (27)] and the intrinsic population of helix between residues 293 and 303 in the mutant Myb25 peptides predicted by AGADIR (22). Full details are given in SI Text.
Fig. S7.
Fig. S7.
Correlation of 15N chemical shift differences of 15N-Myb32 determined from the R2 relaxation dispersion experiments (ΔωN) with equilibrium chemical shift differences of 15N-Myb32 between the free and KIX-bound forms in the presence of MLL28 determined from HSQC spectra (ΔδN). (A) The results obtained by the fits to the induced-fit mechanism (model 2). Fitted parameters are kON = (1.8 ± 0.1) × 107 M−1⋅s−1, kOFF = 15.5 ± 0.3 s−1, Kd = 0.81 ± 0.06 μM, kIB = 0.74 ± 0.09 s−1, kBI = 15.4 ± 0.4 s−1, and a correction factor for the Myb32 concentration = 1.072 ± 0.003. kIB < kBI, indicating that the population of c-Myb in the intermediate state (88%) is much higher than that in the fully bound state (4%), which is unreasonable. The ΔωN values between the free and bound forms obtained by R2 dispersion experiments (red) were significantly larger than ΔδN obtained from equilibrium HSQC. However, the ΔωN values between the free and intermediate forms (blue) were well correlated with ΔδN between the free and bound forms, which is inconsistent. Therefore, the fits to the induced-fit model are unreasonable. (B) The results obtained by the fits to the slow conformational selection mechanism (model 3a). Fitted parameters are kON = (2.1 ± 0.2) × 108 M−1⋅s−1, kOFF = 21.0 ± 0.6 s−1, Kd = 0.7 ± 0.1 μM, kHU = 12,000 ± 1,000 s−1, kUH = 1,900 ± 100 s−1, and a correction factor for the Myb32 concentration = 1.095 ± 0.004. The ΔωN values between the unfolded and helical forms obtained by fitting the R2 dispersion experiments (blue) were significantly larger than ΔδN between the free and bound forms obtained from equilibrium HSQC spectra, suggesting that the conformational ensemble of free c-Myb contains a state that is more highly structured than KIX-bound c-Myb. Therefore, the fits to the conformational selection model 3a are physically unrealistic.
Fig. S8.
Fig. S8.
(A and B) Helicities of the TADs of c-Myb (A) and pKID (B) predicted by AGADIR (22) at 303 K and 288 K, respectively. (C and D) Deviations of 13Cα (red) and 13C′ (blue) chemical shifts from sequence-corrected (19) random coil shifts for intrinsically disordered proteins (20), applied to Myb32 (C, chemical shifts at 303 K) and pKID (D, chemical shifts at 288 K) (9). The predicted population of helix between residues 290 and 301 of Myb32 (66%) is in close agreement with experiment (70%, estimated from 13Cα and 13C′ shifts). For pKID, the population of helix between residues 117 and 129 (spanning helix αA of pKID bound to KIX) (6) estimated from the secondary chemical shifts is 46%. Residues 133–144 (helix αB of bound pKID) have no measurable propensity to adopt regular helical structure in the free pKID.

References

    1. Wright PE, Dyson HJ. Intrinsically unstructured proteins: Re-assessing the protein structure-function paradigm. J Mol Biol. 1999;293(2):321–331. - PubMed
    1. Dunker AK, et al. Intrinsically disordered protein. J Mol Graph Model. 2001;19(1):26–59. - PubMed
    1. Uversky VN. Natively unfolded proteins: A point where biology waits for physics. Protein Sci. 2002;11(4):739–756. - PMC - PubMed
    1. Dyson HJ, Wright PE. Intrinsically unstructured proteins and their functions. Nat Rev Mol Cell Biol. 2005;6(3):197–208. - PubMed
    1. Wright PE, Dyson HJ. Linking folding and binding. Curr Opin Struct Biol. 2009;19(1):31–38. - PMC - PubMed

Publication types

Substances

LinkOut - more resources