. 2015 Sep 1;195(5):2273-2281.
doi: 10.4049/jimmunol.1500803. Epub 2015 Jul 20.

Restoration of CD4+ Responses to Copathogens in HIV-Infected Individuals on Antiretroviral Therapy Is Dependent on T Cell Memory Phenotype

Affiliations

Restoration of CD4+ Responses to Copathogens in HIV-Infected Individuals on Antiretroviral Therapy Is Dependent on T Cell Memory Phenotype

Catherine Riou et al. J Immunol. .

Abstract

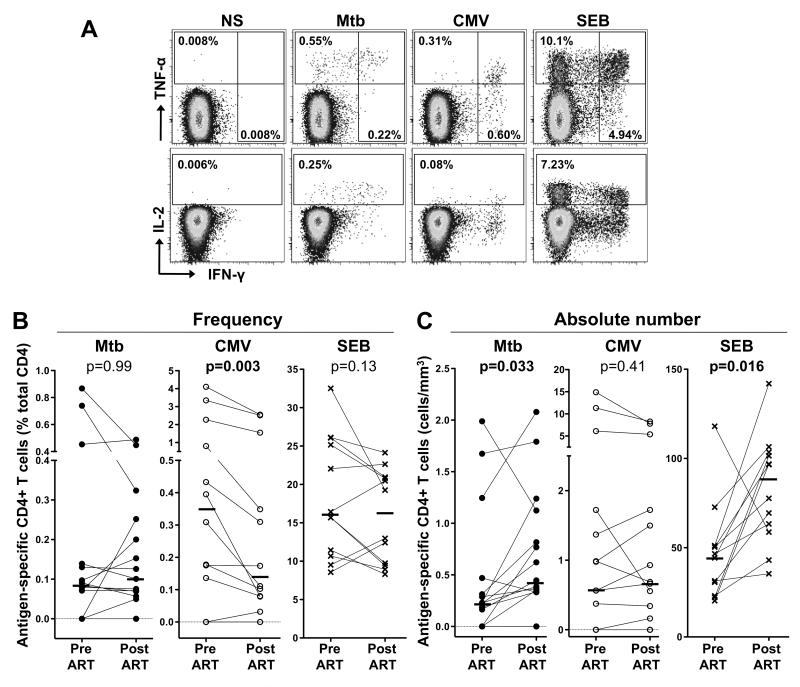
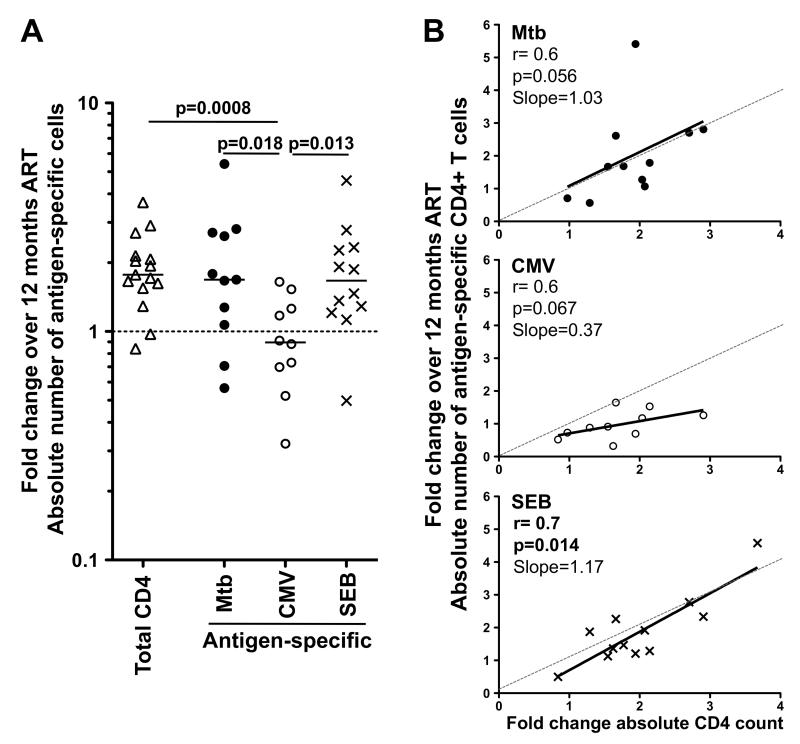
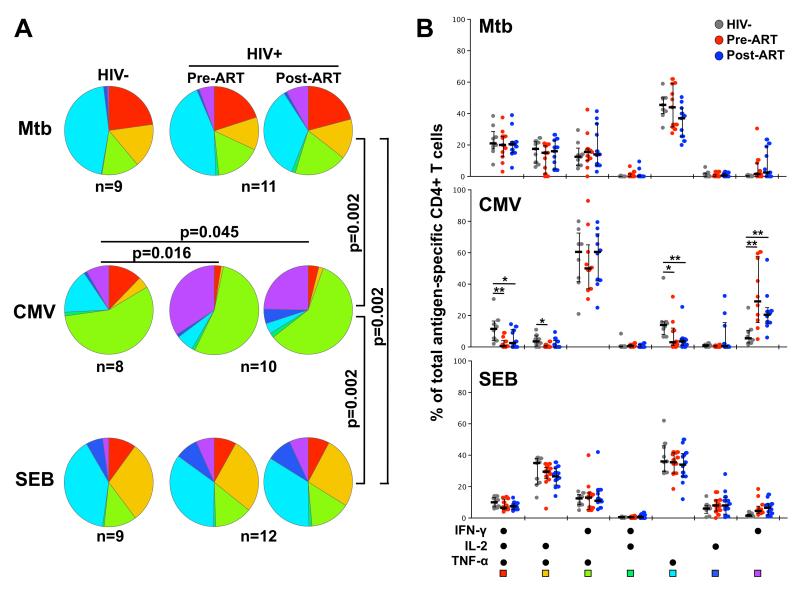
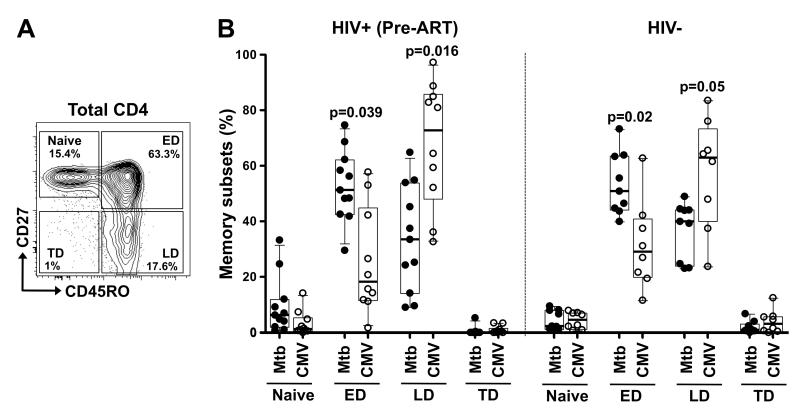
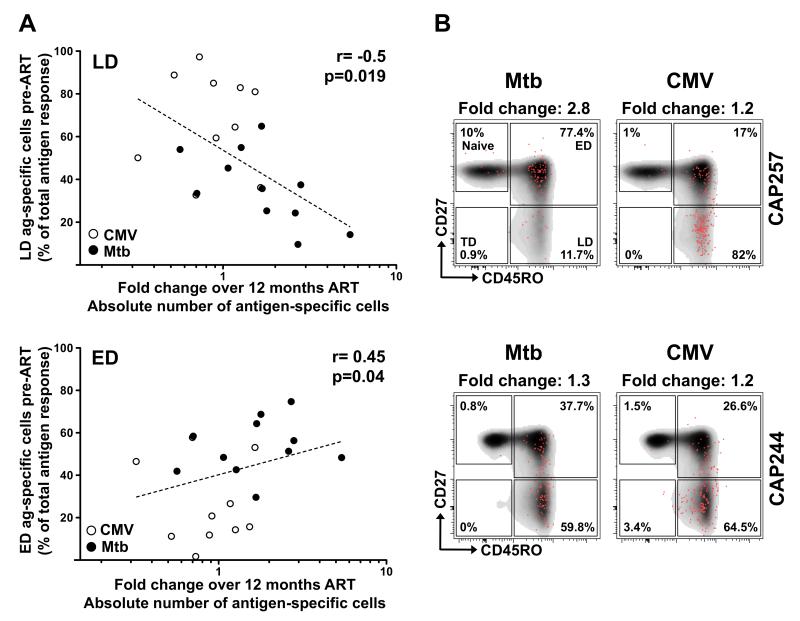
Antiretroviral therapy (ART) induces rapid suppression of viral replication and a progressive replenishment of CD4(+) T cells in HIV-infected individuals. However, the effect of ART on restoring pre-existing memory CD4(+) T cells specific for common copathogens is still unclear. To better understand the dynamics of Ag-specific CD4(+) T cells during ART, we assessed the frequency, functional capacity, and memory profile of CD4(+) T cells specific for Mycobacterium tuberculosis and CMV in 15 HIV-infected individuals before and 1 y after ART initiation. After ART initiation, the frequency of M. tuberculosis-specific CD4(+) T cells showed little change, whereas CMV-specific CD4(+) T cells were significantly lower (p = 0.003). There was no difference in the polyfunctional or memory profile of Ag-specific CD4(+) T cells before and after ART. The replenishment of Ag-specific CD4(+) T cells correlated with the memory differentiation profile of these cells prior to ART. Pathogen-specific CD4(+) T cells exhibiting a late differentiated profile (CD45RO(+)CD27(-)) had a lower capacity to replenish (p = 0.019; r = -0.5) compared with cells with an early differentiated profile (CD45RO(+)CD27(+); p = 0.04; r = 0.45). In conclusion, restoration of copathogen-specific memory CD4(+) T cells during treated HIV infection is related to their memory phenotype, in which early differentiated cells (such as most M. tuberculosis-specific cells) have a higher replenishment capacity compared with late differentiated cells (such as most CMV-specific cells). These data identify an important, hitherto unrecognized, factor that may limit restoration of copathogen immunity in HIV-infected individuals on ART.


Figures

FIGURE 1
FIGURE 1. Effect of ART on Mtb-, CMV- and SEB-specific CD4+ T cell responses
(A) Representative flow cytometry plots of the expression of TNF-α, IFN-γ and IL-2 from CD4+ T cells after stimulation with Mtb and CMV antigens and SEB, in one study participant. NS corresponds to unstimulated PBMC. The frequency of cytokine-producing cells expressed as a percentage of the total CD4+ T cell population are indicated. Frequency (B) and absolute number (C) of Mtb-, CMV- and SEB-specific CD4+ T cell responses before and after ART. Horizontal bars represent the median. Statistical comparisons were performed using a Wilcoxon matched pairs test.
FIGURE 2
FIGURE 2. Restoration dynamics of Mtb-, CMV- and SEB-specific CD4+ T cells after ART
(A) Fold change in the total, Mtb-, CMV- and SEB-specific absolute CD4+ T cell count over 12 months of ART. The horizontal dotted line indicates no change from the baseline pre-ART time point. Statistical comparisons were performed using a non-parametric Mann-Whitney test. (B) Association between the fold change of the absolute number of antigen-specific CD4+ T cells and the fold change in the absolute CD4 count pre- and post-ART. Statistical associations were performed by a two-tailed non-parametric Spearman rank correlation. The solid line represents a linear regression fit, and the dashed line depicts the ideal slope of 1.
FIGURE 3
FIGURE 3. Polyfunctional capacity of Mtb-, CMV- and SEB-specific CD4+ T cells in HIV-infected and uninfected individuals pre- and post-ART
Pie charts (A) and graphs (B) representing the cytokine secretion ability of Mtb-, CMV- and SEB-specific CD4+ T cell responses in HIV-uninfected individuals (n=9) and HIV-infected individuals pre-and post-ART initiation. Each section of the pie chart represents a specific combination of cytokines, as indicated by the color at the bottom of the graph. Horizontal bars depict the median with interquartile range indicated. Statistical comparisons were performed using a Wilcoxon rank-sum test. *p < 0.05, **p < 0.01, ***p < 0.001.
FIGURE 4
FIGURE 4. Memory profiles of Mtb- and CMV-specific CD4+ T cells in HIV-infected and uninfected individuals
(A) Representative example of total CD4 memory subset distribution in one HIV-infected individual. Naïve: CD45RO−CD27+, Early Differentiated (ED: CD45RO+CD27+), Late Differentiated (LD: CD45RO+CD27−) and Terminally Differentiated (TD: CD45RO-CD27−). The frequencies of each subset are indicated. (B) Memory profile of Mtb- and CMV-specific CD4+ T cells in HIV-infected individuals pre-ART (left panel) and HIV-uninfected individuals (right panel). Results are shown as box and whisker (10-90 percentile) plots. Each dot depicts an individual and the horizontal bar is the median. Statistical comparisons were performed using a one-way ANOVA non-parametric Kruskal-Wallis test. *p < 0.05, **p < 0.01, ***p < 0.001.
FIGURE 5
FIGURE 5. Relationship between the memory profile of Mtb- and CMV-specific CD4+ T cells and the dynamics of restoration of these cells
(A) Association between the proportion of antigen-specific CD4+ T cells exhibiting a late differentiated (LD; top panel) or early differentiated (ED; bottom panel) profile with the fold change in antigen-specific CD4+ T cell absolute count after ART. Statistical associations were performed by a two-tailed non-parametric Spearman rank correlation. (B) Representative examples of the memory profile of Mtb- or CMV-specific CD4+ T cells pre-ART in two individuals. The frequencies of each subset are indicated. For each example, the fold change in antigen-specific absolute CD4+ T cell count pre-and post-ART is indicated at the top of each plot.

References

    1. Moir S, Chun TW, Fauci AS. Pathogenic mechanisms of HIV disease. Annual review of pathology. 2011;6:223–248. - PubMed
    1. Okoye AA, Picker LJ. CD4(+) T-cell depletion in HIV infection: mechanisms of immunological failure. Immunological reviews. 2013;254:54–64. - PMC - PubMed
    1. Doitsh G, Galloway NL, Geng X, Yang Z, Monroe KM, Zepeda O, Hunt PW, Hatano H, Sowinski S, Munoz-Arias I, Greene WC. Cell death by pyroptosis drives CD4 T-cell depletion in HIV-1 infection. Nature. 2014;505:509–514. - PMC - PubMed
    1. Shearer GM, Clerici M. Early T-helper cell defects in HIV infection. AIDS. 1991;5:245–253. - PubMed
    1. Luciano AA, Lederman MM, Valentin-Torres A, Bazdar DA, Sieg SF. Impaired Induction of CD27 and CD28 Predicts Naive CD4 T Cell Proliferation Defects in HIV Disease. The Journal of Immunology. 2007;179:3543–3549. - PubMed

Publication types

MeSH terms

Substances