. 2015 Jul 21:4:e07728.
doi: 10.7554/eLife.07728.

The active-zone protein Munc13 controls the use-dependence of presynaptic voltage-gated calcium channels

Affiliations

The active-zone protein Munc13 controls the use-dependence of presynaptic voltage-gated calcium channels

Nathaniel Calloway et al. Elife. .

Abstract

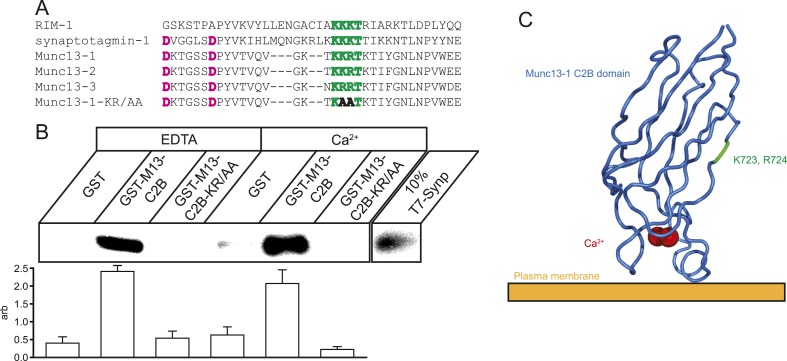
Presynaptic calcium channel function is critical for converting electrical information into chemical communication but the molecules in the active zone that sculpt this function are poorly understood. We show that Munc13, an active-zone protein essential for exocytosis, also controls presynaptic voltage-gated calcium channel (VGCC) function dictating their behavior during various forms of activity. We demonstrate that in vitro Munc13 interacts with voltage-VGCCs via a pair of basic residues in Munc13's C2B domain. We show that elimination of this interaction by either removal of Munc13 or replacement of Munc13 with a Munc13 C2B mutant alters synaptic VGCC's response to and recovery from high-frequency action potential bursts and alters calcium influx from single action potential stimuli. These studies illustrate a novel form of synaptic modulation and show that Munc13 is poised to profoundly impact information transfer at nerve terminals by controlling both vesicle priming and the trigger for exocytosis.

Keywords: Munc13; calcium channels; neuroscience; plasticity; rat.


Conflict of interest statement

The authors declare that no competing interests exist.

Figures

Figure 1.
Figure 1.. Munc13 C2B domain interacts with CaV2.2 synprint.
(A) Alignment of C2 domains from RIM1, synaptotagmin-1, Munc13 isoforms 1, 2, and 3, and Munc13-KR/AA showing the synprint binding polybasic sequence (green), Ca2+-interacting residues (pink), and the two mutated residues in Munc13-KR/AA to prevent synprint binding (bold). (B) Top, representative pull-down of T7-tagged CaV2.2 Synprint region by Glutathione–sepharose bound GST or GST-Munc13-1-C2B fusions in the presence of 1 mM EDTA or 1 mM Ca2+. Bottom, quantification of N = 4 independent pull-down experiments normalized to average blot intensity. Results are mean ± SEM. p < 10−6 for grouping by genotype, p = n.s. for the presence of Ca2+ or genotype–Ca2+ interaction. (C) Cartoon illustrating the relative position and orientation of the synprint binding site and the residues mutated in Munc13-KR/AA with respect to the plasma membrane and Ca2+ binding site. PDB structure 3KWU. DOI: http://dx.doi.org/10.7554/eLife.07728.003
Figure 2.
Figure 2.. Munc13-KD reduces Ca2+ influx at the presynaptic terminal.
(A) Average single AP vG-pHluorin response in wild-type (WT) (black, N = 5) and Munc13-KD (red, N = 5) neurons. (B) Example traces of Ca2+ influx detected by Fluo5F fluorescence in response to a single AP in WT (black) and Munc13-KD (red) neurons. (C) Averages of peak Fluo5F Ca2+ measurements ±SEM. N = 10, 13 respectively. **p < 0.01. (D) Averages of peak ARCH voltage measurements normalized to WT. N = 5, 7 respectively. Results are mean ± SEM. p = n.s. (E) Averages of FWHM from ARCH AP measurements for WT and Munc13 KD normalized to WT. Results are mean ± SEM. N = 5, 7 respectively. p = n.s. (F) Example image of VAMP2-mCherry + Munc13-KD synaptic terminals (red) labeled with Alexa488 anti-CaV2.1 (green). Scale bar 5 µM. (G) Frequency histogram of Cav2.1 staining intensities at VAMP-mCherry-positive Munc13-KD boutons (red) compared to Cav2.1 puncta in non-transfected neurons in the same field of view (N = 56 and 46 boutons for KD and WT respectively from three separate coverslips) showed that ablation of Munc13 does not alter the abundance of Cav2.1 (p = 0.39, 2 tailed t-test). DOI: http://dx.doi.org/10.7554/eLife.07728.004
Figure 3.
Figure 3.. Munc13-KD prolongs VGCC inactivation on long-time scales.
(A) Example of Ca2+ reactivation assay for WT and Munc13-KD neurons showing the difference in single AP responses before and after a 100 Hz 50 AP train showing that WT but not Munc13-KD cells have fully recovered from inactivation 500 ms after the end of the train. Inset shows AP following train on expanded time scale for more clarity. (B) Average inactivation of Ca2+ influx for WT and Munc13-KD neurons from the reactivation assay shown in A. Results are mean ± SEM. **p < 0.01. DOI: http://dx.doi.org/10.7554/eLife.07728.005
Figure 4.
Figure 4.. Munc13-KD increases VGCC reactivation on a very short time scale.
(A, B, E, F) Example traces of Ca2+ responses to one AP (black) and two APs separated by 2 ms for wild-type (WT) boutons (A), TeNT-LC expressing boutons (B), Munc13-KD boutons (E), and WT soma (F). (C) Average membrane AP waveform measured using ARCH at WT boutons for single and double AP (2 ms ISI) at 30°C (left) and 37°C (right) indicating AP failure for the second AP at the lower temperature but successful firing and propagation of both APs at physiological temperature. Arch recordings from Munc13-KD boutons also show successful firing of the second AP. (D) ARCH amplitude ratios of second AP peak with respect to first AP peak for WT at 30°C (left), WT at 37°C (middle) and Munc13-KD at 37°C (right). Open symbols show the mean ± SEM value for N = 4, WT 30°C; N = 7, WT 37°C, N = 7 Munc13 KD 37°C. (G) Average Ca2+ signal peak height in 2 ms paired pulses ISI normalized to the respective Ca2+ signal peak in response to 1AP. (H) Average Ca2+ signal peak calculated for the second AP during paired pulses of various ISI for WT (black) and Munc13-KD (red) cells normalized to Ca2+ signal peak in response to 1 AP. Results are mean ± SEM. *p < 0.05, **p < 0.01, ***p < 0.001, all other comparisons n.s. DOI: http://dx.doi.org/10.7554/eLife.07728.007
Figure 5.
Figure 5.. Millisecond refractory period controlled by Munc13 is insensitive to extracellular Ca2+.
(A) Example traces of wild-type (WT) neurons stimulated with 1 AP and 2 AP with a 2 ms ISI at 2.0, 1.2, and 0.6 mM extracellular Ca2+. Values are normalized to 1 AP for the three extracellular Ca2+ conditions. (B) Relative Ca2+ influx in response to 1 AP upon reduced extracellular Ca2+ as a fraction of influx in 2 mM Ca2+. N = 5 each. *p < 0.05, **p < 0.01. Results are mean ± SEM. (C) 2 ms ISI Ca2+ influx normalized to 1 AP for the three extracellular Ca2+ conditions. No significant difference between conditions of the same genotype. N = 5 each. *p < 0.05, **p < 0.01. Results are mean ± SEM. DOI: http://dx.doi.org/10.7554/eLife.07728.008
Figure 6.
Figure 6.. Munc13-1 but not Munc13-KR/AA rescues the Ca2+ influx phenotypes associated with Munc13-KD.
(A) Example traces of Ca2+ influx detected by Fluo5F fluorescence in response to a single AP in Munc13-1 (black) and Munc13-KR/AA (red) expressing neurons in a Munc13-KD background. (B, C) Example traces of one AP (black) and two APs separated by 2 ms for Munc13-1 (B) and Munc13-KR/AA (C) expressing boutons in a Munc13-KD background. (DF) Average values for Ca2+ influx (D), reactivation at 2 ms ISI (E), and residual inactivation (F), in Munc13-KD + Munc13-1 and Munc13-KD + Munc 13-KR/AA cells, as in Figures 3, 4. Results are mean ± SEM. *p < 0.05, **p < 0.01, ***p < 0.001, all other comparisons n.s. DOI: http://dx.doi.org/10.7554/eLife.07728.009
Figure 7.
Figure 7.. Munc13-KR/AA rescues synaptic vesicle exocytosis and reveals the effect of fast reactivation on exocytosis.
(AC) Average traces synaptic vesicle exocytosis detected by vGlut1-pHluorin in response to single APs (black) and two APs separated by 2 ms (red) for wild-type (WT) in 2 mM external Ca2+ (A), 1.2 mM external Ca2+ (B), Munc13-KD + Munc13-1 (C), and Munc13-KD + Munc13-KR/AA. Dashed line shows the response amplitude of the single AP for comparison (D). Increased exocytosis with two APs in Munc13-KD + Munc13-KR/AA cells indicates that the trends in Ca2+ influx have a demonstrable effect on exocytosis, and that the Munc13 interaction with VGCC affects neural processing on this time scale. Exocytosis for a single AP is depressed in Munc13-KD + Munc13-KR/AA terminal by 38% compared to WT rescue, consistent with reduced Ca2+ influx in these cells. (E) Average values for fast reactivation at 2 ms ISI for the cell types in AC. Results are mean ± SEM. **p < 0.01, ***p < 0.001, all other comparisons n.s. DOI: http://dx.doi.org/10.7554/eLife.07728.010

Similar articles

Cited by

References

    1. Ariel P, Hoppa MB, Ryan TA. Intrinsic variability in PV, RRP size, Ca2+ channel repertoire, and presynaptic potentiation in individual synaptic boutons. Frontiers in Synaptic Neuroscience. 2013;4:9. doi: 10.3389/fnsyn.2012.00009. - DOI - PMC - PubMed
    1. Ariel P, Ryan TA. Optical mapping of release properties in synapses. Frontiers in Neural Circuits. 2010;4:18. doi: 10.3389/fncir.2010.00018. - DOI - PMC - PubMed
    1. Augustin I, Rosenmund C, Sudhof TC, Brose N. Munc13-1 is essential for fusion competence of glutamatergic synaptic vesicles. Nature. 1999;400:457–461. doi: 10.1038/22768. - DOI - PubMed
    1. Bai J, Tucker WC, Chapman ER. PIP2 increases the speed of response of synaptotagmin and steers its membrane-penetration activity toward the plasma membrane. Nature Structural & Molecular Biology. 2004;11:36–44. doi: 10.1038/nsmb709. - DOI - PubMed
    1. Brody DL, Yue DT. Release-independent short-term synaptic depression in cultured hippocampal neurons. The Journal of Neuroscience. 2000;20:2480–2494. - PMC - PubMed

Publication types