. 2015 Jul 21;10(7):e0132253.
doi: 10.1371/journal.pone.0132253. eCollection 2015.

Nested PCR Biases in Interpreting Microbial Community Structure in 16S rRNA Gene Sequence Datasets

Affiliations

Nested PCR Biases in Interpreting Microbial Community Structure in 16S rRNA Gene Sequence Datasets

Guoqin Yu et al. PLoS One. .

Abstract

Background: Sequencing of the PCR-amplified 16S rRNA gene has become a common approach to microbial community investigations in the fields of human health and environmental sciences. This approach, however, is difficult when the amount of DNA is too low to be amplified by standard PCR. Nested PCR can be employed as it can amplify samples with DNA concentration several-fold lower than standard PCR. However, potential biases with nested PCRs that could affect measurement of community structure have received little attention.

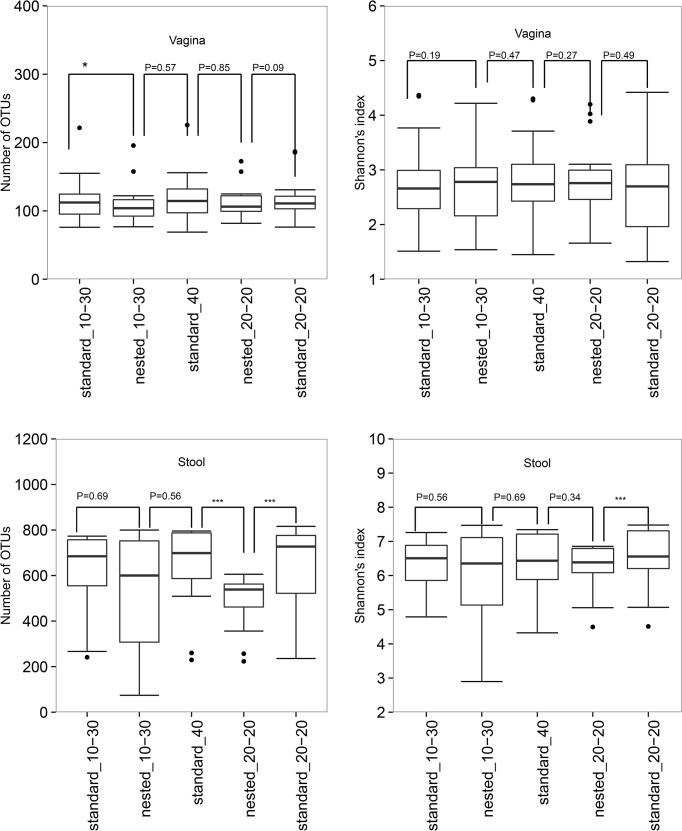
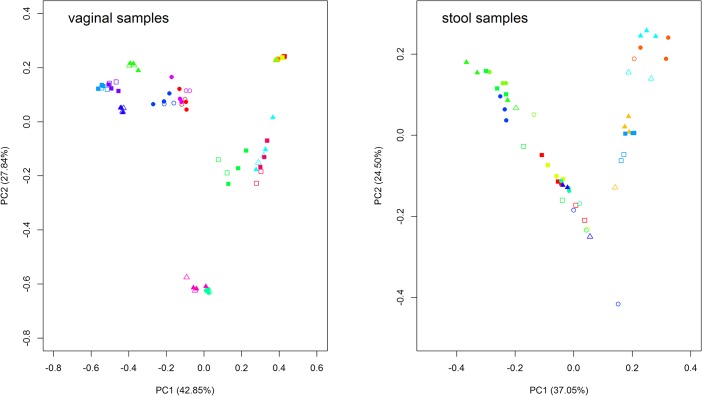
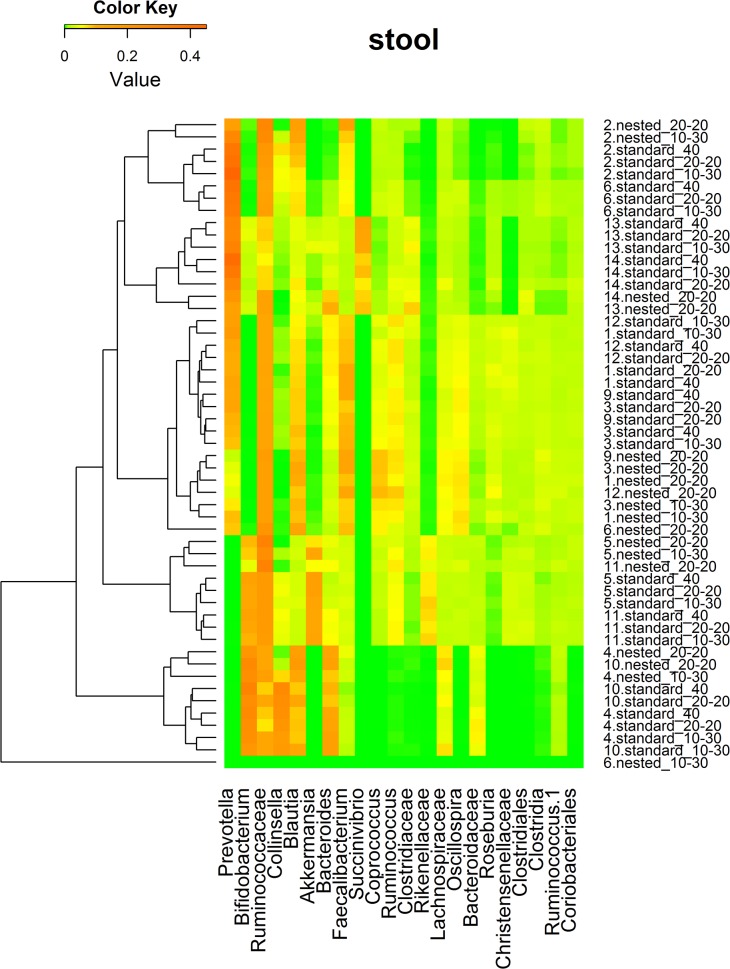
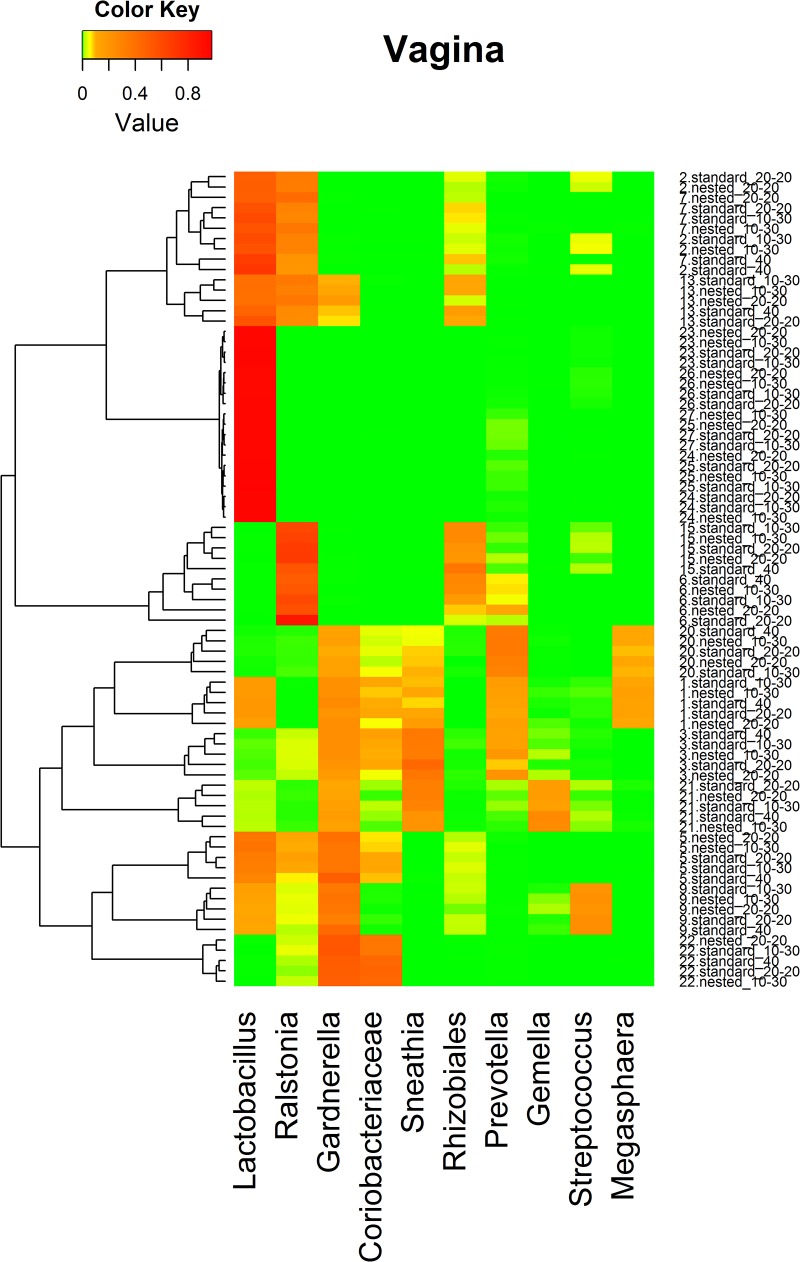
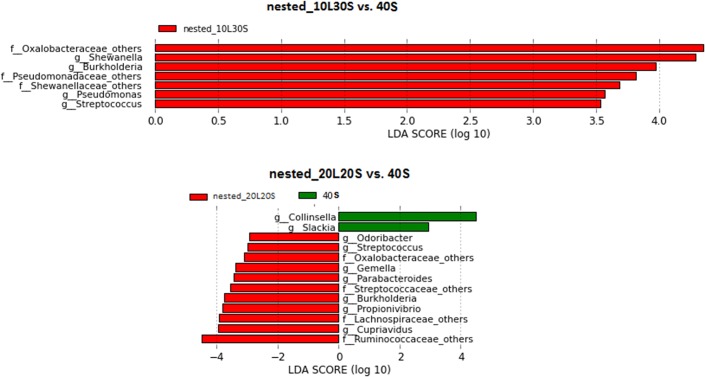
Results: In this study, we used 17 DNAs extracted from vaginal swabs and 12 DNAs extracted from stool samples to study the influence of nested PCR amplification of the 16S rRNA gene on the estimation of microbial community structure using Illumina MiSeq sequencing. Nested and standard PCR methods were compared on alpha- and beta-diversity metrics and relative abundances of bacterial genera. The effects of number of cycles in the first round of PCR (10 vs. 20) and microbial diversity (relatively low in vagina vs. high in stool) were also investigated. Vaginal swab samples showed no significant difference in alpha diversity or community structure between nested PCR and standard PCR (one round of 40 cycles). Stool samples showed significant differences in alpha diversity (except Shannon's index) and relative abundance of 13 genera between nested PCR with 20 cycles in the first round and standard PCR (P<0.01), but not between nested PCR with 10 cycles in the first round and standard PCR. Operational taxonomic units (OTUs) that had low relative abundance (sum of relative abundance <0.167) accounted for most of the distortion (>27% of total OTUs in stool).

Conclusions: Nested PCR introduced bias in estimated diversity and community structure. The bias was more significant for communities with relatively higher diversity and when more cycles were applied in the first round of PCR. We conclude that nested PCR could be used when standard PCR does not work. However, rare taxa detected by nested PCR should be validated by other technologies.


Conflict of interest statement

Competing Interests: The authors have declared that no competing interests exist.

Figures

Fig 1
Fig 1. Box plots comparing nested to standard PCRs in number of OTUs and Shannon’s index.
Note, *P<0.05, **P<0.01, ***P<0.001, the P values were calculated by the Wilcoxon Matched-Pairs Signed Ranks test.
Fig 2
Fig 2. Principal coordinates analysis (PCoA) of weighted UniFrac distance.
Proportion of variance explained by each axis is denoted in the corresponding axis labels. Each symbol (designated by the combination of color and shape) represents each subject with the open symbols for the nested PCRs and the closed symbols for the standard PCRs. For example, the blue circles represent subject 1 with open blue ones for two nested PCR results and closed blue ones for three standard PCR results.
Fig 3
Fig 3. Clusters of stool samples based on bacterial genus relative abundance.
Heatmaps were based on the hierarchical clustering solution (Bray-Curtis) distance metric and average clustering method. Row represents different sample ID (The number before the period is the subject ID; The text after the period is the PCR method used.). Columns represent the predominant bacterial genera with mean relative abundance of 0.01 or greater. The colors in the heatmaps represent the relative abundance of each genus, as indicated in the upper left corner of each panel.
Fig 4
Fig 4. Clusters of vagina samples based on bacterial genus relative abundance.
Heatmaps were based on the hierarchical clustering solution (Bray-Curtis) distance metric and average clustering method. Row represents different sample ID (The number before the period is the subject ID; The text after the period is the PCR method used.). Columns represent the predominant bacterial genera with mean relative abundance of 0.01 or greater. The colors in the heatmaps represent the relative abundance of each genus, as indicated in the upper left corner of each panel.
Fig 5
Fig 5. Histogram of the LDA scores computed for microbial genera differentially abundant between nested and standard PCRs in stool samples.
The taxa shown in red are the ones with significantly higher abundance by nested PCRs while the taxa shown in green are the ones with significantly higher abundance by standard PCR. The g or f before the taxon name means genus or family.

References

    1. Kau AL, Ahern PP, Griffin NW, Goodman AL, Gordon JI (2011) Human nutrition, the gut microbiome and the immune system. Nature 474: 327–336. 10.1038/nature10213 - DOI - PMC - PubMed
    1. Zarco MF, Vess TJ, Ginsburg GS (2012) The oral microbiome in health and disease and the potential impact on personalized dental medicine. Oral Dis 18: 109–120. 10.1111/j.1601-0825.2011.01851.x - DOI - PubMed
    1. Stearns JC, Lynch MD, Senadheera DB, Tenenbaum HC, Goldberg MB, Cvitkovitch DG, et al. (2011) Bacterial biogeography of the human digestive tract. Sci Rep 1: 170 10.1038/srep00170 - DOI - PMC - PubMed
    1. Coldham T, Rose K, O'Rourke J, Neilan BA, Dalton H, Lee A, et al. (2013) Detection of Helicobacter species in the gastrointestinal tract of ringtail possum and koala: Possible influence of diet, on the gut microbiota. Vet Microbiol 166: 429–437. 10.1016/j.vetmic.2013.06.026 - DOI - PubMed
    1. Delgado S, Cabrera-Rubio R, Mira A, Suarez A, Mayo B (2013) Microbiological Survey of the Human Gastric Ecosystem Using Culturing and Pyrosequencing Methods. Microb Ecol 65: 763–772. 10.1007/s00248-013-0192-5 - DOI - PubMed

Publication types

Substances