. 2015 Sep 3;525(7567):104-8.
doi: 10.1038/nature14895. Epub 2015 Jul 21.

Genetic evidence for two founding populations of the Americas

Affiliations

Genetic evidence for two founding populations of the Americas

Pontus Skoglund et al. Nature. .

Abstract

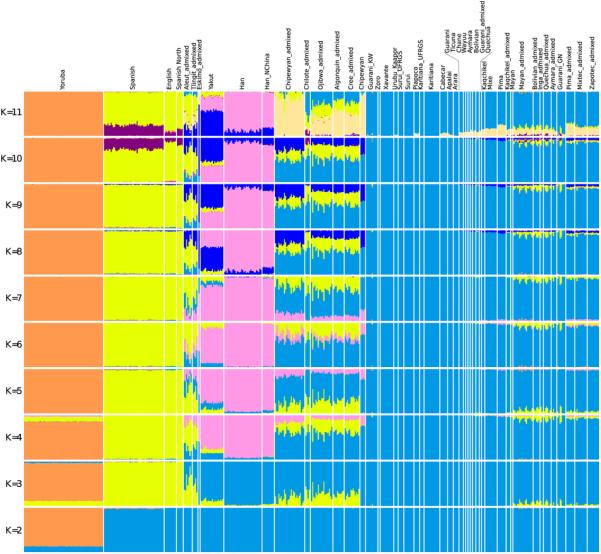
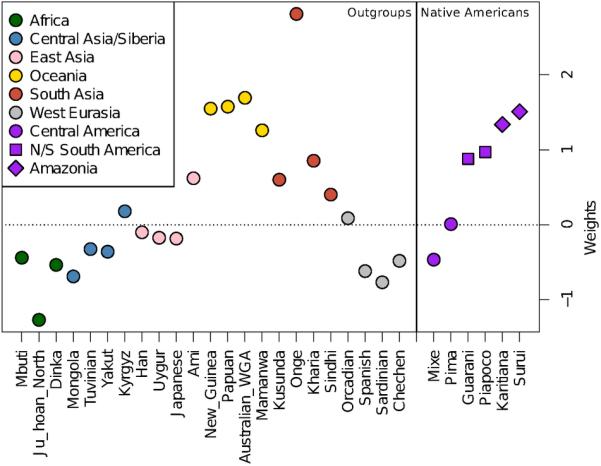
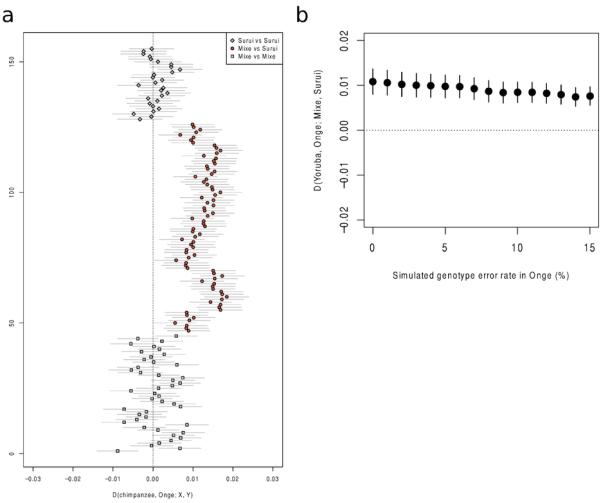
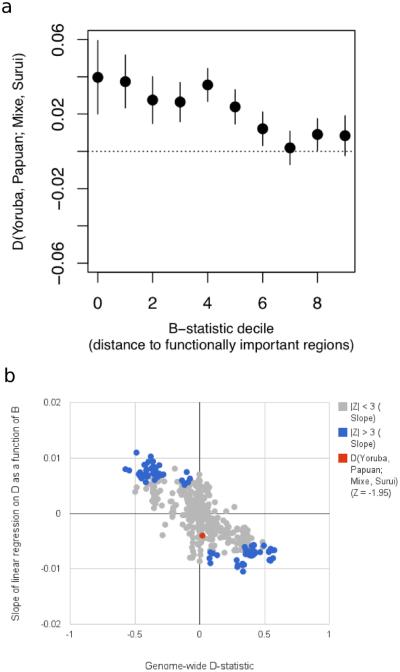
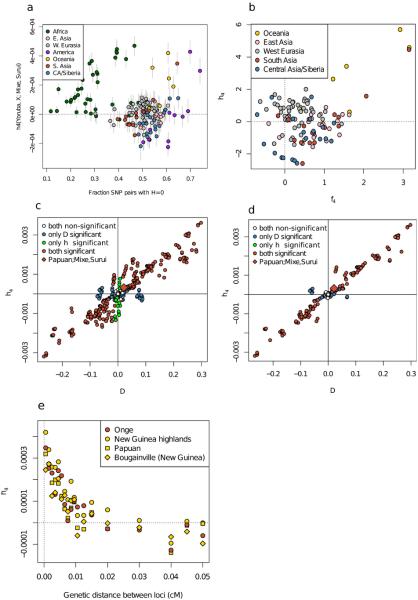
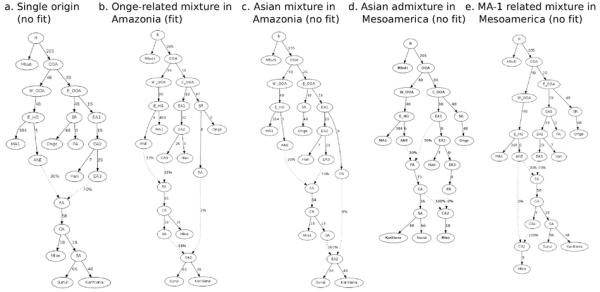
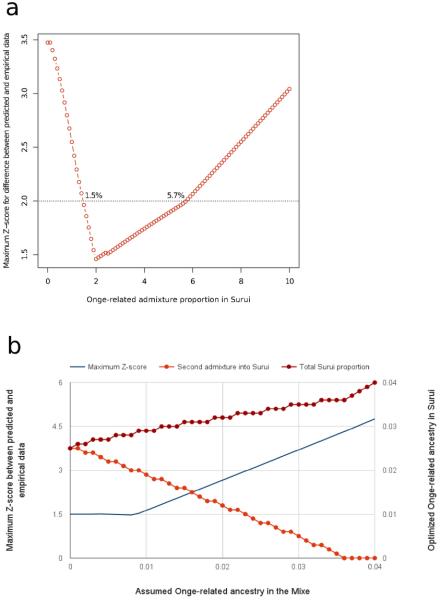
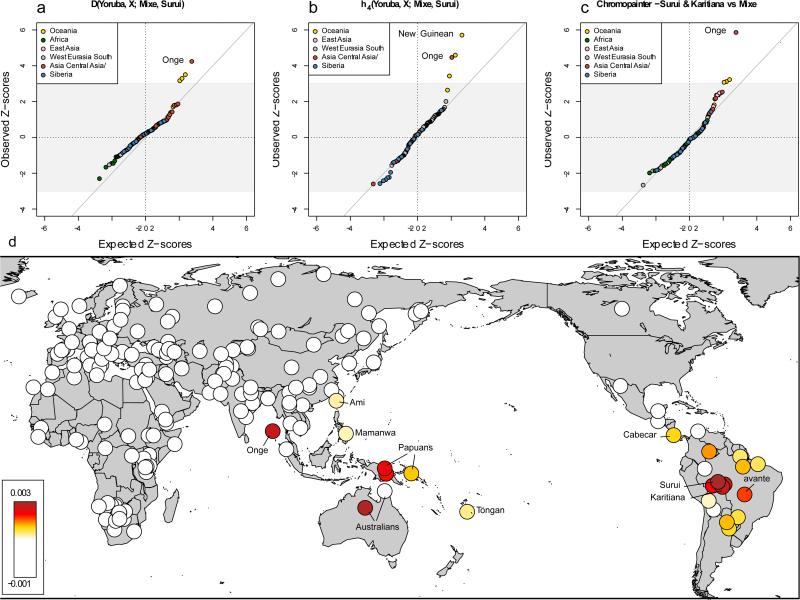
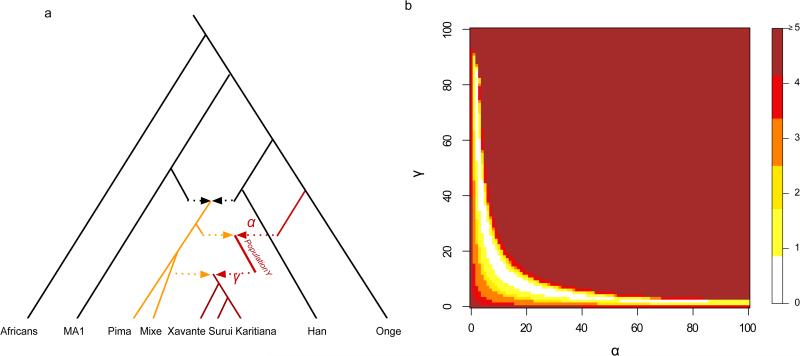
Genetic studies have consistently indicated a single common origin of Native American groups from Central and South America. However, some morphological studies have suggested a more complex picture, whereby the northeast Asian affinities of present-day Native Americans contrast with a distinctive morphology seen in some of the earliest American skeletons, which share traits with present-day Australasians (indigenous groups in Australia, Melanesia, and island Southeast Asia). Here we analyse genome-wide data to show that some Amazonian Native Americans descend partly from a Native American founding population that carried ancestry more closely related to indigenous Australians, New Guineans and Andaman Islanders than to any present-day Eurasians or Native Americans. This signature is not present to the same extent, or at all, in present-day Northern and Central Americans or in a ∼12,600-year-old Clovis-associated genome, suggesting a more diverse set of founding populations of the Americas than previously accepted.


Figures

Extended Data Figure 1
ADMIXTURE clustering analysis performed on the Affymetrix Human Origins data used in this study.
Extended Data Figure 2
Weights from qpWave for Native Americans and non-American outgroups. No weights are given for Yoruba and Cabecar, as they are used in the computation.
Extended Data Figure 3
A) Tests for excess shared derived alleles with the Onge in all possible comparisons of 8 Suruí and 10 Mixe individuals. All Mixe-Suruí comparisons show a positive skew whereas all Mixe-Mixe and Suruí-Suruí comparisons are consistent with 0. Lines correspond to 1 standard error in either direction. B) Random sequence or genotype errors cannot explain the affinity of the Amazonians to Australasians, since simulated increased errors in the Onge do not cause an increased affinity to Suruí.
Extended Data Figure 4
Signals of admixture as a function of proximity to functional regions. A) The affinity of 16 Papuan high-coverage genomes to 2 Amazonian Suruí high-coverage genomes as a function of proximity to regions of functional importance (measured by B-value). B) 395 tests of quartets D(Yoruba, X; Y, Z) shows that quartets with significantly positive slopes (|Z| > 3) also yield significant genome-wide D-statistics of the opposite sign. This suggests that signals of admixture are systematically stronger close to functionally important regions.
Extended Data Figure 5
A) h4(Yoruba, X; Mixe, Suruí) for SNP pairs within 0.01cM of each other contrasted with the fraction of SNP pairs in linkage equilibrium in population X (H = 0). Bars give ±1 standard error. B) Scatterplot of Z-scores for the f4- and h4-statistics for the same quartets. For both these panels we only use populations with at least 6 samples. C) and D) We computed D(Yoruba, X; Y, Z) and h4(Yoruba, X; Y, Z) for many combinations of populations as X, Y and Z using phased Affymetrix Human Origins SNP array data ascertained in a Yoruba individual. Except for Africans who have ancestry from lineages that diverged before the Yoruba used for ascertainment and Oceanians (who have archaic Denisovan ancestry) we observe that |Z|>3 h4-statistics are always associated with a significantly positive D for the same quartet. E) Correlation of the h4-statistic with the genetic distance separation of pairs of SNPs for h4(Yoruba, X; Mixe, Suruí).
Extended Data Figure 6
Admixture Graphs (AGs) for fitted population history models. A) An AG where all of Mixe, Suruí, and Karitiana are of 100% First American ancestry is rejected with 6 predicted f-statistics at least 3 SEs from the empirically observed value. B) An AG where the ancestors of Suruí and Karitiana receive 2% ancestry from a lineage related to the Onge is consistent with the data with no outliers. C) An AG where the distinct ancestry in Amazonians is more closely related to Han than to Onge produces 6 outliers. D) An AG with no distinctive ancestry in Karitiana or Suruí but East Asian gene flow into the Mixe produces 7 outliers. E) An AG with no distinctive ancestry in Karitiana or Suruí but MA1-related gene flow into the Mixe produces 6 outliers.
Extended Data Figure 7
Plausible range for the non-First American admixture proportion in Amazonians. A) Range obtained assuming entirely First American ancestry in the Mixe. B) The maximum proportion of non-First American ancestry in the Mixe that is consistent with the data.
Figure 1
Figure 1. South Americans share ancestry with Oceanian populations that is not seen in Mesoamericans or North Americans
a) Quantile-quantile plot of the Z-scores for the D-statistic symmetry test for whether Mixe and Suruí share an equal rate of derived alleles with a candidate non-American population X, compared to the expected ranked quantiles for the same number of normally distributed values. b) Z-scores for the h4-statistic. c) Z-scores for the CHROMOPAINTER statistic. D) heatmap of CHROMOPAINTER statistics. For non-Americans we display the symmetry statistic S(non-American; Mixe, Suruí & Karitiana) for donating as many haplotypes to Mixe as to Suruí & Karitiana. For the Americas we plot S(Onge; Mixe, American) for receiving as many haplotypes from the Onge as do the Mixe.
Figure 2
Figure 2
A model of population history that can explain the excess affinity to Oceanians observed in Amazonian populations. We fit an admixture graph model illustrated in a) where a population related to the Andamanese Onge contributed a fraction α of the ancestry of ‘Population Y’, which later contributed a fraction γ to the ancestry of Amazonian groups today (the remainder of which is related to Mesoamerican Mixe). B) two-dimensional grid of combinations of the admixture proportions α and γ which are compatible with the data in the sense of how many predicted f4-statistics deviate by Z ≥3.0 from empirical values. The cross represents the parameter combination fitted heuristically using ADMIXTUREGRAPH.

Similar articles

Cited by

References

    1. Wang S, et al. Genetic Variation and Population Structure in Native Americans. PLoS Genet. 2007;3:e185. doi:10.1371/journal.pgen.0030185. - PMC - PubMed
    1. Reich D, et al. Reconstructing Native American population history. Nature. 2012;488:370–374. - PMC - PubMed
    1. Rasmussen M, et al. The genome of a Late Pleistocene human from a Clovis burial site in western Montana. Nature. 2014;506:225–229. doi:10.1038/nature13025. - PMC - PubMed
    1. Raghavan M, et al. Upper Palaeolithic Siberian genome reveals dual ancestry of Native Americans. Nature advance online publication. 2013 doi:10.1038/nature12736. - PMC - PubMed
    1. Neves W, Pucciarelli H. American Journal of Physical Anthropology. WILEY-LISS DIV JOHN WILEY & SONS INC; 605 THIRD AVE, NEW YORK, NY 10158-0012: pp. 274–274.

Publication types