

Immortalisation with hTERT Impacts on Sulphated Glycosaminoglycan Secretion and Immunophenotype in a Variable and Cell Specific Manner
- PMID: 26196672
- PMCID: PMC4510558
- DOI: 10.1371/journal.pone.0133745
Immortalisation with hTERT Impacts on Sulphated Glycosaminoglycan Secretion and Immunophenotype in a Variable and Cell Specific Manner
Abstract
Background: Limited options for the treatment of cartilage damage have driven the development of tissue engineered or cell therapy alternatives reliant on ex vivo cell expansion. The study of chondrogenesis in primary cells is difficult due to progressive cellular aging and senescence. Immortalisation via the reintroduction of the catalytic component of telomerase, hTERT, could allow repeated, longitudinal studies to be performed while bypassing senescent phenotypes.
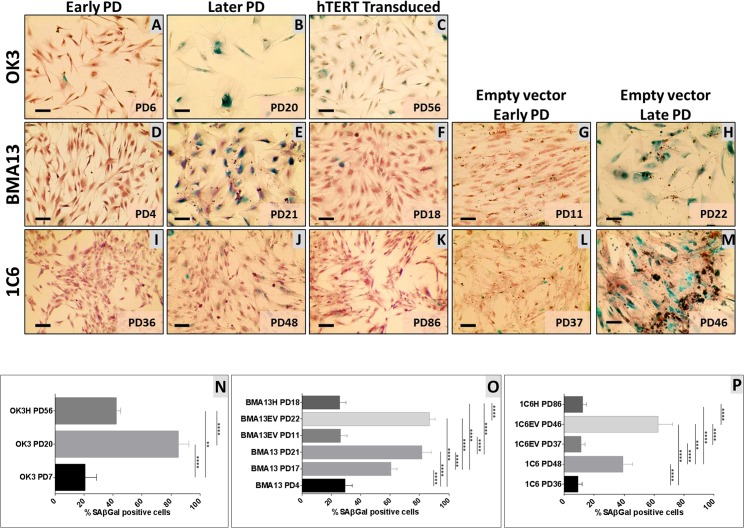
Methods: Three human cell types: bone marrow-derived stromal cells (BMA13), embryonic stem cell-derived (1C6) and chondrocytes (OK3) were transduced with hTERT (BMA13H, 1C6H and OK3H) and proliferation, surface marker expression and tri-lineage differentiation capacity determined. The sulphated glycosaminoglycan (sGAG) content of the monolayer and spent media was quantified in maintenance media (MM) and pro-chondrogenic media (PChM) and normalised to DNA.
Results: hTERT expression was confirmed in transduced cells with proliferation enhancement in 1C6H and OK3H cells but not BMA13H. All cells were negative for leukocyte markers (CD19, CD34, CD45) and CD73 positive. CD14 was expressed at low levels on OK3 and OK3H and HLA-DR on BMA13 (84.8%). CD90 was high for BMA13 (84.9%) and OK3 (97.3%) and moderate for 1C6 (56.7%), expression was reduced in BMA13H (33.7%) and 1C6H (1.6%). CD105 levels varied (BMA13 87.7%, 1C6 8.2%, OK3 43.3%) and underwent reduction in OK3H (25.1%). 1C6 and BMA13 demonstrated osteogenic and adipogenic differentiation but mineralised matrix and lipid accumulation appeared reduced post hTERT transduction. Chondrogenic differentiation resulted in increased monolayer-associated sGAG in all primary cells and 1C6H (p<0.001), and BMA13H (p<0.05). In contrast OK3H demonstrated reduced monolayer-associated sGAG in PChM (p<0.001). Media-associated sGAG accounted for ≥55% (PChM-1C6) and ≥74% (MM-1C6H).
Conclusion: In conclusion, hTERT transduction could, but did not always, prevent senescence and cell phenotype, including differentiation potential, was affected in a variable manner. As such, these cells are not a direct substitute for primary cells in cartilage regeneration research.
Conflict of interest statement
Figures


Similar articles
-
Ectopic Telomerase Expression Fails to Maintain Chondrogenic Capacity in Three-Dimensional Cultures of Clinically Relevant Cell Types.Biores Open Access. 2018 Feb 1;7(1):10-24. doi: 10.1089/biores.2018.0008. eCollection 2018. Biores Open Access. 2018. PMID: 29588876 Free PMC article.
-
hTERT transcription is repressed by Cbfa1 in human mesenchymal stem cell populations.J Bone Miner Res. 2007 Jun;22(6):897-906. doi: 10.1359/jbmr.070308. J Bone Miner Res. 2007. PMID: 17352650
-
Differentiation of synovial CD-105(+) human mesenchymal stem cells into chondrocyte-like cells through spheroid formation.J Cell Biochem. 2009 Sep 1;108(1):145-55. doi: 10.1002/jcb.22238. J Cell Biochem. 2009. PMID: 19544399
-
Enhanced chondrogenic differentiation of human bone marrow-derived mesenchymal stem cells in low oxygen environment micropellet cultures.Cell Transplant. 2010;19(1):29-42. doi: 10.3727/096368909X478560. Epub 2009 Oct 29. Cell Transplant. 2010. PMID: 19878627
-
Adipose-derived mesenchymal stromal (stem) cells differentiate to osteoblast and chondroblast lineages upon incubation with conditioned media from dental pulp stem cell-derived osteoblasts and auricle cartilage chondrocytes.J Biol Regul Homeost Agents. 2016 Jan-Mar;30(1):111-22. J Biol Regul Homeost Agents. 2016. PMID: 27049081
Cited by
-
Generation of Mesenchymal Cell Lines Derived from Aged Donors.Int J Mol Sci. 2021 Oct 1;22(19):10667. doi: 10.3390/ijms221910667. Int J Mol Sci. 2021. PMID: 34639008 Free PMC article.
-
Molecular Phenotyping of Telomerized Human Bone Marrow Skeletal Stem Cells Reveals a Genetic Program of Enhanced Proliferation and Maintenance of Differentiation Responses.JBMR Plus. 2018 May 24;2(5):257-267. doi: 10.1002/jbm4.10050. eCollection 2018 Sep. JBMR Plus. 2018. PMID: 30283907 Free PMC article.
-
Meta-analysis of the Mesenchymal Stem Cells Immortalization Protocols: A Guideline for Regenerative Medicine.Curr Stem Cell Res Ther. 2024;19(7):1009-1020. doi: 10.2174/011574888X268464231016070900. Curr Stem Cell Res Ther. 2024. PMID: 38221663
-
Immortalizing Mesenchymal Stromal Cells from Aged Donors While Keeping Their Essential Features.Stem Cells Int. 2020 Jun 16;2020:5726947. doi: 10.1155/2020/5726947. eCollection 2020. Stem Cells Int. 2020. PMID: 32612662 Free PMC article.
-
Generation of human immortalized chondrocytes from osteoarthritic and healthy cartilage : a new tool for cartilage pathophysiology studies.Bone Joint Res. 2023 Jan;12(1):46-57. doi: 10.1302/2046-3758.121.BJR-2022-0207.R1. Bone Joint Res. 2023. PMID: 36647698 Free PMC article.
References
-
- Find data—Health & Social Care Information Centre [Internet]. Available: http://www.hscic.gov.uk/searchcatalogue?productid=13264&q=title%3a%22Hos.... Accessed 2015 Jan 4
Publication types
MeSH terms
Substances
LinkOut - more resources
Full Text Sources
Other Literature Sources
Research Materials
Miscellaneous
