. 2015 Jul 21;11(7):e1005373.
doi: 10.1371/journal.pgen.1005373. eCollection 2015 Jul.

Large-Scale Phenomics Identifies Primary and Fine-Tuning Roles for CRKs in Responses Related to Oxidative Stress

Affiliations

Large-Scale Phenomics Identifies Primary and Fine-Tuning Roles for CRKs in Responses Related to Oxidative Stress

Gildas Bourdais et al. PLoS Genet. .

Abstract

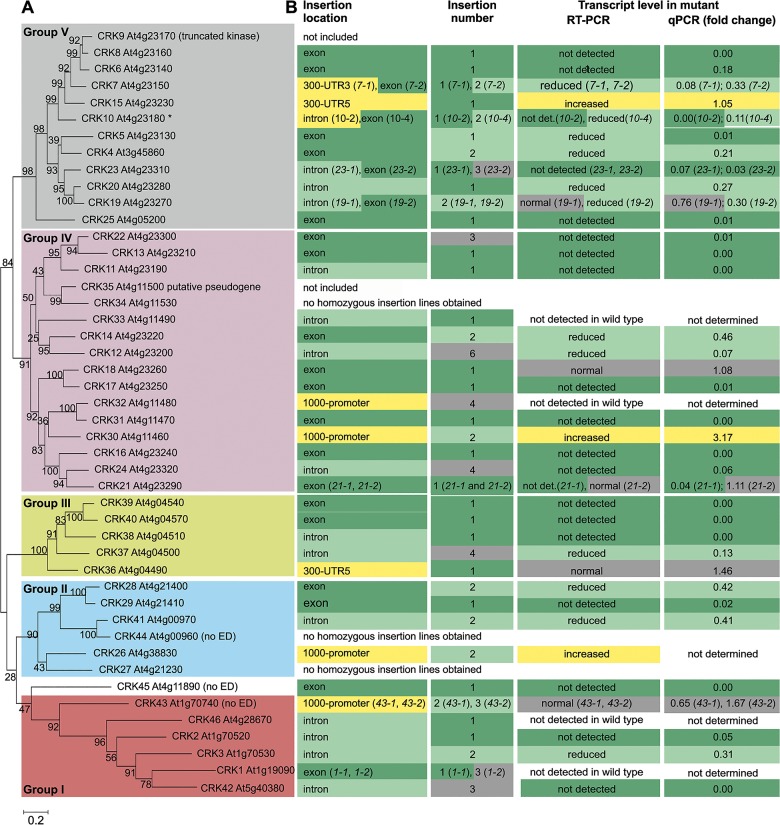
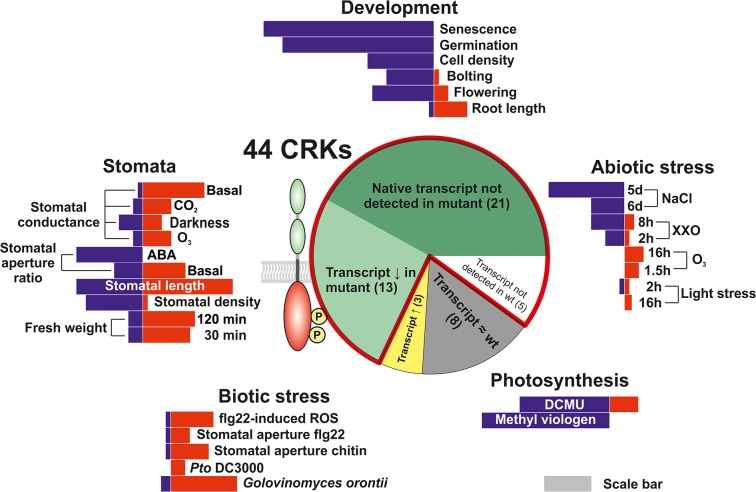
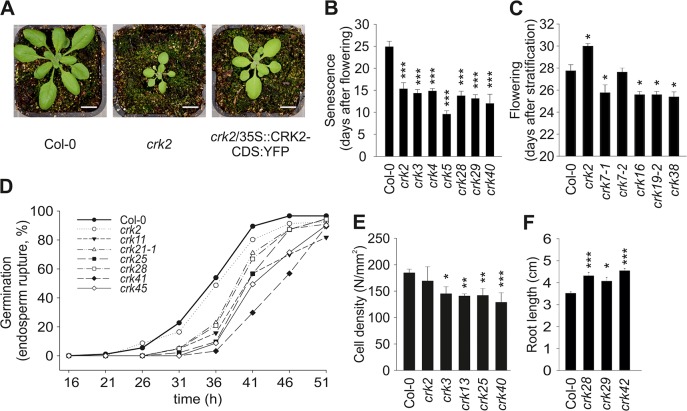
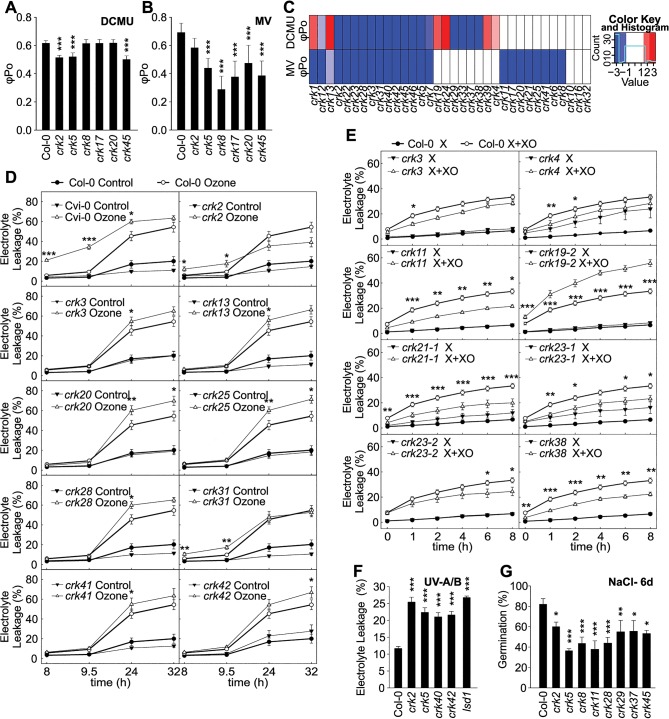
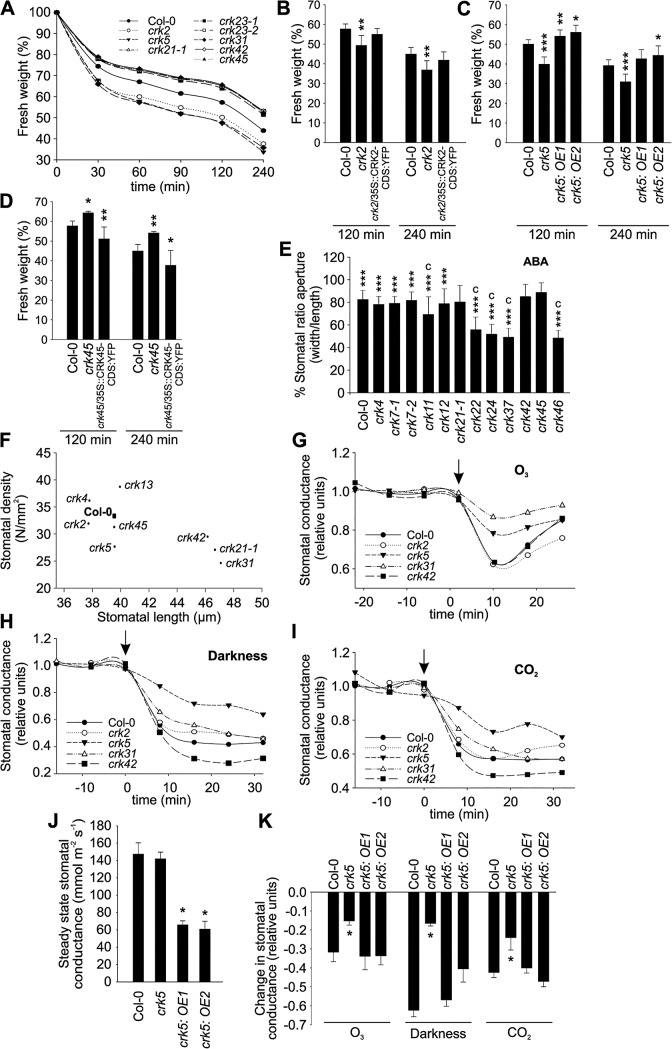
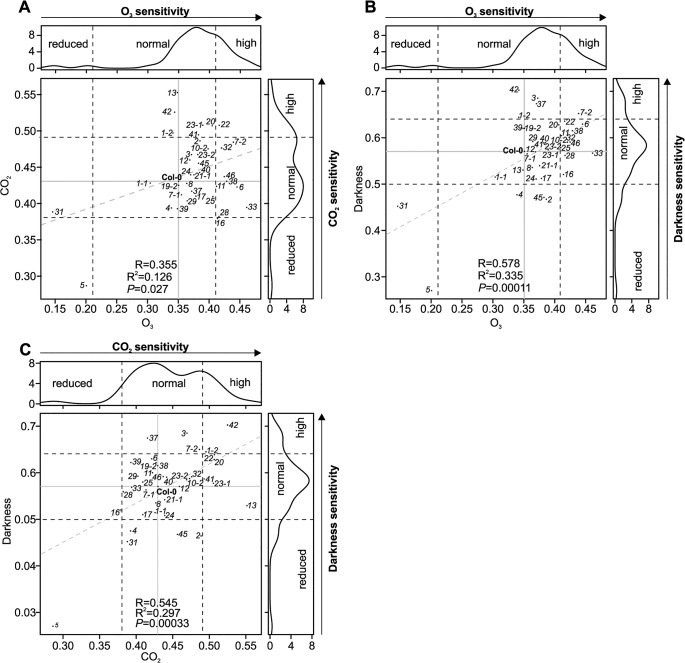
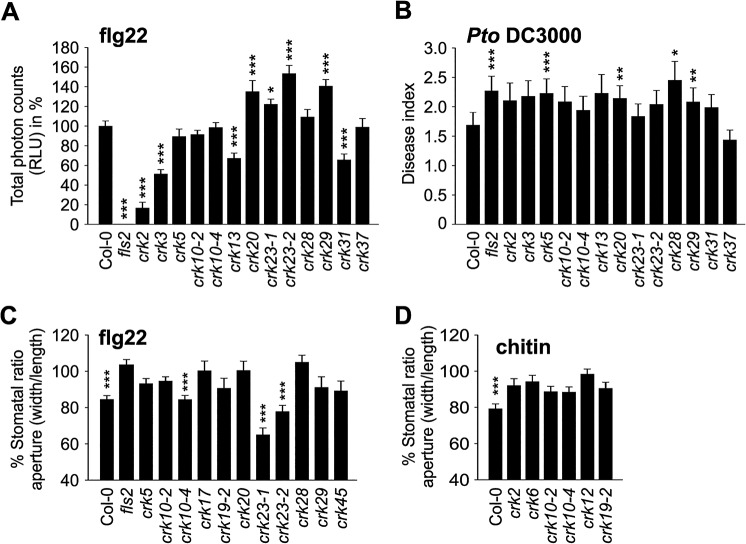
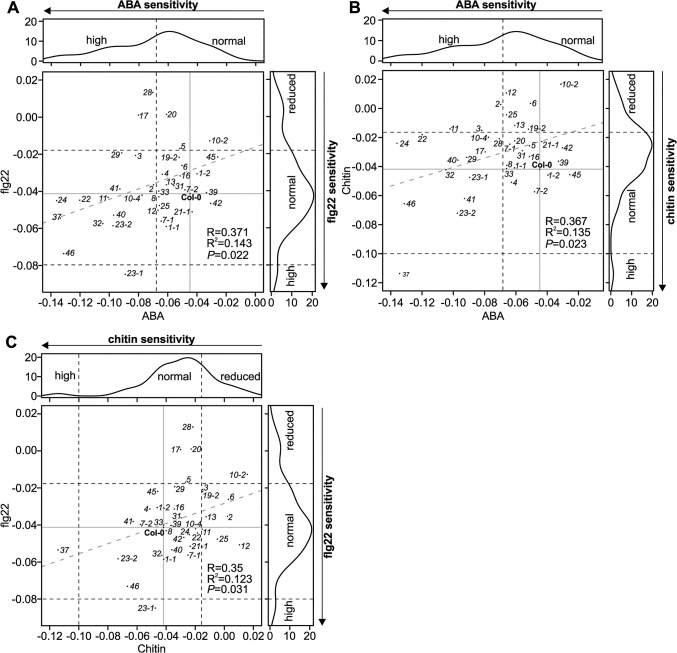
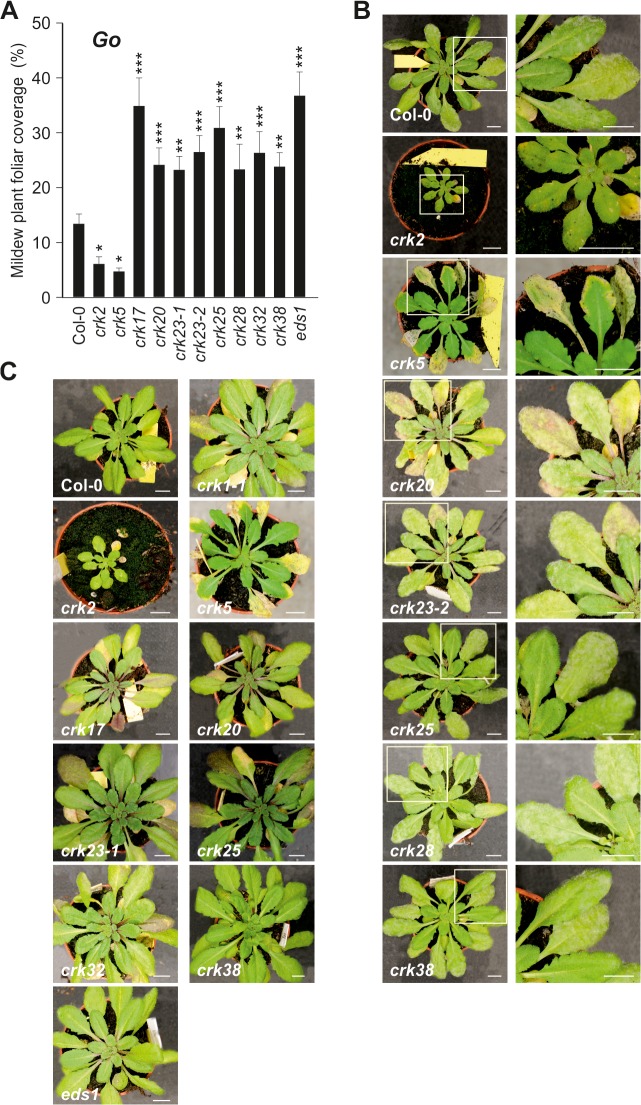
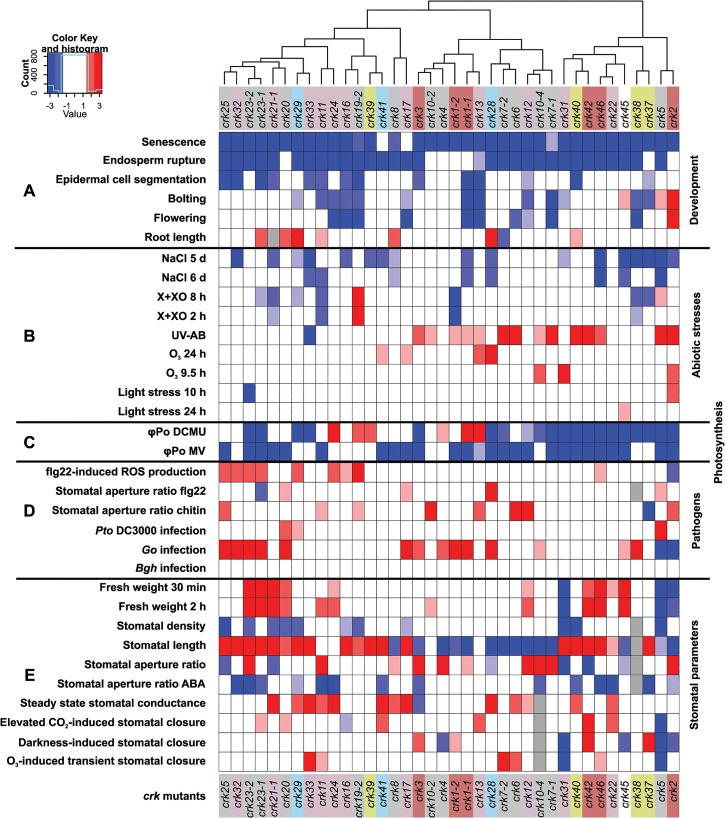
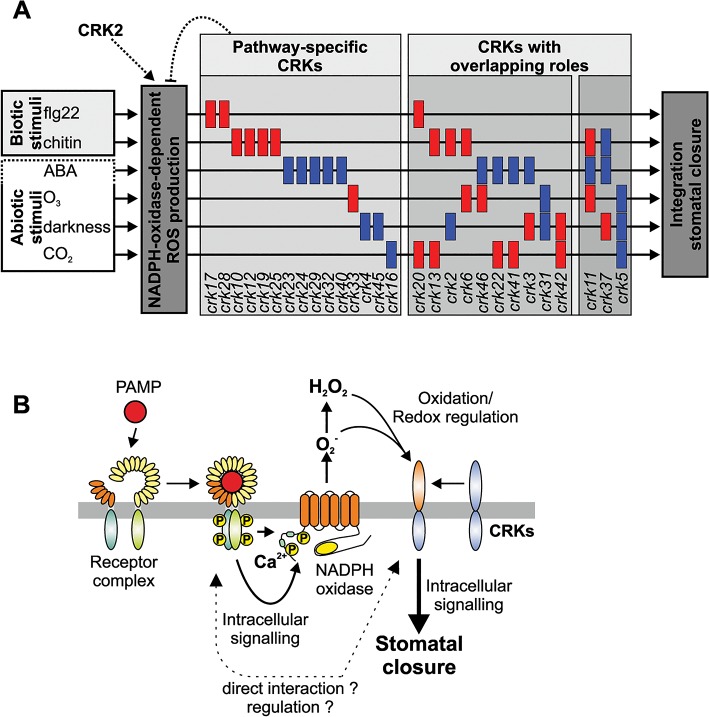
Cysteine-rich receptor-like kinases (CRKs) are transmembrane proteins characterized by the presence of two domains of unknown function 26 (DUF26) in their ectodomain. The CRKs form one of the largest groups of receptor-like protein kinases in plants, but their biological functions have so far remained largely uncharacterized. We conducted a large-scale phenotyping approach of a nearly complete crk T-DNA insertion line collection showing that CRKs control important aspects of plant development and stress adaptation in response to biotic and abiotic stimuli in a non-redundant fashion. In particular, the analysis of reactive oxygen species (ROS)-related stress responses, such as regulation of the stomatal aperture, suggests that CRKs participate in ROS/redox signalling and sensing. CRKs play general and fine-tuning roles in the regulation of stomatal closure induced by microbial and abiotic cues. Despite their great number and high similarity, large-scale phenotyping identified specific functions in diverse processes for many CRKs and indicated that CRK2 and CRK5 play predominant roles in growth regulation and stress adaptation, respectively. As a whole, the CRKs contribute to specificity in ROS signalling. Individual CRKs control distinct responses in an antagonistic fashion suggesting future potential for using CRKs in genetic approaches to improve plant performance and stress tolerance.


Conflict of interest statement

The authors have declared that no competing interests exist.

Figures

Fig 1
Fig 1. Phylogenetic clustering of the Arabidopsis thaliana CRK group of RLKs and summary of the crk T-DNA insertion collection.
(A) The coding region of the CRKs of Arabidopsis thaliana (including the truncated CRK9 At4g23170 and the putative pseudogene CRK35 At4g11500) was aligned using Muscle. The maximum-likelihood phylogenetic tree was estimated in MEGA6 using all sites (no gap penalty). The initial guide tree was constructed using maximum parsimony. Values at branch nodes represent bootstrap values (1000 replicates). CRK43 (At1g70740), CRK44 (At4g00960) and CRK45 (At4g11890) lack signal peptide, CRK ectodomain (ED) and transmembrane domain. (B) Information on T-DNA insertion lines for corresponding crk mutants is summarized: location of the T-DNA insertion in the gene (detailed information in S3 Fig), number of T-DNA insertions per line (determined by quantitative PCR; S1 Table) and transcript level of the corresponding crk mutant (according to semi-quantitative RT-PCR and qPCR; detailed information in S1 Table). For two additional crk10 alleles (crk10-1 and crk10-3) information can be found in S1 Table.
Fig 2
Fig 2. Phenotypic analysis of the Arabidopsis thaliana CRK protein family.
A T-DNA insertion collection for the CRK family was compiled and subjected to phenotyping addressing aspects of plant development, biotic and abiotic stress responses, photosynthesis as well as stomatal regulation. Length of red and blue bars in the five phenotyping sections is representative of the number of crk lines found to have phenotypes in the thematic area. Information about the sections in the pie chart is displayed in Figs 1 and S3 and S4 and S1 Table. The red outline in the pie chart highlights the lines included in the analyses and figures throughout the manuscript. The gray scale bar serves as a reference for comparison. The length of the scale bar corresponds to ten lines.
Fig 3
Fig 3. Plant development is affected in several crk mutants.
(A) Representative pictures of 17-day old seedlings of Col-0 wild type and crk2. Complementation of crk2 with 35S::CRK2-CDS:YFP rescued the growth defect of the mutant. Plants were grown under the following conditions: 250 μmol m-2 s-1 light intensity under 12 h-day length (day: 23°C, 70% relative humidity; night: 18°C, 90% relative humidity). Bar = 1 cm. Pictures are representative of three independent experiments. (B) A selection of crk mutant lines showing earlier senescence compared to Col-0 wild type. Results are means ± SE (n = 8). (C) Several crk mutants flowered earlier compared to wild type while crk2 flowered later. Results are means ± SE (n = 8). (D) Time course analysis of endosperm rupture showed delayed germination in several crk mutants compared to wild type. Results represent means from three independent biological experiments (n = 30). Testa and endosperm rupture were assessed every 5 hours up to 51 hours of imbibition. A seed was considered as germinated when the radicle protruded through both envelopes. (E) Several crk mutants exhibit a lower pavement cell density (number of pavement cells / mm2) in cotyledons. Results are means ± SE (n = 15). (F) Three crks showed slightly longer roots compared to wild type (measured eight days after stratification). Results are means ± SE (n = 16). (B-F) Differences between mutants and Col-0 wild type were compared and analysed using one-way-ANOVA (post hoc Dunnett, asterisks indicate statistical significance at *P<0.05, **P<0.01 and ***P<0.001) for (B, C, E) and linear model with single step p-value adjustment (F). All experiments were repeated three times with similar results.
Fig 4
Fig 4. Abiotic stress responses are affected in crk mutants.
(A and B) Treatment with 3-(3,4-dichlorophenyl)-1,1-dimethylurea (DCMU) for two hours (A) or methyl viologen (MV) for 48 hours (B) resulted in stronger impairment of photosynthesis in a subset of crk mutants compared to Col-0 wild type as shown by changes in the maximum quantum yield of primary photochemistry (φ Po). Significant differences in relation to wild type are indicated (n = 12, bars represent SD; one-way ANOVA with post hoc Tukey HSD) *** P<0.001. The experiment was repeated three times with similar results. (C) Clustering of DCMU and MV experiments. Red and blue indicate increased or decreased response with respect to Col-0, respectively (average of alleles). Color intensity is proportional to a Benjamini-Hochberg false discovery rate (FDR) adjusted Z statistic, which takes the estimated means and their variation into account. Roughly, |Z|>2 corresponds to an FDR<5%, and |Z|<2.6 to an FDR<1%. Results were clustered using a complete linkage algorithm with 1-Pearson correlation as distance. (D) In several crk mutant lines exposure to O3 resulted in elevated electrolyte leakage. Electrolyte leakage was measured at indicated time points after start of the O3 exposure that lasted 6 h (350 ppb). Mean values ± SD from two independent experiments are presented (n = 12, one-way ANOVA with post hoc Tukey HSD). (E) Xanthine-Xanthine Oxidase (X+XO) infiltration induced different levels of electrolyte leakage in crk mutants compared to wild type (0.1 U ml-1, 4 h). Mean values ± SD from three independent experiments are presented (n = 16, linear model with single-step p-value adjustment for multiple testing). (F) Treatment with ultraviolet-A (UV-A) and–B (UV-B) radiation led to increased electrolyte leakage in crks compared to wild type. Mean values ± SD from three independent experiments are presented (n = 12, one-way ANOVA with post hoc Tukey HSD). (G) Effect on NaCl on the germination crk seedlings at 6 days after stratification. Values represent mean of the ratio (germination percentage on 120 mM NaCl / percentage on control medium) for each line (n = 15, linear model, single-step p-value adjustment). Experiments were performed three times. Asterisks indicate statistically significant differences between crks and Col-0 (*P<0.05, **P<0.01 and ***P<0.001) (D-G). Error bars indicate ± SE (D, E and F). Relative electrolyte leakage was calculated as a ratio of the value measured at the indicated time and the total electrolyte leakage after freezing (D and E) or autoclaving the samples (F).
Fig 5
Fig 5. Stomatal development and responses are impaired in specific crks.
(A) A subset of the crk mutants showed altered water loss (shown as decrease of fresh weight) compared to Col-0 wild type plants after detachment of shoots from roots as evaluated from rosette weight. Complementation of the crk2 (B), crk5 (C) or crk45 (D) mutants restored a wild type-like water loss phenotype as interpreted from decrease of fresh weight of excised rosettes. Asterisks indicate differences between crk mutants or complementation lines and Col-0 with statistical significance at *P<0.05, **P<0.01 and ***P<0.001 according to one-way ANOVA with post hoc Tukey HSD. The experiment was repeated three times with similar results. (E) Stomatal apertures were measured 2 h after abscisic acid (ABA) treatment. Some crk mutants are impaired in stomatal closure 2 h after treatment with 10 μM ABA. Results are means of % stomatal aperture ratio (width/length) ± SE (average number of stomata measured = 250). Asterisks indicate statistical significance between control and ABA treatment at *P<0.05, **P<0.01 and ***P<0.001 (linear model, single-step p-value adjustment). Lowercase letters indicate statistical significance between wild type Col-0 and crk mutant at P<0.05 (a), P<0.01 (b) and P<0.001 (c) according to one-way ANOVA with post hoc Dunnett’s test. (F) Stomatal density (number of stomata/mm2) is correlated with stomatal length (μm). Most of the crks exhibit a smaller stomata density which correlates with longer stomata (Pearson correlation -0.69, p-value = 0.04). Results are means (average number of stomata measured = 500). (G-I) Time courses of stomatal conductance (relative units) in response to a 3 min pulse of 500–600 ppb of O3 (G), darkness (H) and elevation of CO2 from 400 ppm to 800 ppm (I) in a subset of crk mutants and Col-0. Stimuli were applied at 0 time point, which is indicated by an arrow; pre-treatment stomatal conductance was used for normalization. Graph shows the mean of two experiments (n = 6). (J) Overexpression of CRK5 led to lower stomatal conductance compared to Col-0 wild type. (K) Complementation of the crk5 mutant restored wild type-like phenotype in the response to a 3-min pulse of 500–600 ppb of O3, darkness, and elevating CO2 from 400 to 800 ppm. Asterisks indicate differences between crk mutants or complementation lines and Col-0 with statistical significance at *P<0.05 according to one-way ANOVA with post hoc Tukey HSD. The experiment was repeated three times with similar results.
Fig 6
Fig 6. Scatter plots of stomatal regulation in crk mutants.
The crk5 was insensitive to all studied stimuli, whereas crk31 was particularly insensitive to O3. The lines crk19-1 and crk22 were more sensitive to the analysed stimuli. (A) Scatter plot of stomatal responses of crk mutants to O3 (x-axis) and CO2 (y-axis). (B) Scatter plot of stomatal responses of crk mutants to O3 (x-axis) and darkness (y-axis) (C) Scatter plot of stomatal responses of crk mutants to CO2 (x-axis) and darkness (y-axis). Dashed lines indicate the cut-off for reduced, normal, and high response with respect to Col-0. Grey dashed lines show regression fit with correlation (R), coefficient of determination (R2) and significance reported in lower right corner in each plot. Reduced or increased responses were statistically significant in the majority of mutants (see respective barplots in S17, S18 and S19 Figs).
Fig 7
Fig 7. Immunity to bacterial pathogens is impaired in crk mutants.
(A) ROS production was enhanced in several crks compared to Col-0 wild type after elicitation with 100 nM flagellin (flg22) in 4 week-old leaves. Data show the percentage of the mean of the total RLU (relative light units) to Col-0 ± SE (n = 24). Asterisks indicate differences between crks and Col-0, statistical significance *P<0.05, **P<0.01 and ***P<0.001 (one-way ANOVA post hoc Dunnett). (B) A subset of crks was more susceptible to Pto DC3000 (spray infection of 2-week old seedlings at 108 cfu ml-1) compared to Col-0. Disease symptoms were scored 3 days post inoculation: 0, no symptom; 1, one symptomatic cotyledon; 2, two symptomatic cotyledons; 3, dead seedling. Results are means ± SE (n = 48). Asterisks indicate differences between crks and Col-0, statistical significance *P<0.05, **P<0.01 and ***P<0.001 (Mann-Whitney test, Benjamini-Hochberg correction for multiple comparisons). (C) Some crk mutants are impaired in stomatal closure after 2 h treatment with 10 mM flg22. Results are presented as mean of stomatal aperture ratio (width/length) after treatment compared to pre-treatment values in percentages ± SE (average number of stomata measured = 250). Asterisks indicate statistical significance between control treatment at *P<0.05, **P<0.01 and ***P<0.001 (linear model, single-step p-value adjustment). (D) Stomatal apertures were measured 2 h after chitin treatment. Stomatal closure is impaired in several crk mutants after treatment with chitin (1 g l-1) for two hours (five selected mutants are shown). Results are means of % stomatal aperture ratio (width/length) after treatment ± SE (average number of stomata measured = 250). Asterisks indicate statistical significance between control treatment at *P<0.05, **P<0.01 and ***P<0.001 (linear model, single-step p-value adjustment). All experiments were repeated three times with similar results.
Fig 8
Fig 8. Scatter plots for stomatal regulation in crk mutants.
(A) Scatter plot of stomatal responses of crk mutants to ABA (x-axis) and flagellin (flg22; y-axis). (B) Scatter plot of stomatal responses of crk mutants to ABA (x-axis) and chitin (y-axis). (C) Scatter plot of stomatal responses of crk mutants to chitin (x-axis) and flg22 (y-axis). Black dashed lines indicate the cut-off for reduced, normal, and high response with respect to Col-0. Grey dashed lines show regression fit with correlation (R), coefficient of determination (R2) and significance reported in lower right corner in each plot. Reduced or increased responses were statistically significant in the majority of mutants (see respective barplots in S15A and S23 Figs).
Fig 9
Fig 9. Immunity to powdery mildews is impaired in crk mutants.
(A) Relative amount of plant foliar mildew coverage (in percent) caused by the virulent biotrophic powdery mildew Golovinomyces orontii (Go) on crks compared to Col-0 wild type and Go-super-susceptible eds1. Results are mean ± SE (n = 15). The experiment was conducted three times and the amount of disease was normalised between experiments by setting the infection cover of Col-0 to one. Asterisks indicate differences between crks and Col-0, statistical significance *P<0.05, **P<0.01 and ***P<0.001 (linear mixed model with Benjamini-Hochberg false discovery rate correction). (B) Pictures of Go infected crks and close-up of infected leaves. In some cases, infected leaves displayed increased pigmentation and crk5 showed accelerated death of the infected leaves. Bar = 1 cm. (C) No infection was observed with the non-host powdery mildew Blumeria graminis f. sp. hordei (Bgh) but several crks displayed increased pigmentation. Bar = 1 cm. All experiments were repeated three times with similar results.
Fig 10
Fig 10. Integrated cluster analysis of crk mutant phenotypes.
An age-matched collection of T-DNA insertion lines in CRK genes was analyzed for developmental and stress-related phenotypes. (A) Analysis of developmental phenotypes of crk mutant lines: senescence, germination (endosperm rupture), epidermal cell segmentation, bolting, flowering, and root length. (B) Analysis of abiotic stresses phenotypes of crk lines: germination of crk lines on medium containing NaCl, cell death (measured by electrolyte leakage) in response to Xanthine-Xanthine Oxidase (X+XO), ultraviolet light (UV-AB), ozone (O3), or light stress. (C) Analysis of photosynthesis responses upon treatment with DCMU or methyl viologen (MV). (D) Pathogen phenotypes. ROS production in response to treatment with the bacterial elicitor flagellin (flg22). Stomatal aperture ratio in response to flg22 and chitin treatments and crk susceptibility to the hemibiotrophic bacterial pathogen Pseudomonas syringae pv. tomato DC3000 (Pto infection) or the biotrophic fungal pathogens Golovinomyces orontii (Go) (virulent on Arabidopsis) or Blumeria graminis f.sp. hordei (Bgh, a barley pathogen, non-pathogenic on Arabidopsis). (E) Analysis of stomatal parameters: fresh weight (for determination of water loss), density, length, aperture, stomatal aperture in response to ABA treatment, steady state stomatal conductance, stomatal closure in response to elevated CO2, O3, and darkness. Experiments were made comparable by bootstrap sampling to n = 15 followed by averaging over bootstrap estimates. Red and blue indicate statistically significant increase or decrease in response compared to Col-0 wild type, respectively, while white indicates a response that is similar to wild type Col-0. The intensity of color is proportional to the Benjamini-Hochberg false discovery rate (FDR) adjusted Z statistic which takes the estimated means and their variation into account. As a rough guideline, |Z|>1.67 corresponds to a FDR<10% (shown with light hue), and |Z|<2.6 to a strong FDR<1% (intense color). White: non-significant response; grey: not measured. A corresponding plot displaying the adjusted Z statistics without thresholding is shown in S25 Fig.
Fig 11
Fig 11. Models of CRK function and how they could provide specificity of stomatal aperture regulation.
(A) CRKs might act as pathway-specific or multi-pathway regulators of stomatal aperture in response to the PAMPs flg22 and chitin but also the stress hormone ABA and the abiotic stimuli O3, darkness and CO2. The figure has been created from data presented in Fig 10. (B) CRKs are involved in the response to pathogens downstream of extracellular ROS production. PAMPs are recognized by pattern recognition receptor complexes. Subsequently, intracellular signalling leads to activation of extracellular superoxide production by NADPH oxidases. ROS perception subsequently leads to intracellular signalling and ultimately stomatal closure. CRKs are implicated in linking extracellular ROS production to intracellular signalling and might regulate and/or interact directly with the recognition receptor complexes.

Similar articles

Cited by

References

    1. Shiu SH, Bleecker AB (2003) Expansion of the receptor-like kinase/Pelle gene family and receptor-like proteins in Arabidopsis. Plant Physiol 132: 530–543. - PMC - PubMed
    1. Shiu SH, Karlowski WM, Pan R, Tzeng YH, Mayer KF, et al. (2004) Comparative analysis of the receptor-like kinase family in Arabidopsis and rice. Plant Cell 16: 1220–1234. - PMC - PubMed
    1. Bojar D, Martinez J, Santiago J, Rybin V, Bayliss R, et al. (2014) Crystal structures of the phosphorylated BRI1 kinase domain and implications for brassinosteroid signal initiation. Plant J 78: 31–43. 10.1111/tpj.12445 - DOI - PMC - PubMed
    1. Oh MH, Wang X, Kota U, Goshe MB, Clouse SD, et al. (2009) Tyrosine phosphorylation of the BRI1 receptor kinase emerges as a component of brassinosteroid signaling in Arabidopsis . Proc Natl Acad Sci USA 106: 658–663. 10.1073/pnas.0810249106 - DOI - PMC - PubMed
    1. Lehti-Shiu MD, Shiu SH (2012) Diversity, classification and function of the plant protein kinase superfamily. Philos Trans R Soc Lond B Biol Sci 367: 2619–2639. 10.1098/rstb.2012.0003 - DOI - PMC - PubMed

Publication types

MeSH terms