. 2015 Jul 21;10(7):e0133627.
doi: 10.1371/journal.pone.0133627. eCollection 2015.

Large-Scale and Comprehensive Immune Profiling and Functional Analysis of Normal Human Aging

Affiliations

Large-Scale and Comprehensive Immune Profiling and Functional Analysis of Normal Human Aging

Chan C Whiting et al. PLoS One. .

Abstract

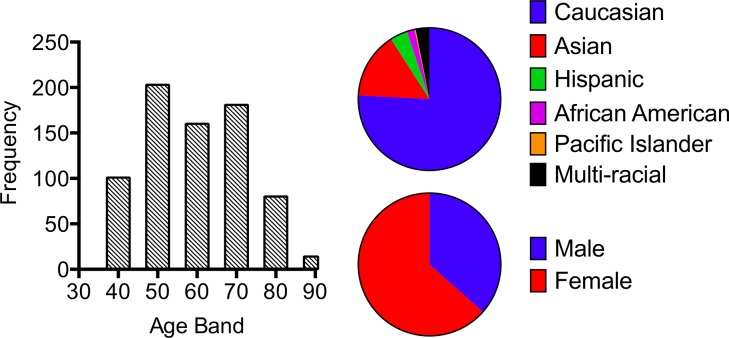
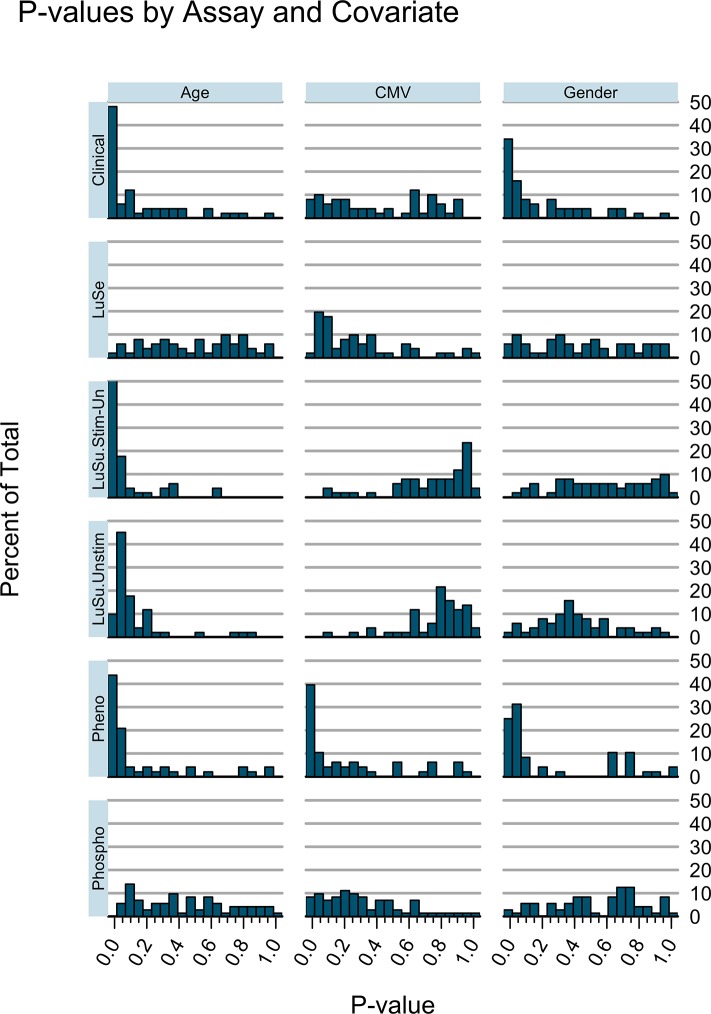
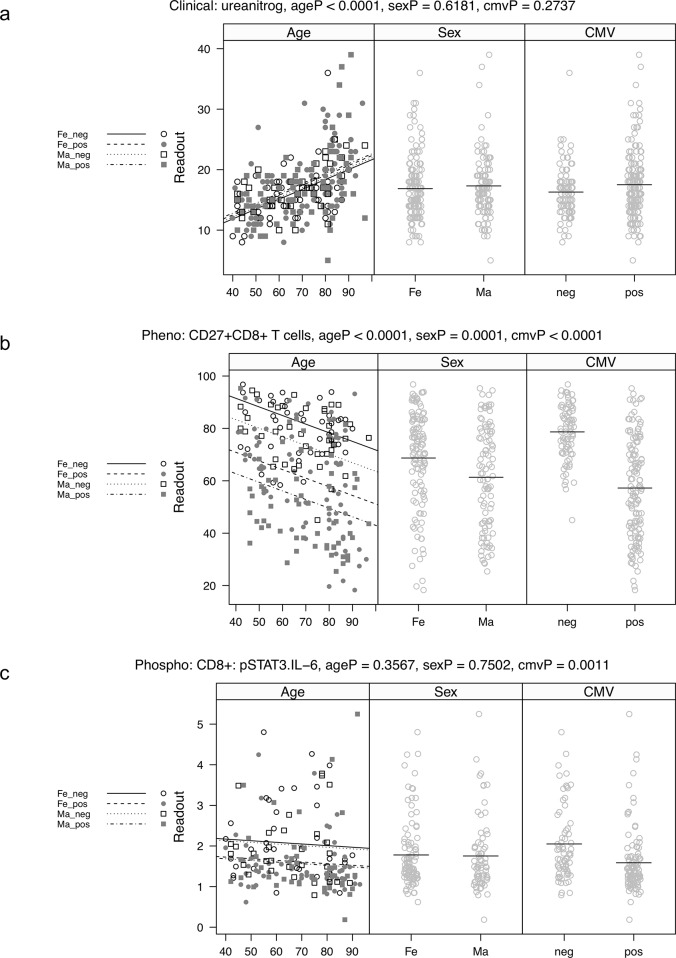
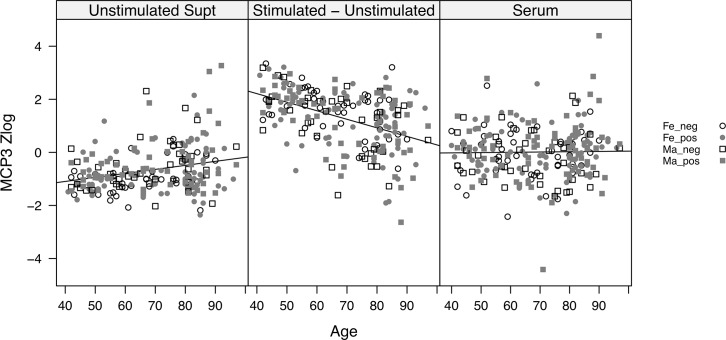
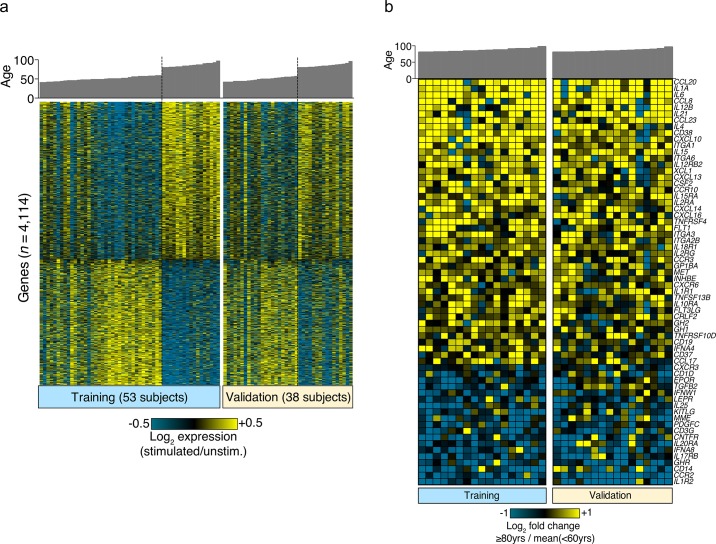
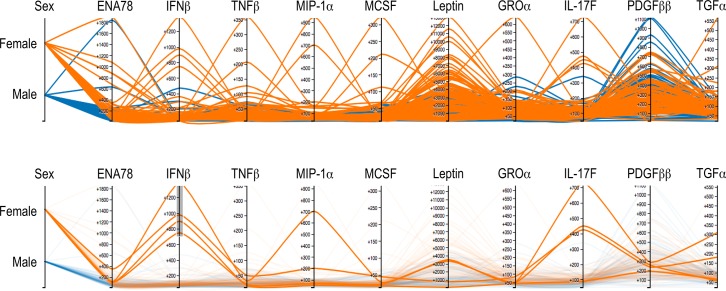
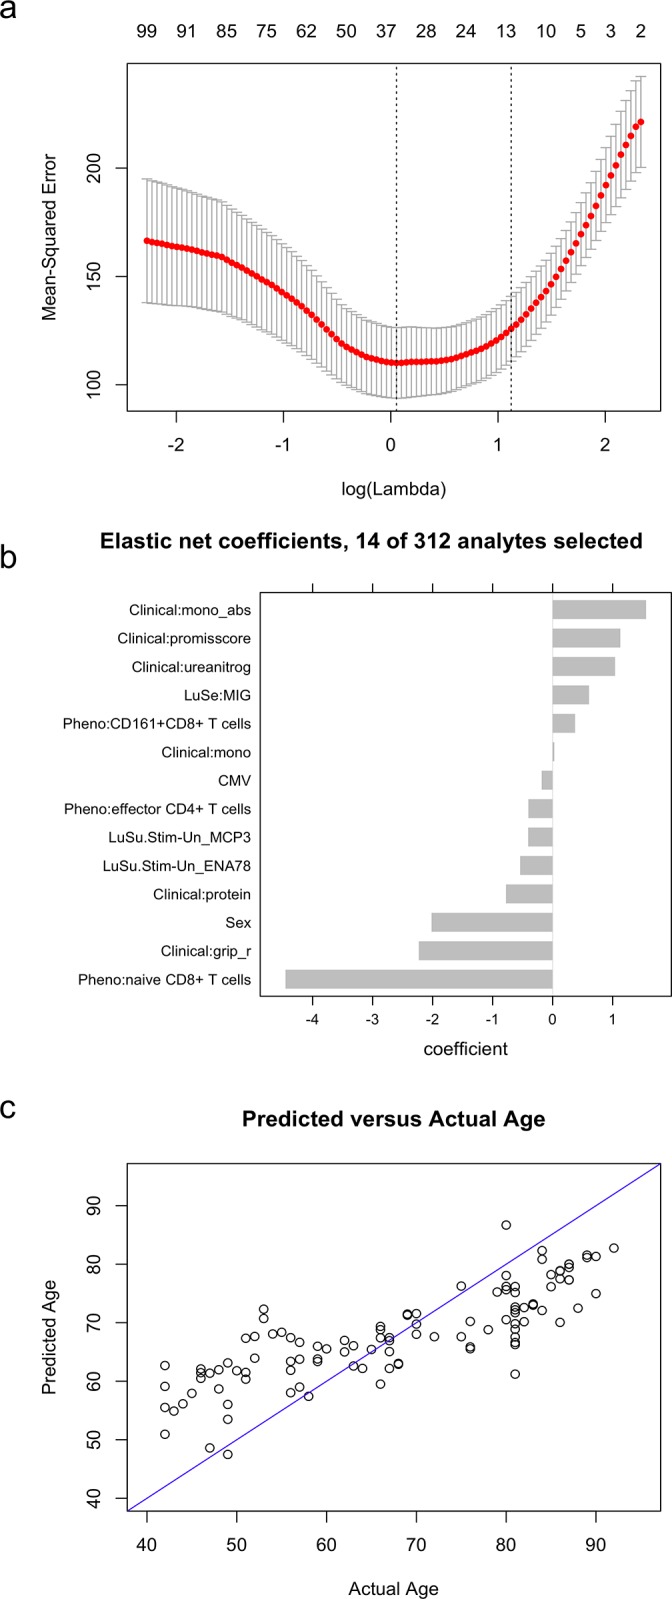
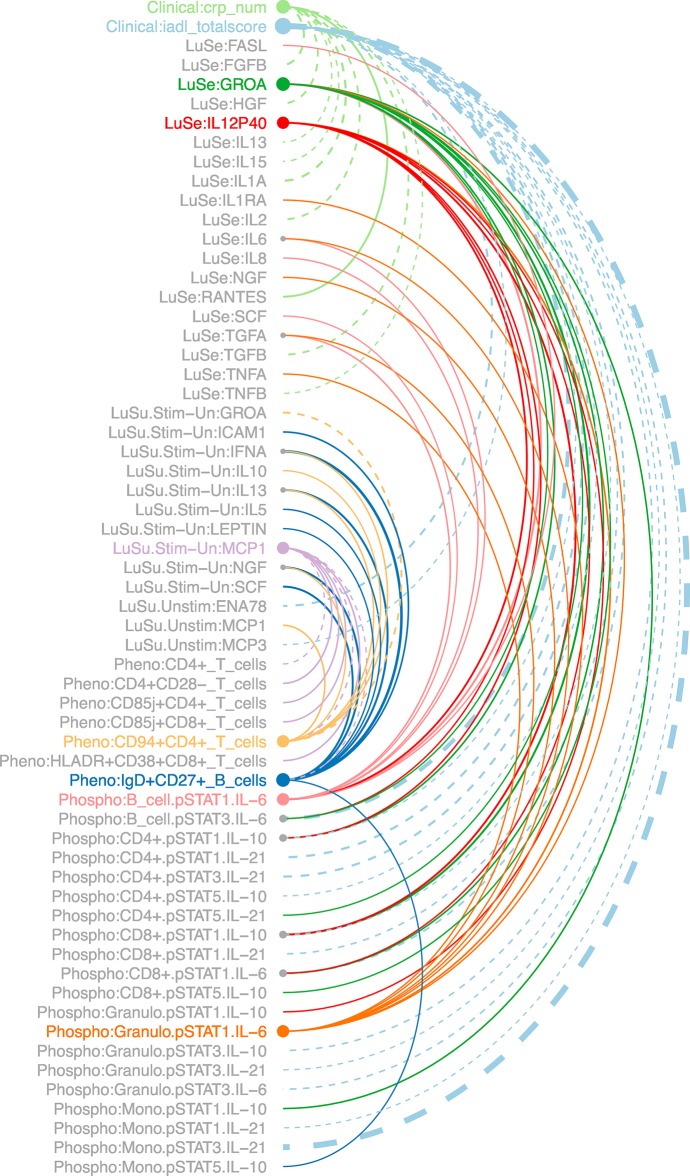
While many age-associated immune changes have been reported, a comprehensive set of metrics of immune aging is lacking. Here we report data from 243 healthy adults aged 40-97, for whom we measured clinical and functional parameters, serum cytokines, cytokines and gene expression in stimulated and unstimulated PBMC, PBMC phenotypes, and cytokine-stimulated pSTAT signaling in whole blood. Although highly heterogeneous across individuals, many of these assays revealed trends by age, sex, and CMV status, to greater or lesser degrees. Age, then sex and CMV status, showed the greatest impact on the immune system, as measured by the percentage of assay readouts with significant differences. An elastic net regression model could optimally predict age with 14 analytes from different assays. This reinforces the importance of multivariate analysis for defining a healthy immune system. These data provide a reference for others measuring immune parameters in older people.


Conflict of interest statement

Competing Interests: JS is an employee of CytoAnalytics. There are no patents, products in development or marketed products to declare. This does not alter the authors' adherence to all the PLOS ONE policies on sharing data and materials.

Figures

Fig 1
Fig 1. Demographics of the cohort of 740 participants, including age band, race/ethnicity, and sex.
Results are representative of the aging population in the San Francisco Bay Area. A subset of 240 of these individuals was selected for further immunological analysis; this subset included all individuals age 78 and above, with an equal number of 40–50 year olds, and lower representation of the middle age bands.
Fig 2
Fig 2. Overview of age, sex, and CMV-status associations with laboratory and clinical assay results.
Histograms show the distribution of P values for the analytes within each assay category. Clinical = all clinical variables; LuSe = serum Luminex; LuSuptStim-Un = PBMC supernatant Luminex, Stimulated-Unstimulated values; LuSuptUnstim = PBMC supernatant Luminex, Unstimulated values only; Pheno = CyTOF immune phenotyping; PhopshoFC = phospho-flow cytometry. It is apparent that the clinical variables yield low P values primarily for age and sex. Stimulated Luminex assays yield more low P values than serum Luminex assays, and those P values are largely restricted to age. Flow cytometry phenotyping reveals a higher proportion of sex and CMV effects, while phospho-flow cytometry did not yield many low P values for any covariate (age, sex, or CMV status).
Fig 3
Fig 3. (A) Example of a clinical laboratory assay, urea nitrogen, which shows a significant correlation with age (unadjusted P value = 5.8x10^-15), but not with sex or CMV status.
All p-values are unadjusted p-values from a multiple linear regression as described in the methods. The p-values test the significance of the indicated predictor variable, while adjusting for the other two variables. The left most panel (age) shows age versus urea nitrogen, with fitted regression lines for CMV negative females (Fe_neg, solid), CMV positive females (Fe_pos, dash), CMV negative males (Ma_neg, dot), and CMV positive males (Ma_pos, dot dash). Observations from each of these four groups are indicated by different symbols. The second panel (Sex) shows observations by sex, with horizontal reference lines at group means. The third panel (CMV) shows observations by CMV status, with horizontal reference lines at group means. (B) Example of a cell subset (CD27+CD8+ T cells) that has significant correlations with age, sex, and CMV status. The Y axis represents the percentage of CD27+CD8+ T cells within all CD8+ T cells. The CMV effect is the most dramatic (unadjusted P value = 1.7x10^-18). (C) Example of a phospho-flow cytometry readout (IL-6 stimulated pSTAT3 in CD8+ T cells) that has a significant CMV effect (P = .0035), but no significant age or sex relationship. The Y axis represents the fold change in pSTAT3 in CD8+ T cells, unstimulated/IL-6 stimulated.
Fig 4
Fig 4. Example of a cytokine, MCP-3 (also known as CCL7) that shows differing trends with age depending upon the type of assay.
Left panel, supernatant levels from unstimulated PBMC incubated for 4 hours. Middle panel, supernatant levels from PBMC stimulated with a cocktail of IFNα, LPS, CD3+CD28, and anti-IgM+IgG, after subtraction of unstimulated supernatant levels. Right panel, serum levels. All cytokines were measured by a 63-plex Luminex panel. Y-axis values represent the z score of median fluorescence intensity (MFI), after log2 transformation. Black line shows fitted regressions of analyte readout versus age. While CMV effects were not significant in any assay, age effects were significant for both unstimulated and stimulated-unstimulated supernatant assays.
Fig 5
Fig 5. Differentially expressed genes by age in stimulated PBMC.
After 4 hours incubation of PBMC with or without a cocktail of IFNα, LPS, CD3+CD28, and anti-IgM+IgG, RNA was extracted and used for gene expression microarray analysis (Agilent, 4x44K, 2-color). Subjects <60 y and > = 80 y were randomly divided into a training set (53 subjects) and validation set (38 subjects). 4114 genes were identified in the training set as differentially expressed in the older vs. younger subset. (A) Differentially expressed genes are ordered by decreasing fold change between older and younger groups in the training set (left panel). A similar segregation is seen in the validation group (right panel). In these panels, expression values are represented as log2 expression(stimulated/unstimulated). (B) Display of 64 immune-related genes from the 4114 gene signature. In these panels, expression values are represented as fold change compared to the mean level of each gene in the young group. While many genes were associated with age, no gene signature was found to be specifically associated with CMV or sex (data not shown).
Fig 6
Fig 6. Example of multivariate visualization using parallel coordinates (http://earlybird.cytoanalytics.com).
Results for the ten serum cytokines with highest variability are shown, with individuals colored by sex. Each analyte is displayed on its own vertical axis, with the axis range corresponding to the data range. Each line represents one person, and intersects each axis at the appropriate value (MFI) for that person. With the exception of PDGFββ, it is clear that the highest outliers are all females. By selectively highlighting the top individuals for IFNβ (bottom panel), it becomes apparent that many of these individuals are “serial outliers”, i.e., high for other cytokines as well. This implies a minority phenotype of females with multiple high serum cytokine levels.
Fig 7
Fig 7. (A) Profile of mean-squared error of elastic-net regression for various values of lambda.
For a range of lambdas, an elastic-net regression is fit using 10-fold cross-validation. Vertical dotted lines indicate the value of lambda for which MSE is minimized, and the largest value of lambda within one standard error of that minimum. The numbers along the top border of the graph indicate the number of non-zero parameters that are included in the model for corresponding values of lambda. (B) Results of elastic-net regression combining data from multiple assays. Each bar represents the coefficients for a particular predictor of age. Predictors are selected by the algorithm, with 14 out of 312 analytes chosen. Analytes from multiple assays (clinical, serum Luminex, flow phenotyping, and the stimulated PBMC supernatant Luminex) were selected. Sex and CMV status were explicitly included in the model. Predictors were converted to Z-scores prior to model fitting so that all analytes could be interpreted on a common scale. Each unit represents one standard deviation for that particular analyte. Coefficients represent adjustment to a mean age of 69, based on the scaled value of the analyte. Thus, for example, the estimated age increases by approximately 1.6 years for every unit increase in absolute monocyte count (the analyte with the largest positive coefficient), holding all other values constant; and decreases by approximately 4.5 years for every unit increase in naïve CD8+ T cells (the analyte with the largest negative coefficient). (C) Comparison of predicted versus actual age for the elastic-net model. Each point represents one person. The blue diagonal line represents predicted age = actual age. Interestingly, the resulting model overestimates the age of younger participants, and underestimates the age of older participants.
Fig 8
Fig 8. Associations between clinical and immunological analytes, after accounting for the effects of age, sex, and CMV status.
Initially, associations were limited to the strongest 0.5% of the cross-assay associations, as defined by smallest p-values. The 3 Luminex assays were considered a single assay. We then looked for analytes having the largest numbers of associations, hereafter called connections. The diagram includes all analytes connected to at least 7 other analytes (n = 9), and the analytes to which these analytes are connected, for a total of 61 analytes. Node size is proportional to the number of connections. Solid lines represent positive correlation, dotted lines negative. Line width is proportional to absolute magnitude of correlation, with thicker lines representing stronger correlations. Line color differs for each of the 9 highly connected analytes.

References

    1. Miller C, Kelsoe G (1995) Ig VH hypermutation is absent in the germinal centers of aged mice. J Immunol 155: 3377–3384. - PubMed
    1. Yang X, Stedra J, Cerny J (1996) Relative contribution of T and B cells to hypermutation and selection of the antibody repertoire in germinal centers of aged mice. J Exp Med 183: 959–970. - PMC - PubMed
    1. Braber den I, Mugwagwa T, Vrisekoop N, Westera L, Mögling R, Bregje de Boer A, et al. (2012) Maintenance of peripheral naive T cells is sustained by thymus output in mice but not humans. Immunity 36: 288–297. 10.1016/j.immuni.2012.02.006 - DOI - PubMed
    1. Pang WW, Price EA, Sahoo D, Beerman I, Maloney WJ, Rossi DJ, et al. (2011) Human bone marrow hematopoietic stem cells are increased in frequency and myeloid-biased with age. Proceedings of the National Academy of Sciences 108: 20012–20017. 10.1073/pnas.1116110108 - DOI - PMC - PubMed
    1. Beerman I, Bhattacharya D, Zandi S, Sigvardsson M, Weissman IL, Bryder D, et al. (2010) Functionally distinct hematopoietic stem cells modulate hematopoietic lineage potential during aging by a mechanism of clonal expansion. Proceedings of the National Academy of Sciences 107: 5465–5470. 10.1073/pnas.1000834107 - DOI - PMC - PubMed

Publication types

MeSH terms