. 2015 Jul 22:13:50.
doi: 10.1186/s12915-015-0154-0.

Quantification of gait parameters in freely walking rodents

Affiliations

Quantification of gait parameters in freely walking rodents

César S Mendes et al. BMC Biol. .

Abstract

Background: Qualitative and quantitative measurements of motor performance are essential for characterizing perturbations of motor systems. Although several methods exist for analyzing specific motor tasks, few behavioral assays are readily available to researchers that provide a complete set of kinematic parameters in rodents.

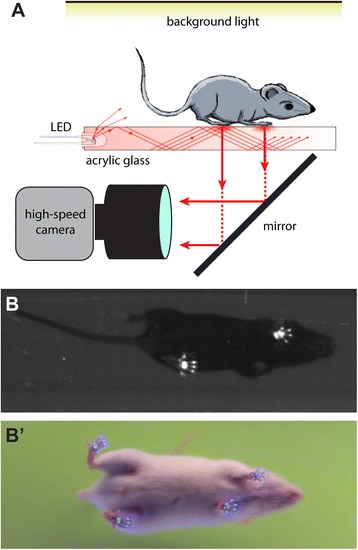
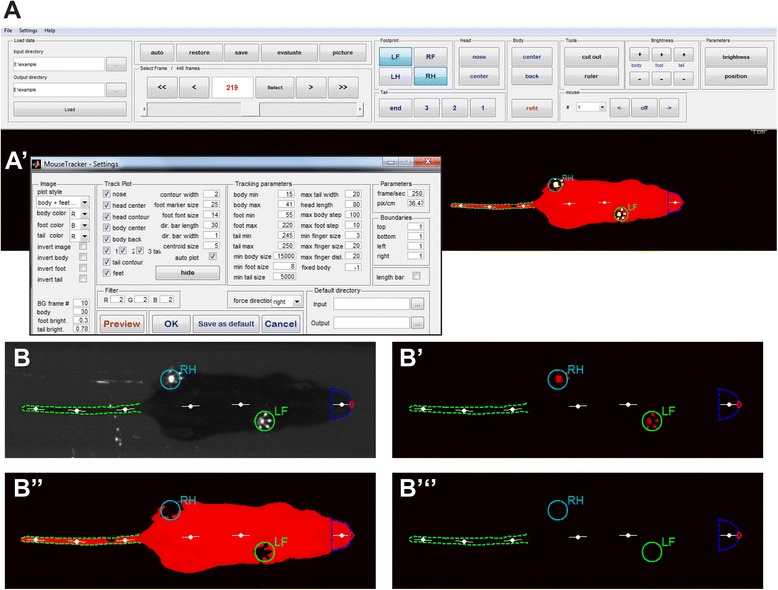
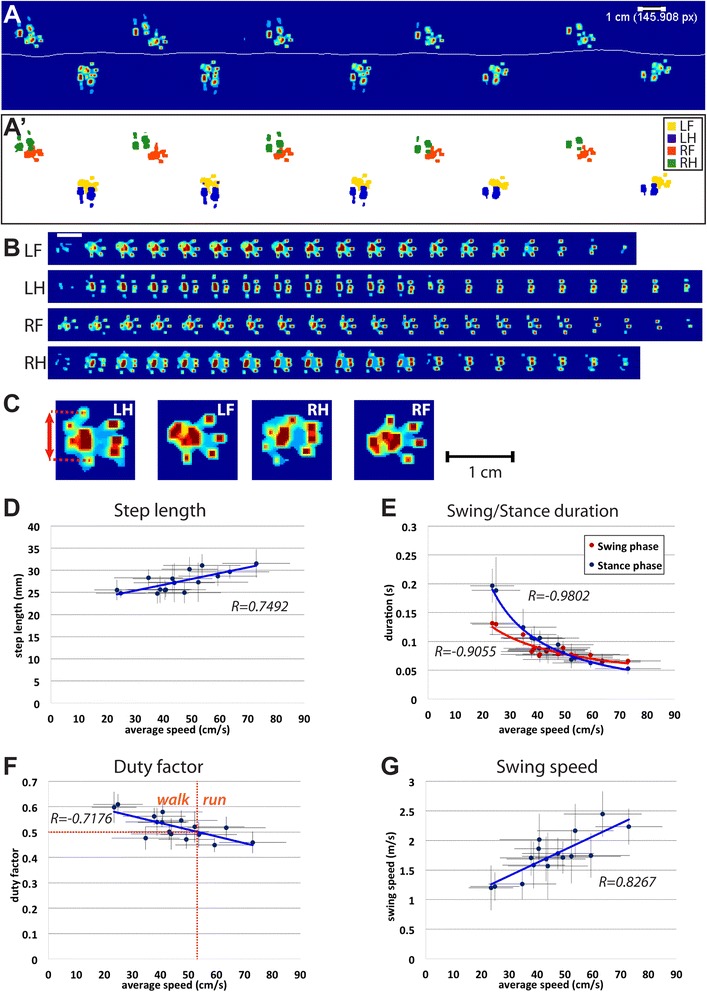
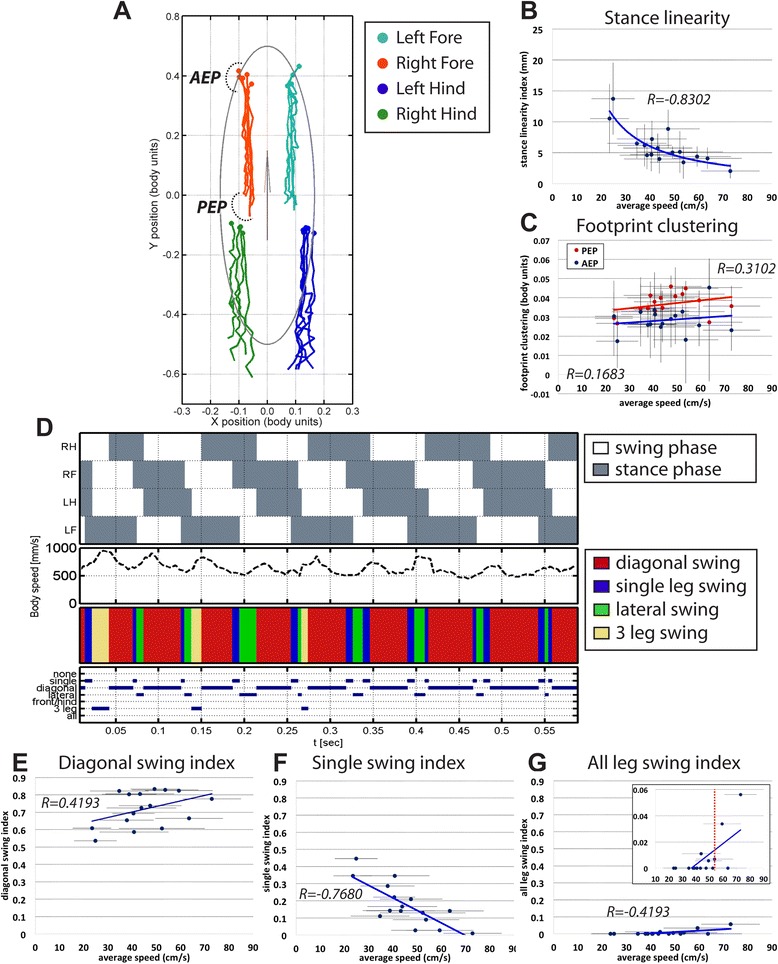
Results: Here we present MouseWalker, an integrated hardware and software system that provides a comprehensive and quantitative description of kinematic features in freely walking rodents. Footprints are visualized with high spatial and temporal resolution by a non-invasive optical touch sensor coupled to high-speed imaging. A freely available and open-source software package tracks footprints and body features to generate a comprehensive description of many locomotion features, including static parameters such as footprint position and stance patterns and dynamic parameters, such as step and swing cycle duration, and inter-leg coordination. Using this method, we describe walking by wild-type mice including several previously undescribed parameters. For example, we demonstrate that footprint touchdown occurs instantaneously by the entire paw with no obvious rostral-caudal or lateral-medial bias.

Conclusions: The readily available MouseWalker system and the large set of readouts it generates greatly increases the currently available toolkit for the analysis of wild type and aberrant locomotion in rodents.


Figures

Fig. 1
Fig. 1
Optical footprint detection system. a Schematic of the fTIR effect. LED light sources are located at the edges of a piece of acrylic glass and light propagates within the glass via internal reflection. Footprints disrupt this optical effect leading to the light scattering, which is detected by a high-speed camera. Single frame of an fTIR video in black and white (b) and color (b'). The fTIR effect is visible while the legs are in contact with the acrylic glass surface during the stance phase. Background light allows detection of body contour
Fig. 2
Fig. 2
MouseWalker software interface. a Program layout. Videos are loaded, automatically tracked, and edited in a single window. a' Settings window provides detection and display options. Visualization options: tracking can be visualized simultaneously with the original video (b), with only the footprints (b'), with only the body contour (b''), or none of these (b''')
Fig. 3
Fig. 3
Footprint analysis tools and step parameters. a Complete footprint pattern. A heat map represents pixel intensity and the horizontal line represents the body path. a' Individual feet are labeled with different colors: the left fore, left hind, right fore, and right hind legs are represented in yellow, blue, orange, and green, respectively. b Stance phase dynamics. Each row shows successive frames for a single stance phase. All four legs are represented, top to bottom: left fore (LF), left hind (LH), right fore (RF), and right hind (RH). Stance initiation is to the left and each frame is 4 ms apart. White bar, 1 cm scale. c Individual full stance footprint. Each footprint is individually represented by a pixel intensity heat map. A pixel to centimeter conversion allows the user to measure changes in toe spreading for each footprint (red arrows). d–g Step parameters as a function of speed. Graphical fits are included. x-axis error bars represent standard deviations of the average speed. d Step length increases with speed. e Swing and stance phase durations are inversely proportional to speed. f Duty factor decreases with speed. Linear regression line (y = −0.0027x – 0.6425) determines that for speeds faster then 52.8 cm/s (vertical dashed red line), the duty factor falls below 0.5 (horizontal dashed red line), which confines the transition from a walk to a run-like gait. g Swing speed increases linearly with speed
Fig. 4
Fig. 4
Stance traces and inter-leg coordination parameters. a Stance traces. Representative plot of an animal walking at 34.8 cm/s. Traces are generated by the position of the stance phase footprints relative to the body center (set at 0.0, 0.0). For each leg, stance onset corresponds to the anterior extreme position (AEP, marked by a dashed line) while stance offset is termed the posterior extreme position (PEP). b Stance linearity index decreases as a function of speed. Each data point measures the average jitter of the stance traces for all the legs. x-axis error bars represent standard deviations of the average speed. c Footprint clustering values are on average higher for PEP compared to AEP and increase with speed. d Gait patterns and step combinations. From top to bottom: Gait patterns (white areas represent swing phases and gray areas represent stance phases), instantaneous speed, color-coded leg conformation, and leg combination traces. e–g Leg combination indexes. y-axis upper limits are set to 0.9 to facilitate comparison. Graphical fits are also represented. e Diagonal swing index as a function of speed. Diagonal swing is the most representative leg combination, which increases with speed. f Single swing index decreases significantly with increased speed. g The all-legs swing index is observed primarily at higher speeds. The inset is the adjusted y-axis. The vertical dashed line is the transition from a walk to run-like behavior

Similar articles

Cited by

References

    1. Goulding M. Circuits controlling vertebrate locomotion: moving in a new direction. Nat Rev Neurosci. 2009;10:507–518. doi: 10.1038/nrn2608. - DOI - PMC - PubMed
    1. Kiehn O, Dougherty KJ, Hagglund M, Borgius L, Talpalar A, Restrepo CE. Probing spinal circuits controlling walking in mammals. Biochem Biophys Res Commun. 2010;396:11–18. doi: 10.1016/j.bbrc.2010.02.107. - DOI - PubMed
    1. Wong PC, Cai H, Borchelt DR, Price DL. Genetically engineered mouse models of neurodegenerative diseases. Nat Neurosci. 2002;5:633–639. doi: 10.1038/nn0702-633. - DOI - PubMed
    1. Drai D, Kafkafi N, Benjamini Y, Elmer G, Golani I. Rats and mice share common ethologically relevant parameters of exploratory behavior. Behav Brain Res. 2001;125:133–140. doi: 10.1016/S0166-4328(01)00290-X. - DOI - PubMed
    1. Wallace JE, Krauter EE, Campbell BA. Motor and reflexive behavior in the aging rat. J Gerontol. 1980;35:364–370. doi: 10.1093/geronj/35.3.364. - DOI - PubMed

Publication types

LinkOut - more resources