. 2015 Jul 22:6:7866.
doi: 10.1038/ncomms8866.

A draft network of ligand-receptor-mediated multicellular signalling in human

Affiliations

A draft network of ligand-receptor-mediated multicellular signalling in human

Jordan A Ramilowski et al. Nat Commun. .

Erratum in

Abstract

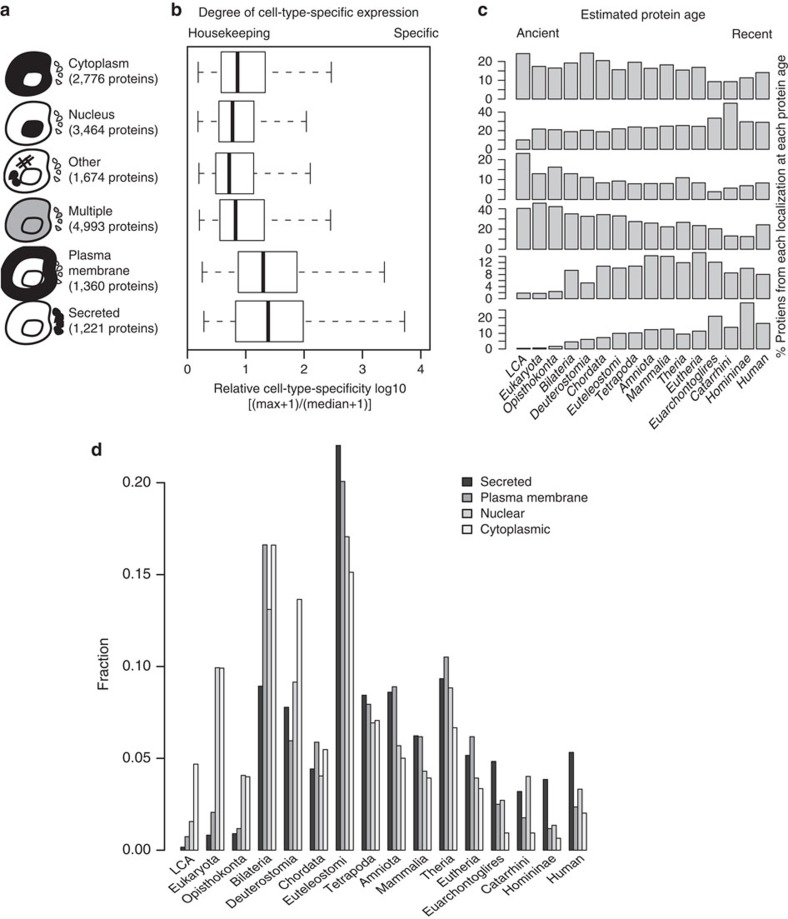
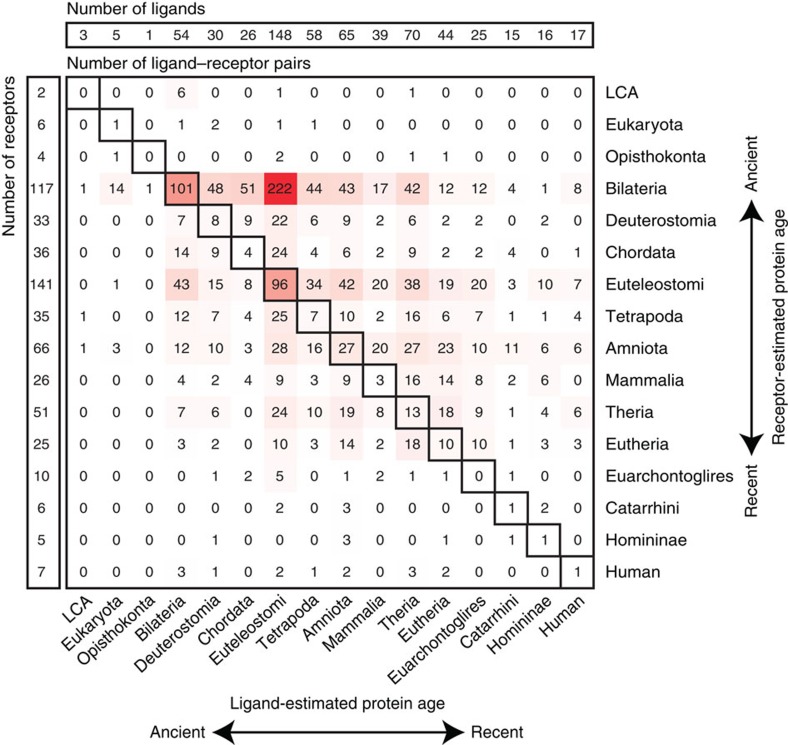
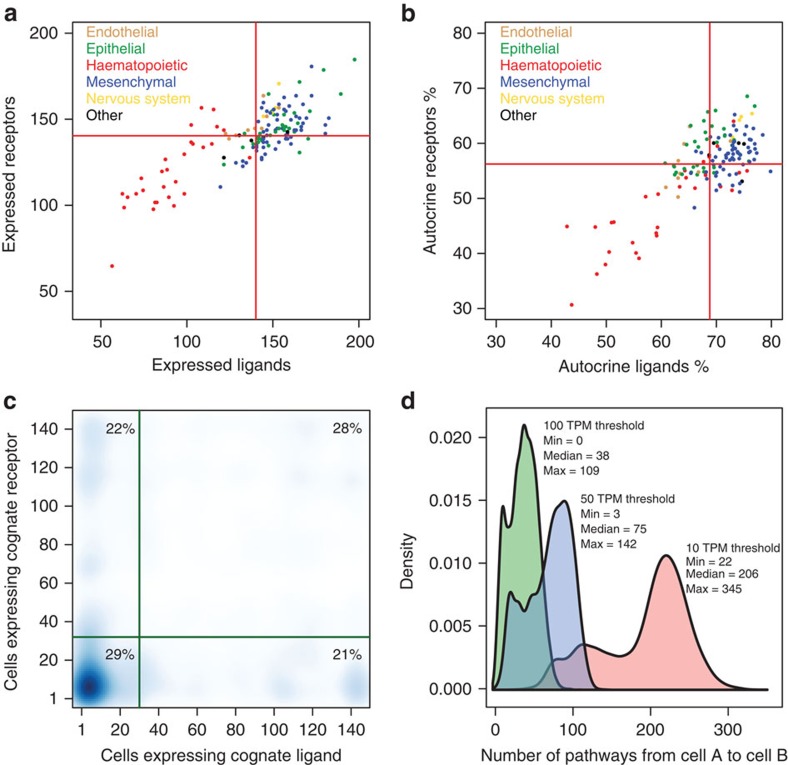
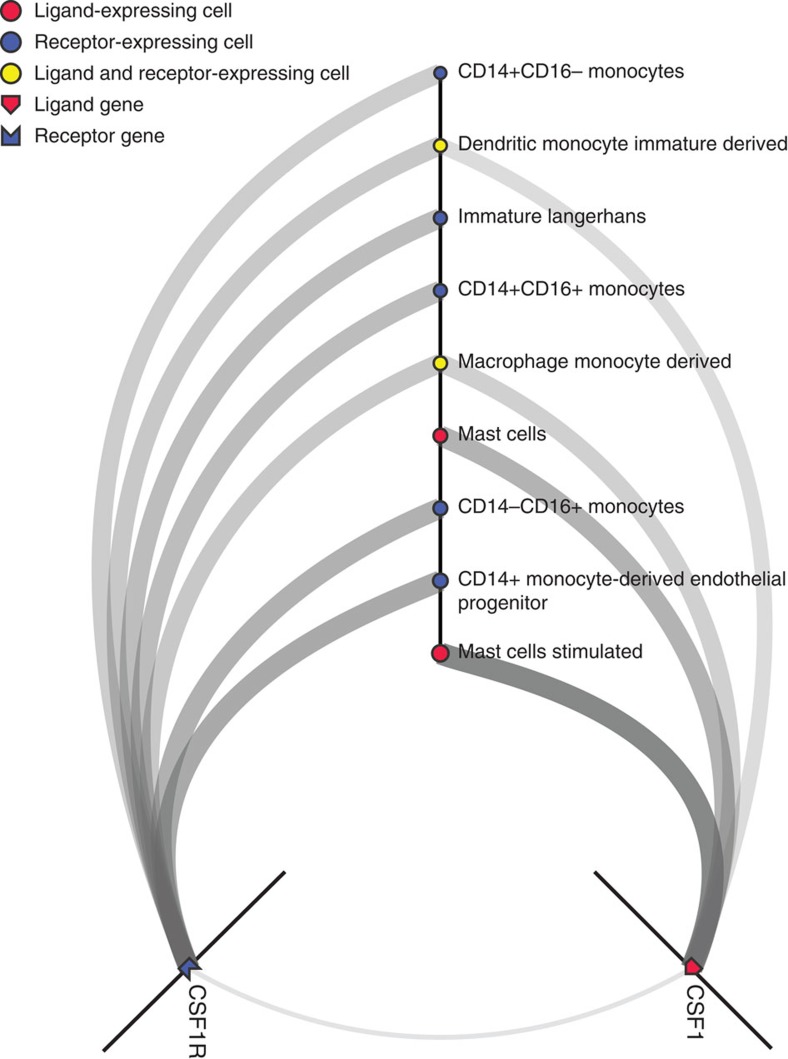
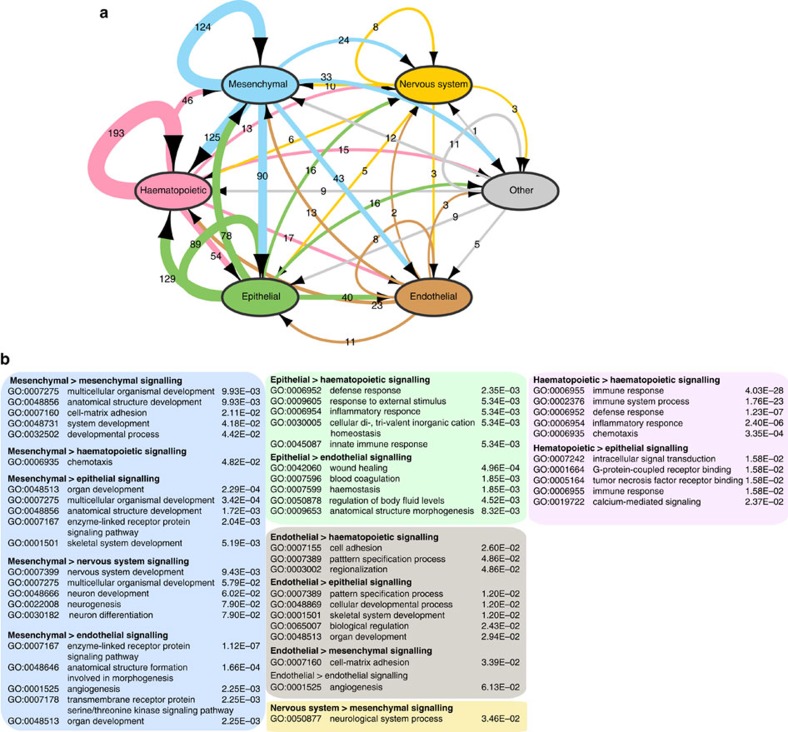
Cell-to-cell communication across multiple cell types and tissues strictly governs proper functioning of metazoans and extensively relies on interactions between secreted ligands and cell-surface receptors. Herein, we present the first large-scale map of cell-to-cell communication between 144 human primary cell types. We reveal that most cells express tens to hundreds of ligands and receptors to create a highly connected signalling network through multiple ligand-receptor paths. We also observe extensive autocrine signalling with approximately two-thirds of partners possibly interacting on the same cell type. We find that plasma membrane and secreted proteins have the highest cell-type specificity, they are evolutionarily younger than intracellular proteins, and that most receptors had evolved before their ligands. We provide an online tool to interactively query and visualize our networks and demonstrate how this tool can reveal novel cell-to-cell interactions with the prediction that mast cells signal to monoblastic lineages via the CSF1-CSF1R interacting pair.


Figures

Figure 1
Figure 1. Relationship between protein subcellular localization, cell-type specificity and gene ages.
(a) Breakdown of known subcellular localization of protein-coding genes expressed >1 TPM in at least one primary state for which protein ages were available. (b) Interquartile range distributions (whisker boxes) and relative cell-type specificity for each protein subcellular compartment from FANTOM5 primary cell expression profiles. Both secreted and plasma membrane proteins are significantly more cell-type specific than nuclear and cytoplasmic proteins (each Mann–Whitney U-test-adjusted P value<000.1). (c) Relative fractions of proteins at each evolutionary stage for selected subcellular localization (secreted, plasma membrane, nucleus, cytoplasmic and other) using the methods of Wagner. All fractions at a given age add to 100%. (d) As in c but scaled for visualization purposes to the number of nuclear proteins. Both secreted (average age: 412.2 mya) and plasma membrane (average age: 517.2 mya) proteins are significantly younger than nuclear (average age: 663.1 mya) and cytoplasmic proteins (average age: 855.1 mya), each Mann–Whitney U-test-adjusted P value<000.1. Note: exact numbers of proteins for each subcellular localization class in each phylostrata are available in Supplementary Data 1.
Figure 2
Figure 2. Comparative age of genes encoding receptors and ligands.
Top and left panels list the number of ligands and receptors estimated to have arisen at each phylostratum using the method of Wagner. Middle panel shows the number of ligand–receptor pairs observed in a given phylostrata. Intensity of red scales with the number of pairs. Note: many interactions (297 pairs) appeared at the same evolutionary stage (diagonal boxes), but we also observe a significant enrichment for 1,081 pairs where the receptor had appeared before the ligand as compared with 431 pairs, where the ligand had appeared first (binomial one-sided P value<0.001; 95% confidence interval [0.695, 1]).
Figure 3
Figure 3. Summary statistics of ligand and receptor usage in human primary cells.
(a,b) Each data-point corresponds to a primary cell type. Colours indicate broad lineage classes. (a) Number of ligands (x-axis) versus numbers of receptors (y-axis) expressed in each cell type. (b) Autocrine signalling in primary cell types. X-axis shows the fraction of ligands expressed by a given cell where the receptor is also expressed on the same cell. Y-axis shows the reciprocal for the fraction of receptors on a given cell where the ligand is also expressed. The red lines in a,b show the mean numbers of ligands or receptors in each plot. (c) Density plot showing the number of cells in which each cognate ligand–receptor pair is expressed. Medians are shown as green lines. For all plots in ac a threshold of 10 TPM was used. (d) Distribution of the number of possible ligand–receptor paths between ligand-secreting cell A and receptor-expressing cell B calculated for all 144 × 144 possible cell-pair permutations across 10, 50 and 100 TPM CAGE detection thresholds.
Figure 4
Figure 4. Ligand–receptor signalling network interface (hive view).
The results of a search for the CSF1–CSF1R ligand–receptor pair, filtered for the top cell-to-cell paths (ranked by the product of CSF1 and CSF1R expression). In this network, stimulated mast cells express the highest levels of CSF1 (1,109 TPM), while CD14+ derived endothelial progenitor cells express the highest levels of CSF1R (699 TPM). Users can select cells and/or ligand–receptor (LR) pairs of interest and filter edges and nodes based on expression levels of L and R. The interface is available at: http://fantom.gsc.riken.jp/5/suppl/Ramilowski_et_al_2015/.
Figure 5
Figure 5. Enrichment of multicellular processes in the max-signalling pair network.
About 1287 ligand–receptor (LR) pairs where the receptor (R) and the ligand (L) are expressed above 10 TPM in at least 1 primary cell state are considered. For each LR pair, the cell expressing the highest level of L and highest level of R are considered the major-signalling pair. The number of major-signalling pairs for all LR are then counted for all cell types profiled and summarized into intra- and inter-lineage signalling. (a) Summary network showing the level of signalling across and within lineages. Edges are scaled and numbered with the number of pairs between broadcasting and target cell. (b) Gene Ontology enrichment analysis of receptors and ligands involved in signalling between different lineages. The background gene set was the full set of receptors and ligands shown in a, and the test sets are the genes from the pairs shown on the edges. Only the top five biological processes with at least five enriched genes and their Benjamini-corrected P values are shown. Number of cell types considered in each lineage are: mesenchymal (63), nervous system (4), other (5), endothelial (9), epithelial (34) and haematopoietic (29).

References

    1. Grosberg R. K. & Strathmann R. R. The evolution of multicellularity: a minor major transition? Annu. Rev. Ecol. Evol. Syst. 38, 621–654 (2007).
    1. Pires-daSilva A. & Sommer R. J. The evolution of signalling pathways in animal development. Nat. Rev. Genet. 4, 39–49 (2003). - PubMed
    1. Eichmann A. et al. Ligand-dependent development of the endothelial and hemopoietic lineages from embryonic mesodermal cells expressing vascular endothelial growth factor receptor 2. Proc. Natl Acad. Sci. USA 94, 5141–5146 (1997). - PMC - PubMed
    1. Gale N. W. et al. Eph receptors and ligands comprise two major specificity subclasses and are reciprocally compartmentalized during embryogenesis. Neuron 17, 9–19 (1996). - PubMed
    1. Kroll K. L. & Amaya E. Transgenic Xenopus embryos from sperm nuclear transplantations reveal FGF signalling requirements during gastrulation. Development 122, 3173–3183 (1996). - PubMed