. 2015 Jul 22:6:7736.
doi: 10.1038/ncomms8736.

STAT3 regulated ARF expression suppresses prostate cancer metastasis

Affiliations

STAT3 regulated ARF expression suppresses prostate cancer metastasis

Jan Pencik et al. Nat Commun. .

Erratum in

  • Erratum: STAT3 regulated ARF expression suppresses prostate cancer metastasis.
    Pencik J, Schlederer M, Gruber W, Unger C, Walker SM, Chalaris A, Marié IJ, Hassler MR, Javaheri T, Aksoy O, Blayney JK, Prutsch N, Skucha A, Herac M, Krämer OH, Mazal P, Grebien F, Egger G, Poli V, Mikulits W, Eferl R, Esterbauer H, Kennedy R, Fend F, Scharpf M, Braun M, Perner S, Levy DE, Malcolm T, Turner SD, Haitel A, Susani M, Moazzami A, Rose-John S, Aberger F, Merkel O, Moriggl R, Culig Z, Dolznig H, Kenner L. Pencik J, et al. Nat Commun. 2015 Oct 26;6:8802. doi: 10.1038/ncomms9802. Nat Commun. 2015. PMID: 26499136 Free PMC article. No abstract available.

Abstract

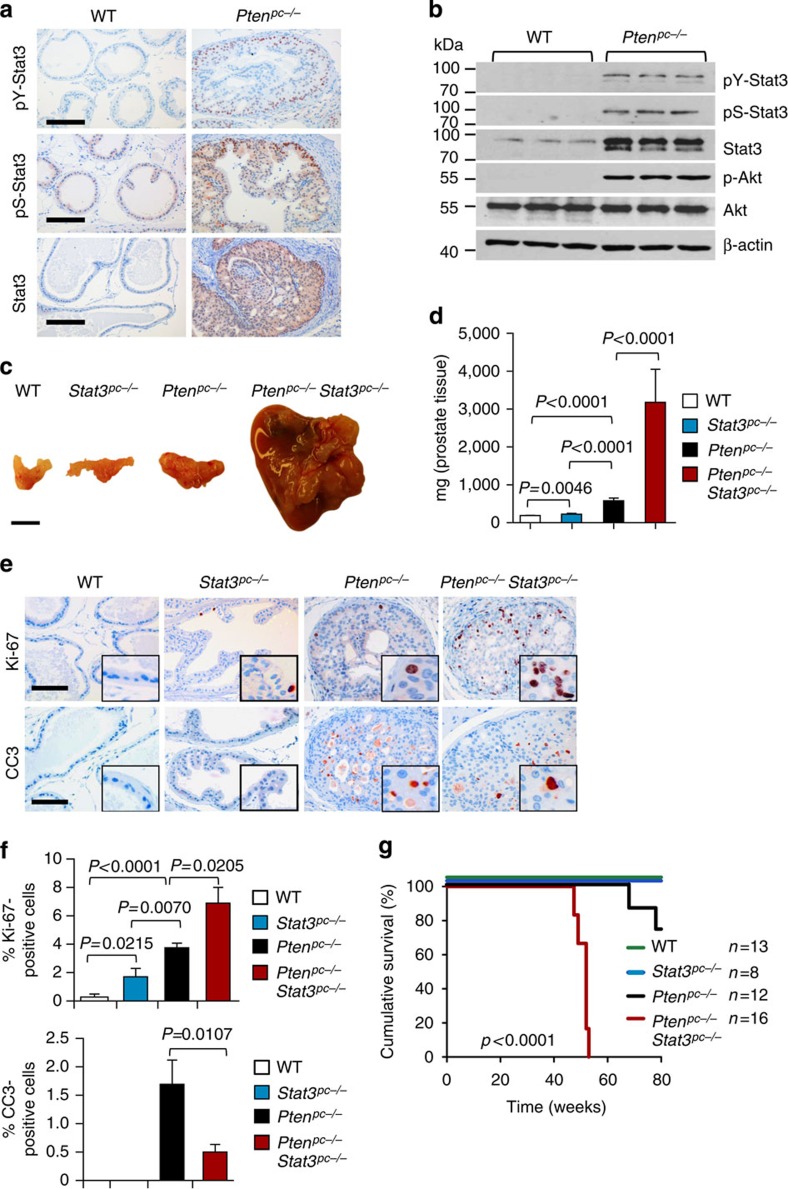
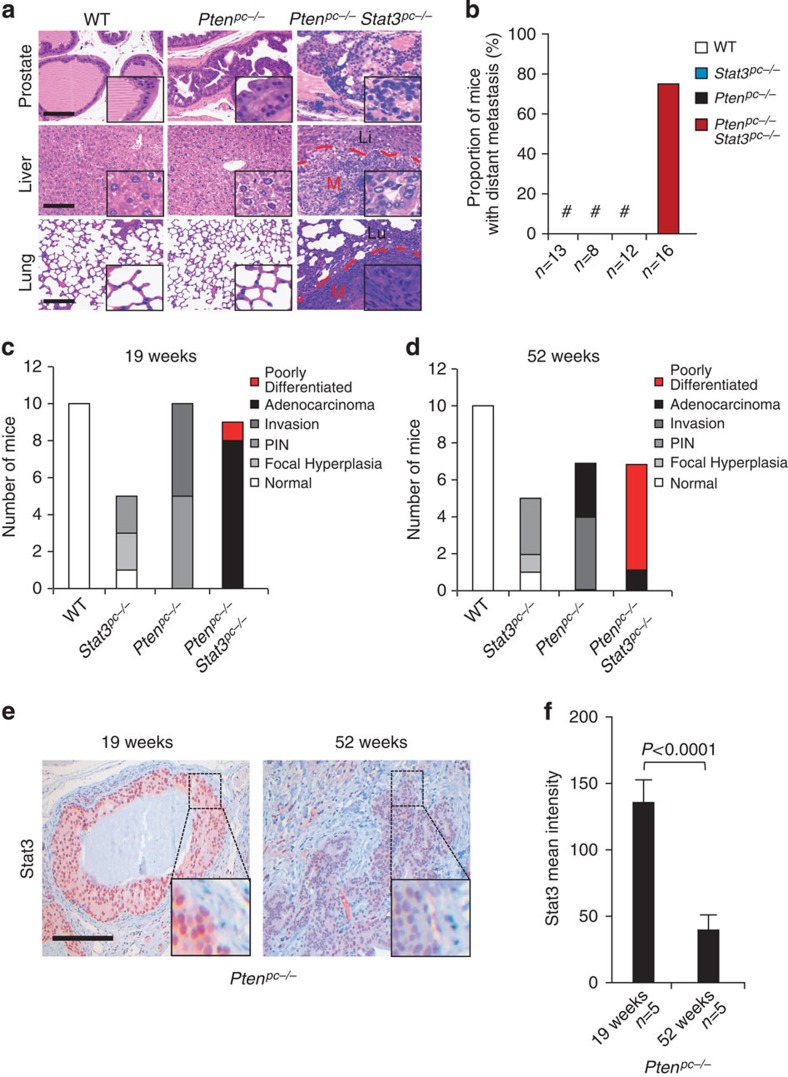
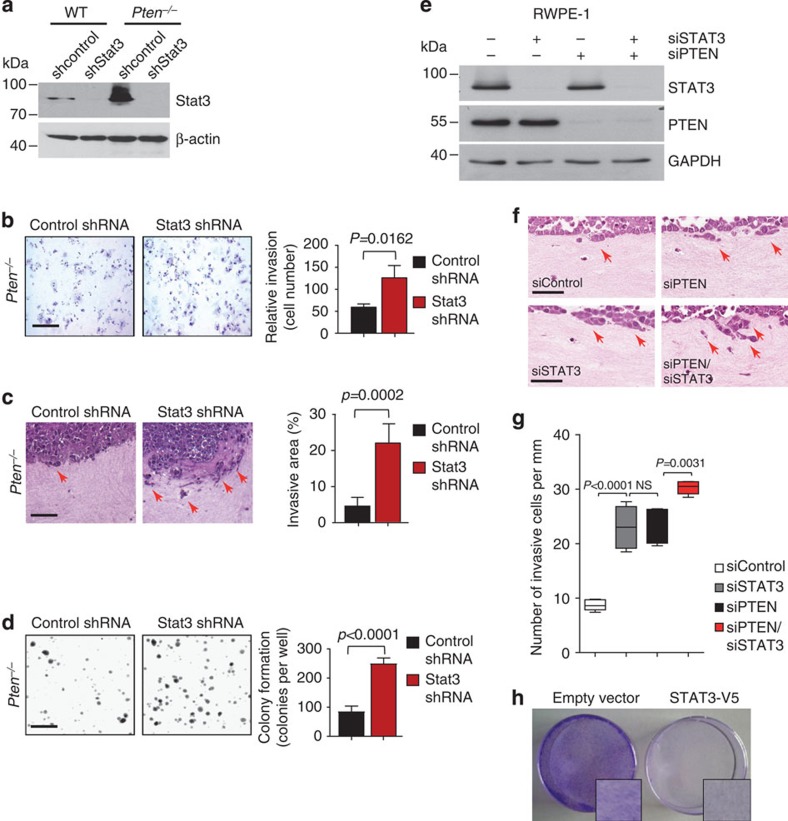
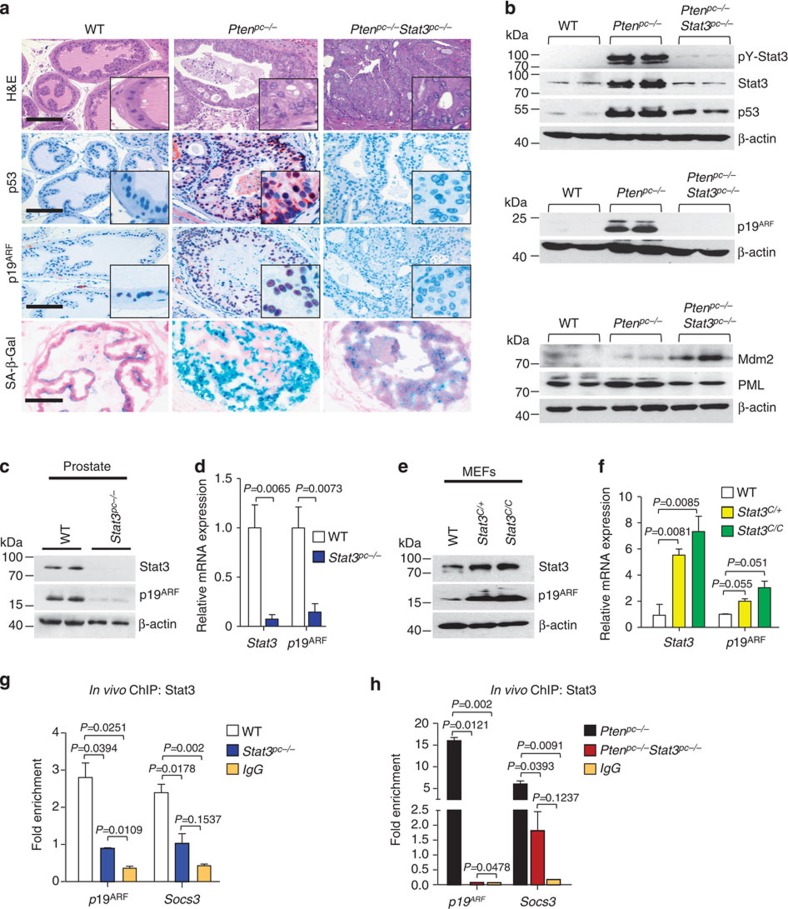
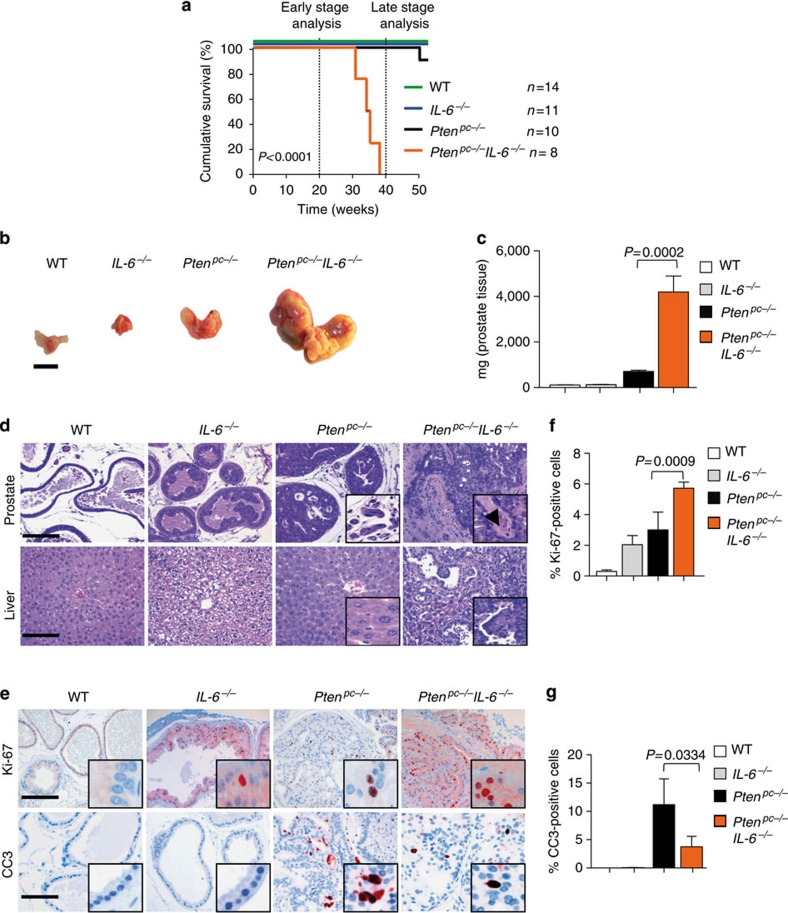
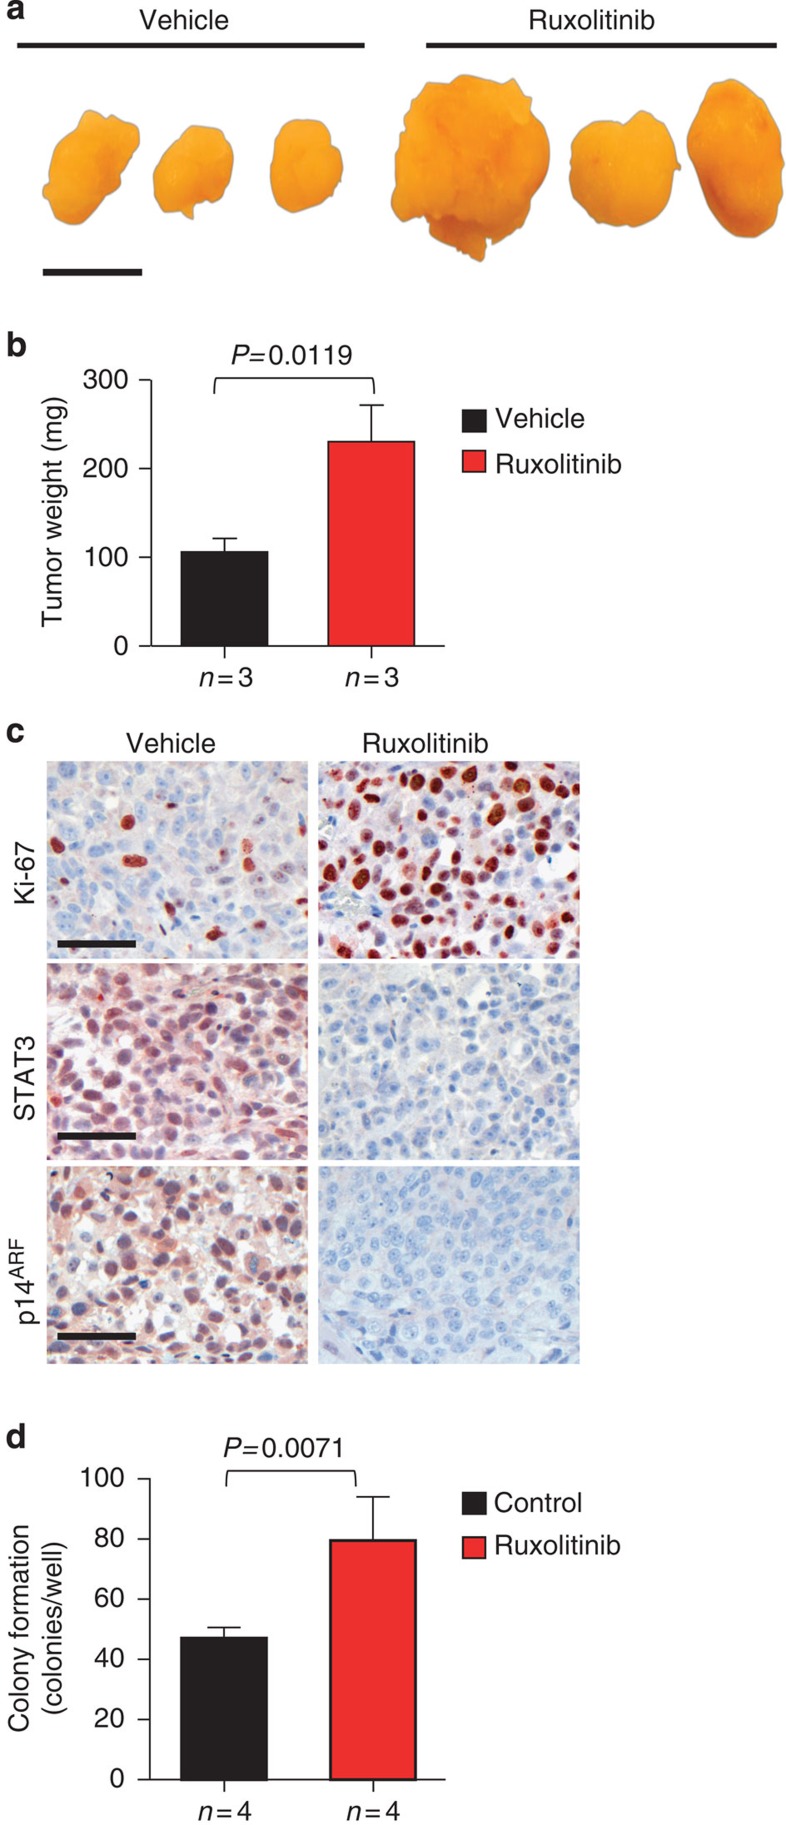
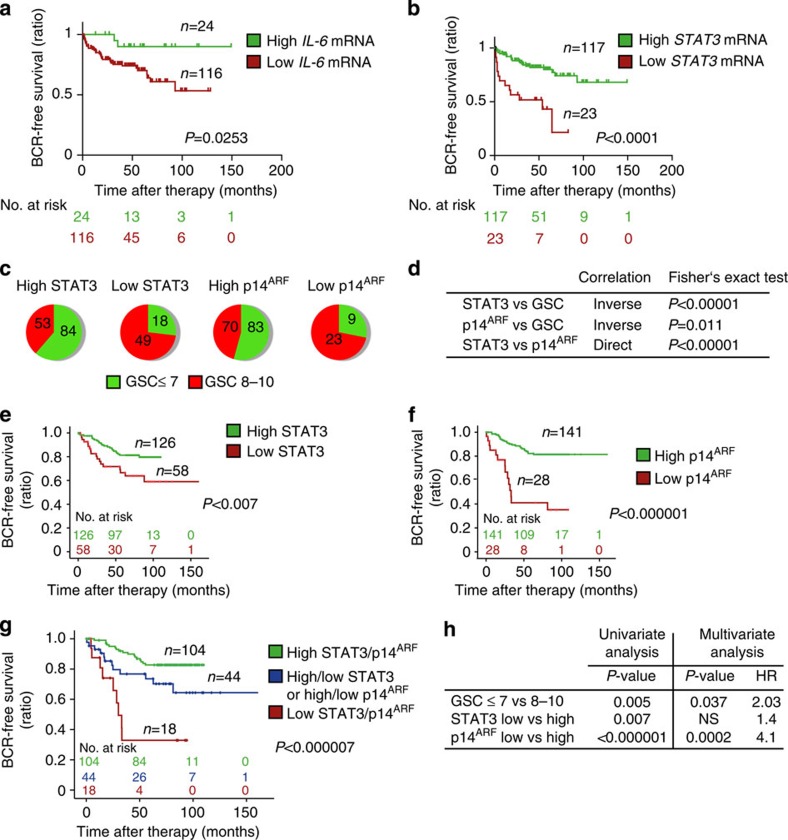
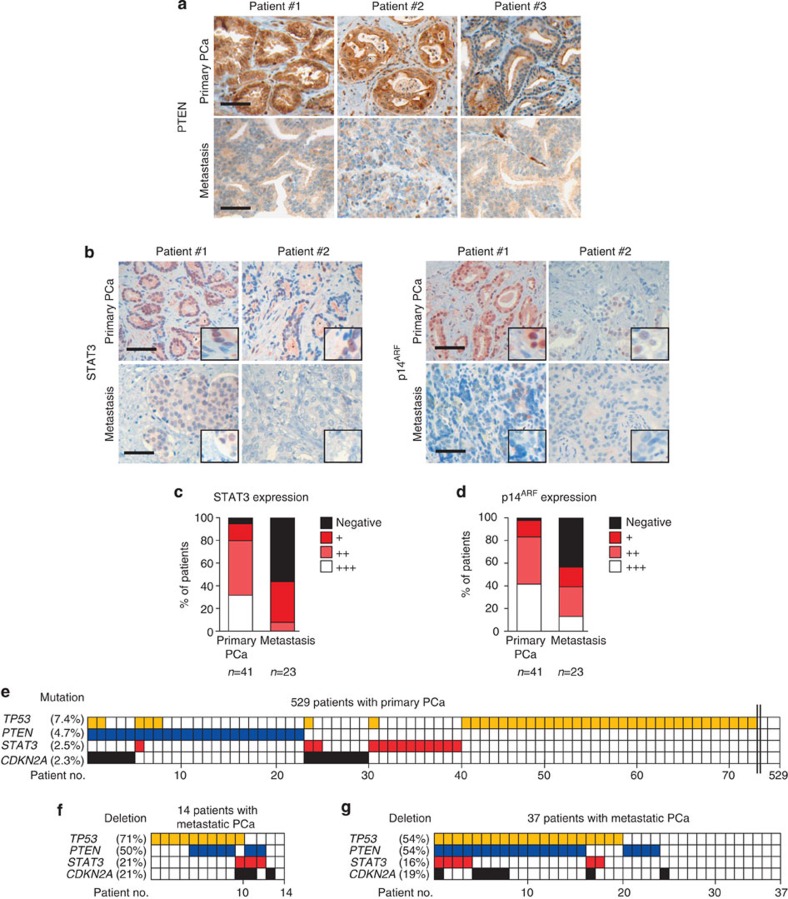
Prostate cancer (PCa) is the most prevalent cancer in men. Hyperactive STAT3 is thought to be oncogenic in PCa. However, targeting of the IL-6/STAT3 axis in PCa patients has failed to provide therapeutic benefit. Here we show that genetic inactivation of Stat3 or IL-6 signalling in a Pten-deficient PCa mouse model accelerates cancer progression leading to metastasis. Mechanistically, we identify p19(ARF) as a direct Stat3 target. Loss of Stat3 signalling disrupts the ARF-Mdm2-p53 tumour suppressor axis bypassing senescence. Strikingly, we also identify STAT3 and CDKN2A mutations in primary human PCa. STAT3 and CDKN2A deletions co-occurred with high frequency in PCa metastases. In accordance, loss of STAT3 and p14(ARF) expression in patient tumours correlates with increased risk of disease recurrence and metastatic PCa. Thus, STAT3 and ARF may be prognostic markers to stratify high from low risk PCa patients. Our findings challenge the current discussion on therapeutic benefit or risk of IL-6/STAT3 inhibition.


Figures

Figure 1
Figure 1. Genetic deletion of Stat3 and Pten triggers progressive prostate tumorigenesis and lethal disease.
(a) Comparison of prostates from WT and Ptenpc−/− mice at 19 weeks of age using immunohistochemical (IHC) analysis of pY-Stat3, pS-Stat3 and Stat3. Scale bars, 100 μm. (b) Protein expression analysis of pY-Stat3, pS-Stat3, Stat3, p-Akt, Akt and β-actin with western blots in 19-week-old prostates from WT and Ptenpc−/− mice. (c) Gross anatomy of representative prostates isolated at 52 weeks of age from WT, Stat3pc−/−, Ptenpc−/− and Ptenpc−/−Stat3pc−/− mice. Scale bars, 10 mm. (d) Prostate weights of 52-week-old WT, Stat3pc−/−, Ptenpc−/− and Ptenpc−/−Stat3pc−/− mice (n=24). Mean values are shown; Data were analysed by one-way analysis of variance with Tukey's multiple comparison test; error bars: s.d. (e) IHC analyses of prostates from 19-week-old WT, Stat3pc−/−, Ptenpc−/− and Ptenpc−/−Stat3pc−/− mice stained for Ki-67 and cleaved caspase 3 (CC3). Scale bars, 100 μm; insets: × 600 magnification. (f) Quantification of cells positive for Ki-67 and CC3 using HistoQuest software (n=5). Data were analysed by Student's t-test and are shown as mean±s.d. (g) Kaplan–Meier cumulative survival analysis revealed a significant (P<0.0001; log-rank test) decrease in lifespan of Ptenpc−/−Stat3pc−/− compared with Ptenpc−/− mice (n=49); WT and Stat3pc−/− mice served as controls.
Figure 2
Figure 2. Co-deletion of Stat3 and Pten enhances prostate cancer transformation and metastatic potential.
(a) Histopathological analysis of primary PCa, livers and lungs at 52 weeks of age from WT, Ptenpc−/− and Ptenpc−/−Stat3pc−/− mice. The dashed red lines encircle areas of advanced liver or lung metastases (M), which are surrounded by normal liver (Li) or normal lung (Lu), respectively. Scale bars, 100 μm; insets: × 600 magnification. (b) Percentage of mice with sites of distant PCa metastases (n=49). (c) Summary of the histological findings of mouse prostates examined at 19 weeks postpartum (p.p.) from WT, Stat3pc−/−, Ptenpc−/− and Ptenpc−/−Stat3pc−/− mice. (d) Summary of the histological findings of mouse prostates examined at 52 weeks p.p. from WT, Stat3pc−/−, Ptenpc−/− and Ptenpc−/−Stat3pc−/− mice. Histological grading and classification of mouse prostates was done according to Chen et al. (e) Stat3 IHC in 19-week- and 52-week-old Ptenpc−/− prostate tumours. Scale bars, 100 μm. (f) Quantification of Stat3 staining in 19-week- and 52-week-old Ptenpc−/− prostate tumours using HistoQuest software, P<0.0001. Data were analysed by Student's t-test and are shown as mean±s.d. (n=5).
Figure 3
Figure 3. Stat3 suppresses colony formation and invasion.
(a) shRNA-mediated knockdown of Stat3 in Pten−/− mouse PCa cells leads to robust decrease of Stat3 levels as demonstrated by western blotting. In all knockdown experiments, scrambled non-target shRNA served as a control (control shRNA/shcontrol). (b) Representative histology of increased matrigel invasion after shRNA-mediated knockdown of Stat3 in Pten-deficient (Pten−/−) mouse PCa cells. Quantification of relative invasion is shown (n=3). Scale bars, 100 μm. (c) Organotypic culture assays of Pten−/− mouse PCa cells in the absence of Stat3 showed capacity to invade into the fibroblast containing collagen gel (red arrows). Scale bars, 50 μm. The invasive area/total tumour cell area was quantified (control shRNA, n=4, shStat3 n=3). (d) Soft agar colony formation of primary Pten−/− mouse PCa cells with shStat3 and controls was quantified (n=3). Scale bars, 200 μm. Data were analysed by Student's t-test and are shown in ce as mean±s.d. (e) Efficient STAT3 and PTEN siRNA-mediated knockdown of RWPE-1 cells was demonstrated by western blot. Scrambled non-target siRNA served as a control (control siRNA/siControl) (f) Organotypic culture of RWPE-1 cells in the presence and absence of STAT3 and/or PTEN cultivated in contact with human prostate stromal fibroblasts seeded in collagen I gels after 8 days of culture. Representative H&E stainings are shown, red arrows indicate invasion, scale bars, 100 μm. (n=3). (g) Quantification of invasion of RWPE-1 cells knocked down for PTEN and/or STAT3 using siRNA (number of invasive cells per mm, n=5 sections for each condition). Data were analysed by one-way analysis of variance with Tukey's multiple comparison test; error bars: s.d. (h) Crystal violet stains of focus formation of STAT3-V5 and empty vector transduced PC3 cells after 4 days of incubation (Supplementary Fig. 4c–e).
Figure 4
Figure 4. Stat3 is a critical regulator of the ARF–Mdm2–p53 tumour suppressor pathway and senescence.
(a) Haematoxilin/eosin (H&E) stains show higher grade PCa in Ptenpc−/−Stat3pc−/− mice compared with Ptenpc−/− mice. Scale bars, 100 μm. IHC analysis of p53, p19ARF and staining for senescence-associated-β-galactosidase activity in prostates from 19-week-old WT, Ptenpc−/− and Ptenpc−/− Stat3pc−/− mice. Scale bars, 100 μm; insets: × 600 magnification. (b) Western blot analysis showing pY-Stat3, Stat3, p53, p19ARF, Mdm2 and PML expression levels in Ptenpc−/−Stat3pc−/− compared with Ptenpc−/− mice. β-actin serves as a loading control. The remaining Stat3 bands in Ptenpc−/−Stat3pc−/− prostates are due to Stat3 stromal expression (Supplementary Fig. 2c). (c) Western blot analysis of Stat3 and p19ARF expression in prostates of 19-week-old WT or Stat3pc−/− mice. β-actin serves as a loading control. (d) qRT–PCR analysis of Stat3 and p19ARF mRNA expression in prostates of 19-week-old WT or Stat3pc−/− mice (n=5 each). Data were analysed by Student's t-test and are shown as mean±s.d. (e) Western blot analysis of Stat3 and p19ARF expression in WT, Stat3C/+ or Stat3C/C MEFs. (f) qRT–PCR analysis of Stat3 and p19ARF transcript levels in WT, Stat3C/+ and Stat3C/C MEFs (n=3 each). Data were analysed by Student's t-test and are shown as mean±s.d. (g) In vivo ChIP analysis of Stat3 binding to p19ARF and Socs3 promoters, respectively, in WT and Stat3pc−/− prostate tissue. Stat3 binding to the Socs3 (ref. 69) promoter, which is a direct Stat3 target served as a positive control. Data were normalized to Cis4200, which served as the negative control. (h) In vivo ChIP analysis of Stat3 binding to the p19ARF and Socs3 promoters in PCa. Note the >15-fold enrichment of Stat3 bound to promoter fragments in Ptenpc−/− compared with Ptenpc−/−Stat3pc−/− tumours. Data in g and h were analysed by one-way analysis of variance with Tukey's multiple comparison test and shown as mean±s.d. (Primer pairs are listed in Supplementary Table 2).
Figure 5
Figure 5. Deletion of IL-6 and Pten triggers progressive prostate tumorigenesis and metastatic disease.
(a) Kaplan–Meier cumulative survival analysis of Ptenpc−/−IL-6−/− compared with Ptenpc−/− mice; WT and IL-6−/− mice served as controls (P<0.0001; log-rank test). (b) Gross anatomy of representative prostates isolated at 38 weeks of age from WT, IL-6−/−, Ptenpc−/− and Ptenpc−/−IL-6−/− mice. Scale bars, 10 mm. (c) Prostate weights of 38-week-old WT, IL-6−/−, Ptenpc−/− and Ptenpc−/−IL-6−/− mice. Mean values are shown; error bars: s.d. (n=43). (d) Histopathological analysis of haematoxilin/eosin-stained primary PCa and liver at 38 weeks of age from WT, IL-6−/−, Ptenpc−/− and Ptenpc−/−IL-6−/− mice. Arrowhead in the inset: area of nerve sheet infiltration. Scale bars, 100 μm. (e) IHC analysis of Ki-67 and CC3 in prostates from 19-week-old WT, IL-6−/−, Ptenpc−/− and Ptenpc−/−IL-6−/− mice. Scale bars, 100 μm. (f,g) Bar graphs indicate percentage of cells positive for Ki-67 and CC3 (e). Protein levels quantification was done with HistoQuest software (n=5). Data from c, f and g were analysed by Student's t-test and are shown as mean±s.d.
Figure 6
Figure 6. JAK1/2 inhibition promotes tumour progression and decreases STAT3 and p14ARF expression.
(a) Gross anatomy of representative LNCaP xenograft tumours treated with ruxolitinib. Mice bearing xenografts were treated with a vehicle or 50 mg kg−1 ruxolitinib. Scale bars, 10 mm. (b) Tumour weight of vehicle-treated mice versus ruxolitinib treatment for 22 days of age-matched SCID beige mice. Mean values are shown; error bars: s.d. (n=3). (c) IHC stainings of Ki-67, STAT3 and p14ARF expression in vehicle versus ruxolitinib-treated xenografted tumours (n=3), scale bar 50 μm. (d) LNCaP cells treated with control (DMSO) or 10 μM ruxolitinib were grown in soft agar for 12 days. Mean values are shown; error bars: s.d. (n=4). Data from b and d were analysed by Student's t-test.
Figure 7
Figure 7. Loss of STAT3 and/or p14ARF expression predicts early BCR in patients with PCa.
(a,b) Kaplan–Meier analysis including number at risk of patients stratified into high or low lL6- and STAT3 mRNA expression predicting biochemical recurrence (BCR) of the Taylor data set. (c) Distribution of STAT3 and p14ARF protein expression with low (≤7) or high (8–10) GSC in tumour specimens from men diagnosed with PCa. (d) Fisher's exact test of data shown in c and correlation of STAT3 to p14ARF expression. (e) Kaplan–Meier analysis of BCR-free survival ratio based on STAT3 protein expression in a panel of 204 PCa patients. (f) Kaplan–Meier analysis of BCR-free survival ratio based on p14ARF protein expression in a panel of 204 PCa patients. (g) Co-expression analyses of BCR-free survival of STAT3 and p14ARF. (h) Univariate and multivariate analyses of GSC, STAT3 or p14ARF protein levels. Data from a,b,e,f and g were analysed by log-rank test.
Figure 8
Figure 8. Loss of STAT3 and ARF in metastases of PCa patients.
(a) Three representative images of PTEN expression determined by IHC analyses in matched patient samples with primary and metastatic PCa (n=5). Scale bars, 100 μm. (b) Representative IHC images of STAT3 and p14ARF expression from primary (n=41) and metastatic (n=23) PCa samples. Scale bars, 100 μm. (c,d) STAT3 and p14ARF staining intensity ranging from undetectable (Negative) to maximal expression levels (+++) in cohorts of primary and metastatic PCa. (e) Graphical representation of TP53, PTEN, STAT3 and CDKN2A mutations in 529 patients with primary PCa71. (f) Graphical representation of TP53, PTEN, STAT3, CDKN2A deletions in 14 metastatic PCa. Data were processed by Affymetrix Genome-Wide Human SNP Array 6.0. (g) Graphic representation of gene deletion analysis of TP53, PTEN, STAT3 and CDKN2A in an independent data set of 37 metastatic PCa samples.

Comment in

References

    1. Jemal A. et al. Global cancer statistics. CA Cancer J. Clin. 61, 69–90 (2011). - PubMed
    1. Cooperberg M. R., Broering J. M., Kantoff P. W. & Carroll P. R. Contemporary trends in low risk prostate cancer: risk assessment and treatment. J. Urol. 178, S14–S19 (2007). - PMC - PubMed
    1. Dimakakos A., Armakolas A. & Koutsilieris M. Novel tools for prostate cancer prognosis, diagnosis, and follow-up. Biomed. Res. Int. 2014, 890697 (2014). - PMC - PubMed
    1. Ost P. et al. Prognostic factors influencing prostate cancer-specific survival in non-castrate patients with metastatic prostate cancer. Prostate 74, 297–305 (2014). - PubMed
    1. Draisma G. et al. Lead time and overdiagnosis in prostate-specific antigen screening: importance of methods and context. J. Natl. Cancer Inst. 101, 374–383 (2009). - PMC - PubMed

Publication types