Review
. 2016 Mar;43(3):544-57.
doi: 10.1002/jmri.25010. Epub 2015 Jul 22.

Pulmonary CT and MRI phenotypes that help explain chronic pulmonary obstruction disease pathophysiology and outcomes

Affiliations
Review

Pulmonary CT and MRI phenotypes that help explain chronic pulmonary obstruction disease pathophysiology and outcomes

Eric A Hoffman et al. J Magn Reson Imaging. 2016 Mar.

Abstract

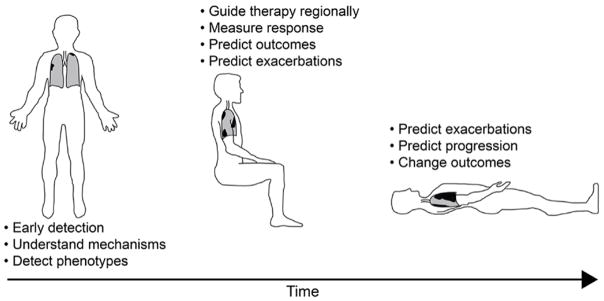
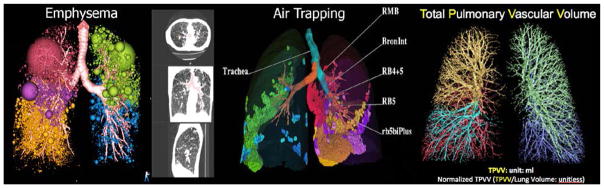
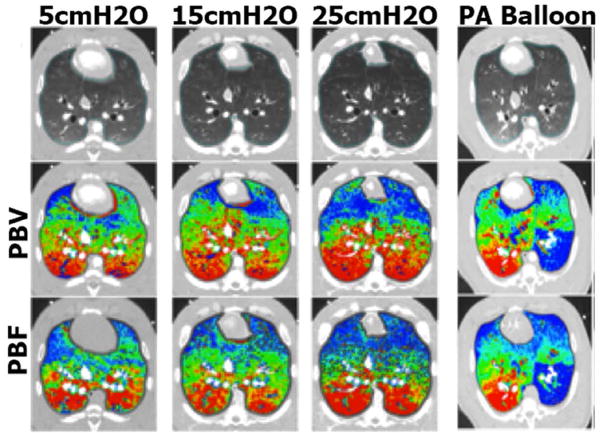
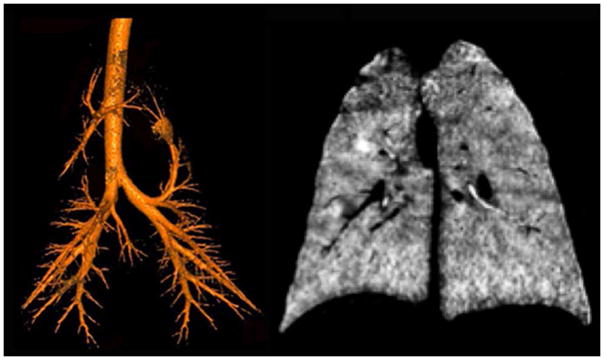
Pulmonary x-ray computed tomographic (CT) and magnetic resonance imaging (MRI) research and development has been motivated, in part, by the quest to subphenotype common chronic lung diseases such as chronic obstructive pulmonary disease (COPD). For thoracic CT and MRI, the main COPD research tools, disease biomarkers are being validated that go beyond anatomy and structure to include pulmonary functional measurements such as regional ventilation, perfusion, and inflammation. In addition, there has also been a drive to improve spatial and contrast resolution while at the same time reducing or eliminating radiation exposure. Therefore, this review focuses on our evolving understanding of patient-relevant and clinically important COPD endpoints and how current and emerging MRI and CT tools and measurements may be exploited for their identification, quantification, and utilization. Since reviews of the imaging physics of pulmonary CT and MRI and reviews of other COPD imaging methods were previously published and well-summarized, we focus on the current clinical challenges in COPD and the potential of newly emerging MR and CT imaging measurements to address them. Here we summarize MRI and CT imaging methods and their clinical translation for generating reproducible and sensitive measurements of COPD related to pulmonary ventilation and perfusion as well as parenchyma morphology. The key clinical problems in COPD provide an important framework in which pulmonary imaging needs to rapidly move in order to address the staggering burden, costs, as well as the mortality and morbidity associated with COPD.

Keywords: COPD; dual energy CT; phenotypes; pulmonary MRI; pulmonary ventilation and perfusion; quantitative CT.


Figures

Figure 1
Figure 1. Current COPD challenges
Three distinct COPD phases are outlined in schematic: 1) Early disease when patients are asymptomatic, clinical measurements typically do not reflect disease but imaging measurements provide evidence of mild emphysema, airways disease, perfusion heterogeneity, LV filling defects, etc. 2) Mild-moderate COPD as patients become symptomatic, clinical measurements are modestly abnormal while imaging measurements can be markedly abnormal revealing regional disease, LV filling defects can continue to worsen, co-morbidities can begin to appear including aortic aneurysms, coronary disease, lung nodules, osteoporosis, 3) Severe COPD with patients reporting severe symptoms and activity impairment, clinical measurements of airflow limitation, diffusing capacity of carbon monoxide and gas trapping are markedly abnormal and yet patients still can be differentiated into those with predominantly airway or predominantly parenchymal disease with marked differences in the distribution of parenchymal destruction.
Figure 2
Figure 2
CT Measurements: Threshold-based evaluation of the extemt and distribution of emphysema at full inspiration (far left panel), amount and air trapping at expiration to functional residual capacity (FRC) or residual volume (RV) (middle panels), airway geometry assessed in conjunction with distribution patterns of emphysema and air trapping (middle panels), vascular anatomy (total pulmonary vascular volume and total pulmonary arterial volume assessed from full inspiratory non-contrast enhanced CT scans (far right panel). Colour-coding differentiate between lung lobes.
Figure 3
Figure 3
Gray-scale (top row), PBV (middle row), and PBF (lower row) MDCT scans. (Columns 1–3) Color map comparison of CT-derived PBF and PBV from pig imaged at 3 different lung volumes, used to achieve a range of pulmonary perfusion values. (Column 4) Color map comparison of CT-derived PBF (dynamic axial scanning) and PBV (dual energy spiral scanning) from pig studied with a balloon partially inflated in a left lower lobe pulmonary artery. Color coding is the same for each condition: percent of total PBV or PBV with low values in blue and high values in red. Modified from .
Figure 4
Figure 4
Dual Energy CT scans of the airway tree (left) and lung parenchyma (right) of an anesthetized pig. For the scan in the left panel, the lung was inflated to 25 cmH2O airway pressure using room air. An amount of air approximately equal in volume to the central airway tree was removed and replaced with xenon gas. This provided a way to identify the central airway tree without the use of more conventional airway segmentation methods. In the right panel, the lungs were inflated from functional residual capacity to total lung capacity via a gas mixture of 80%xenon and 20%oxygen. Material decomposition image processing was used to generate an image representing the regional distribution of the inhaled xenon gas.
Figure 5
Figure 5
MRI measurements of COPD for different GOLD stages including: emphysema (ADC, 1H MRI signal intensity), and ventilation (3He MRI and FDMRI).
Figure 6
Figure 6
MR ventilation imaging reflecting the effects of both emphysema (slow filling units) and airways disease (airway obstruction) – a unique predictor of COPD exacerbations in mild disease.

References

    1. Vestbo J, Hurd SS, Agusti AG, et al. Global strategy for the diagnosis, management, and prevention of chronic obstructive pulmonary disease: GOLD executive summary. Am J Respir Crit Care Med. 2013 Feb 15;187(4):347–365. - PubMed
    1. Jones PW. Health status and the spiral of decline. Copd. 2009 Feb;6(1):59–63. - PubMed
    1. Milne S, King GG. Advanced imaging in COPD: insights into pulmonary pathophysiology. Journal of thoracic disease. 2014 Nov;6(11):1570–1585. - PMC - PubMed
    1. Sverzellati N, Molinari F, Pirronti T, Bonomo L, Spagnolo P, Zompatori M. New insights on COPD imaging via CT and MRI. International journal of chronic obstructive pulmonary disease. 2007;2(3):301–312. - PMC - PubMed
    1. van Beek EJ, Hoffman EA. Functional imaging: CT and MRI. Clinics in chest medicine. 2008 Mar;29(1):195–216. vii. - PMC - PubMed

MeSH terms