. 2015 Oct;14(10):2800-13.
doi: 10.1074/mcp.O114.042267. Epub 2015 Jul 21.

Identification of a Set of Conserved Eukaryotic Internal Retention Time Standards for Data-independent Acquisition Mass Spectrometry

Affiliations

Identification of a Set of Conserved Eukaryotic Internal Retention Time Standards for Data-independent Acquisition Mass Spectrometry

Sarah J Parker et al. Mol Cell Proteomics. 2015 Oct.

Abstract

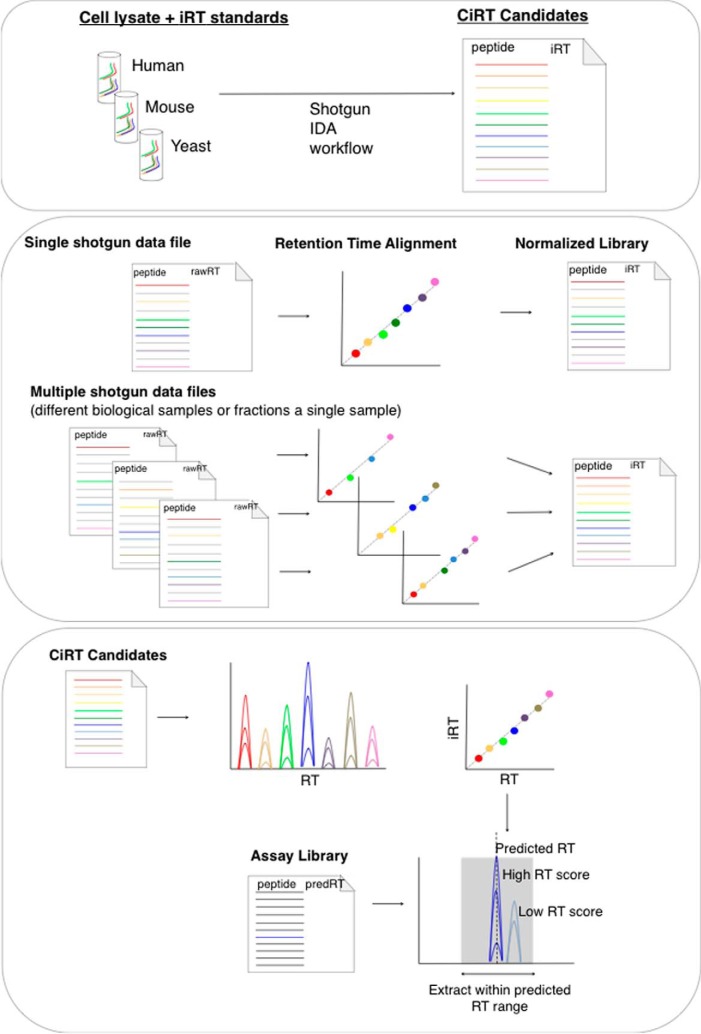
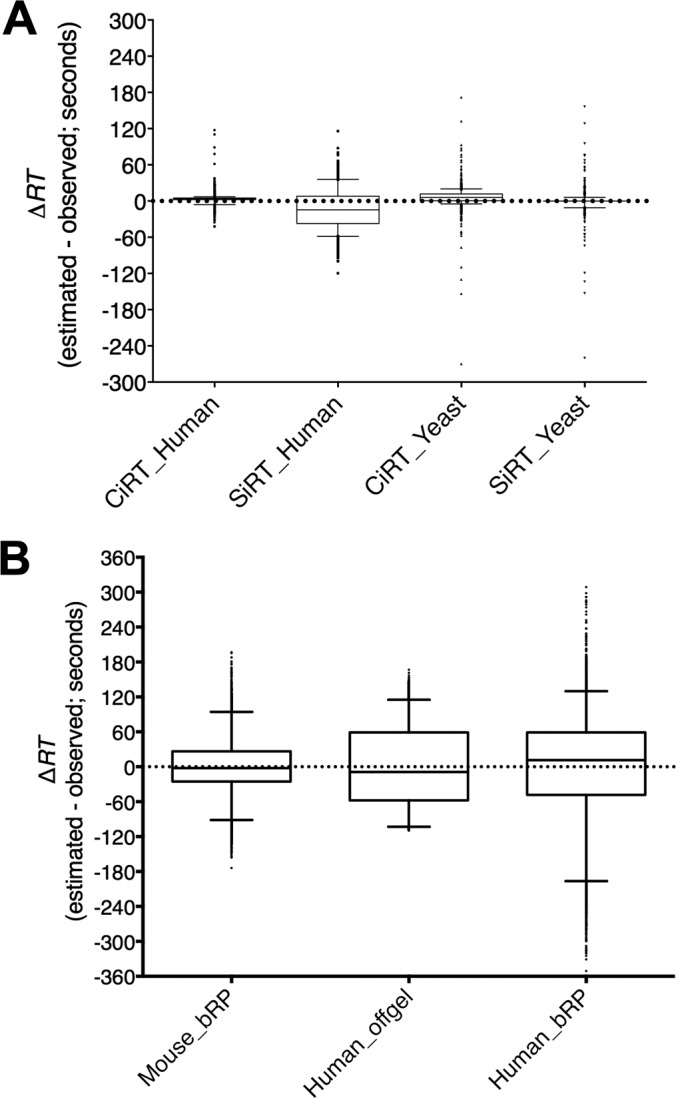
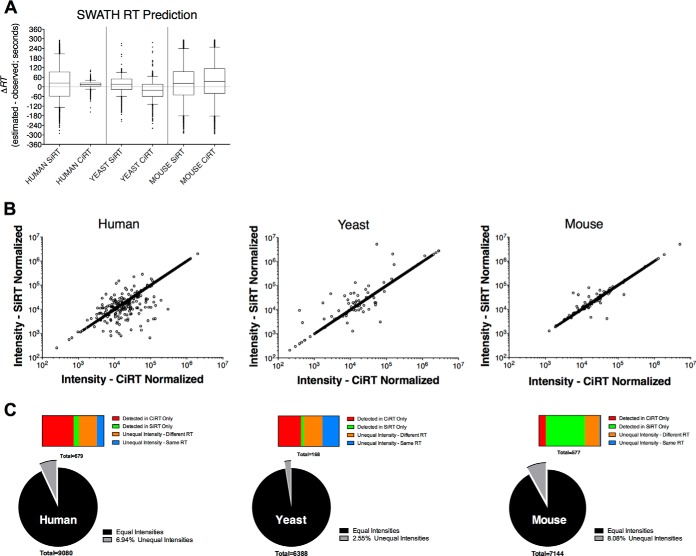
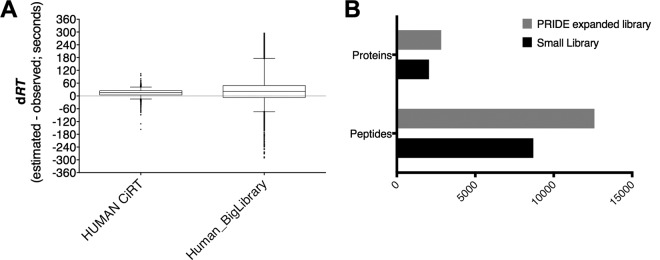
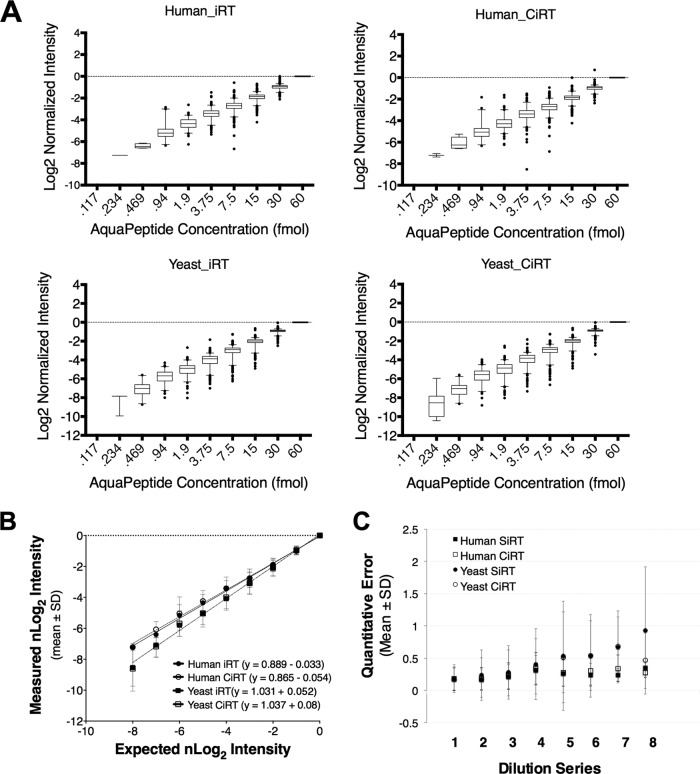
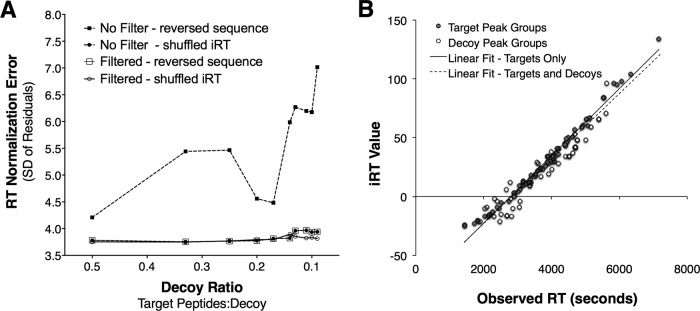
Accurate knowledge of retention time (RT) in liquid chromatography-based mass spectrometry data facilitates peptide identification, quantification, and multiplexing in targeted and discovery-based workflows. Retention time prediction is particularly important for peptide analysis in emerging data-independent acquisition (DIA) experiments such as SWATH-MS. The indexed RT approach, iRT, uses synthetic spiked-in peptide standards (SiRT) to set RT to a unit-less scale, allowing for normalization of peptide RT between different samples and chromatographic set-ups. The obligatory use of SiRTs can be costly and complicates comparisons and data integration if standards are not included in every sample. Reliance on SiRTs also prevents the inclusion of archived mass spectrometry data for generation of the peptide assay libraries central to targeted DIA-MS data analysis. We have identified a set of peptide sequences that are conserved across most eukaryotic species, termed Common internal Retention Time standards (CiRT). In a series of tests to support the appropriateness of the CiRT-based method, we show: (1) the CiRT peptides normalized RT in human, yeast, and mouse cell lysate derived peptide assay libraries and enabled merging of archived libraries for expanded DIA-MS quantitative applications; (2) CiRTs predicted RT in SWATH-MS data within a 2-min margin of error for the majority of peptides; and (3) normalization of RT using the CiRT peptides enabled the accurate SWATH-MS-based quantification of 340 synthetic isotopically labeled peptides that were spiked into either human or yeast cell lysate. To automate and facilitate the use of these CiRT peptide lists or other custom user-defined internal RT reference peptides in DIA workflows, an algorithm was designed to automatically select a high-quality subset of datapoints for robust linear alignment of RT for use. Implementations of this algorithm are available for the OpenSWATH and Skyline platforms. Thus, CiRT peptides can be used alone or as a complement to SiRTs for RT normalization across peptide spectral libraries and in quantitative DIA-MS studies.


Figures

Fig. 1.
Fig. 1.
A schema depicting the process of identifying internal iRT normalization peptides. Top Panel: Samples of lysate are digested with trypsin, spiked with synthetic iRT calibration peptides (SiRT), and analyzed by data-dependent mass spectrometry. The most abundant peptides, or those identified across multiple species, are selected as candidates and iRT values are assigned using the linear regression created by referencing the external iRT calibrant peptides. Middle panel: Retention time is normalized across spectral libraries by replacing the SiRT peptides with the selected CiRT peptides in the SpectraST iRT normalization step. For libraries generated from multiple fractions of peptides, larger CiRT lists are required. Bottom panel: Prediction of retention time in SWATH-MS data files using CiRTs requires very high intensity, low signal-to-noise calibration candidates. A filtered list of CiRT normalization peptides, created either manually or via the newly written algorithm for CiRT refinement described here, are extracted from the SWATH-MS data and a linear regression is computed to transform iRT to observed RT for that file. The subsequent linear equation is used to predict retention time of a given peptide in the assay library within a user-specified confidence window, typically ± 5 min. Candidate peak groups selected within this window are scored using the OpenSWATH scoring algorithm, where the difference between the experimental retention time relative to the predicted retention time of a given peptide is scored and contributes to the composite score used to assess confidence in peak group identification.
Fig. 2.
Fig. 2.
Assay library retention time normalization between synthetic and internal calibration peptides. The difference between observed and predicted retention time (ΔRT) was calculated for each peptide included in the assay libraries generated from the same raw files of human and yeast lysate (A), and from three different sets of fractionated peptides from mouse (generated in house) and human cell lysate (data downloaded from the PRIDE MS data repository), separated by either basic reverse phase (bRP) or OFFGEL fractionation methods (B). Retention times were predicted separately using linear regression equations created from a large list of 113 common iRT (CIRT) peptides or the 11 synthetic iRT peptides (SiRT). Data are presented as box and whisker plots, with the middle quartiles surrounding the median for the entire assay library represented by the box, whiskers showing the 95% data range and the upper and lower 2.5% of all values plotted as individual data points. Note: for some data sets the distribution of ΔRT was within such a small range that the box and whisker plots appear as a single horizontal line. Y-axis ranges were set at values that demonstrate the full range of error.
Fig. 3.
Fig. 3.
Accuracy between retention time prediction methods for peak groups extraction from SWATH-MS data files. A, The difference between observed and predicted retention time (ΔRT) of each of the confidently identified (FDR < 1%) peak groups defined by an RT-normalized assay library and extracted from a human, yeast, or mouse SWATH-MS run are compared between conditions where the assay library and SWATH-MS normalization were performed with synthetic iRT (SiRT) or common internal iRT (CiRT) normalization peptides. Data are presented as box and whisker plots, with the middle quartiles surrounding the median for the entire assay library represented by the box, whiskers showing the 95% data range and the upper and lower 2.5% of all values plotted as individual data points. B, Correlation between the intensity of a given peptide as determined by the SiRT or CiRT normalization procedure. Each dot represents the summed intensity of all transitions extracted for a given peptide peak group from the same raw file, with the only difference being the method of RT normalization. C, Distribution of matching and mis-matching peptide peak group intensities for the human (left) and yeast (middle) and mouse (right) derived samples. Pie charts depict overall distribution peptides with matching or mismatching intensity values between CiRT and SiRT aligned data sets. Horizontal bars show distribution of peptides among different categories explaining mismatched intensity values.
Fig. 4.
Fig. 4.
Expansion of peptide assay library using archived data sets improves SWATH-MS quantitative depth. A, The precision of RT prediction within the same SWATH-MS data file was slightly lower but still comparably accurate between a larger peptide assay library comprised of human peptide data from three diverse sources and the original, small human library built from the same lysate digest as the SWATH-MS data being analyzed. B, Use of the expanded library increased the number of nonredundant peptide sequences and corresponding proteins quantified from the same DIA-MS data file relative to the smaller library.
Fig. 5.
Fig. 5.
Use of internal retention time prediction peptides does not alter the accuracy of peptide quantitation by SWATH-MS. A, Synthetic, heavy peptides were spiked into cell lysate from either human-derived (upper panel) or yeast (lower panel) cells at progressively twofold decreasing concentrations from 30 femtomoles to .058 femtomoles on column. Assay libraries, normalized to iRT, for the 340 synthetic peptides were used to extract peak groups from SWATH files, and the intensity of a given peak group was normalized to its observed intensity at 30 fmol and set to log scale with a base of 2. Perfectly accurate quantification would therefore represent a single unit increase between dilution steps. Quantification subsequent to synthetic iRT prediction is shown on the left and the CiRT shown on the right. B, Comparison of the linear estimate comparing the mean observed normalized Log2 Intensities plotted against that which would be expected based on the actual concentration of heavy peptide spiked into a given sample. Each data point represents the mean ± standard deviation (S.D.) of nLog2 intensity across all peptides observed at a given concentration, C, A plot of the mean absolute error calculated for each dilution step of the 10 × 2-fold dilution series (described in methods). No peptides were detected in the lowest concentration, and as such there are 8 dilution steps used to calculate quantification error see methods for the equation used for error estimation). Values are presented as mean ± S.D. at each dilution step, for each RT normalization method (CiRT versus SiRT) in Yeast and Human samples.
Fig. 6.
Fig. 6.
Robustness of the computed linear alignment in the presence of noise signal when using a jackknife approach for outlier removal. A, Increasing the number of noise signals from 2× to 10× impacts the error of the linear model (measured as standard deviation of the residuals of the correct signals) only substantially if peak quality is not taken into account. If a peak quality threshold is used and low-quality peaks are discarded (open symbols), the error of the linear model is almost constant even if a large number of false signals are present. B, Example robust regression in the presence of a 10-fold excess of noise peaks using the jackknife approach to remove outlier signal. In red are all known correct datapoints and in black are noise datapoints that by chance correlate with the correct ones and thus pull through the filtering. The dashed black regression line was obtained from all shown datapoints (R2 = 0.95), the solid black regression line was the regression model obtained from only the known correct datapoints (R2 = 0.98). The measured error of the linear model is 3.86 (whereas the error when only using the known correct datapoints is 3.76) and while achieving an accuracy of 94.9%.

Similar articles

Cited by

References

    1. Escher C., Reiter L., MacLean B., Ossola R., Herzog F., Chilton J., MacCoss M. J., Rinner O. (2012) Using iRT, a normalized retention time for more targeted measurement of peptides. Proteomics 12, 1111–1121 - PMC - PubMed
    1. Klammer A. A., Yi X., MacCoss M. J., Noble W. S. (2007) Improving tandem mass spectrum identification using peptide retention time prediction across diverse chromatography conditions. Anal. Chem. 79, 6111–6118 - PubMed
    1. Pfeifer N., Leinenbach A., Huber C. G., Kohlbacher O. (2009) Improving peptide identification in proteome analysis by a two-dimensional retention time filtering approach. J. Proteome Res. 8, 4109–4115 - PubMed
    1. Gallien S., Peterman S., Kiyonami R., Souady J., Duriez E., Schoen A., Domon B. (2012) Highly multiplexed targeted proteomics using precise control of peptide retention time. Proteomics 12, 1122–1133 - PubMed
    1. Bateman N. W., Goulding S. P., Shulman N. J., Gadok A. K., Szumlinski K. K., MacCoss M. J., Wu C. C. (2014) Maximizing peptide identification events in proteomic workflows using data-dependent acquisition (DDA). Mol. Cell. Proteomics 13, 329–338 - PMC - PubMed

Publication types

LinkOut - more resources