. 2015 Aug 4;112(31):E4236-45.
doi: 10.1073/pnas.1510510112. Epub 2015 Jul 21.

Simultaneous deletion of the methylcytosine oxidases Tet1 and Tet3 increases transcriptome variability in early embryogenesis

Affiliations

Simultaneous deletion of the methylcytosine oxidases Tet1 and Tet3 increases transcriptome variability in early embryogenesis

Jinsuk Kang et al. Proc Natl Acad Sci U S A. .

Abstract

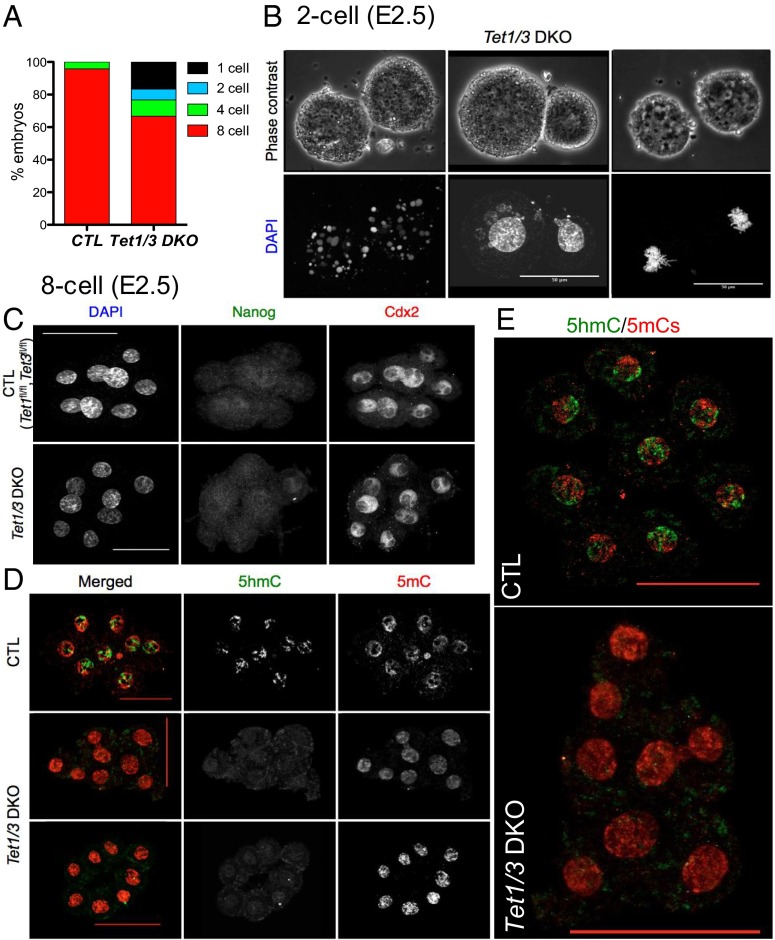
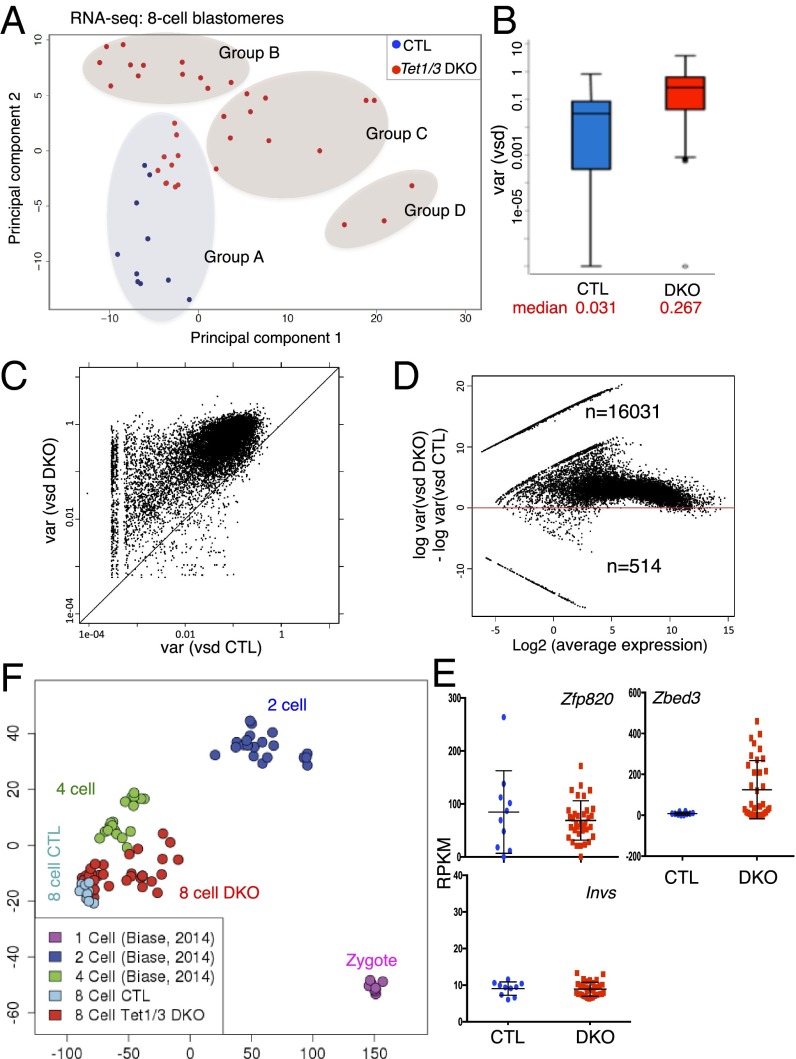
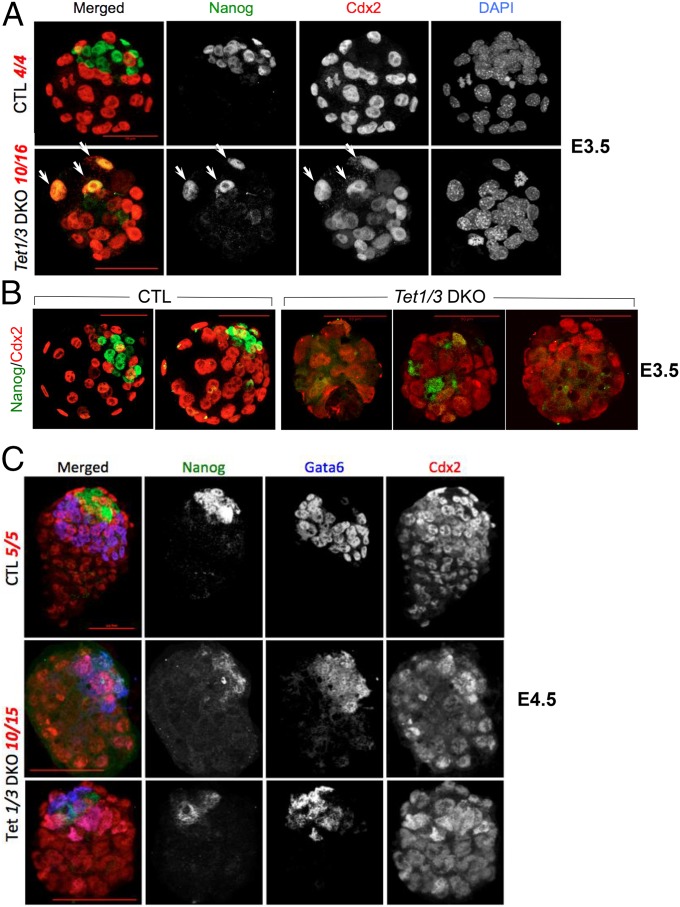
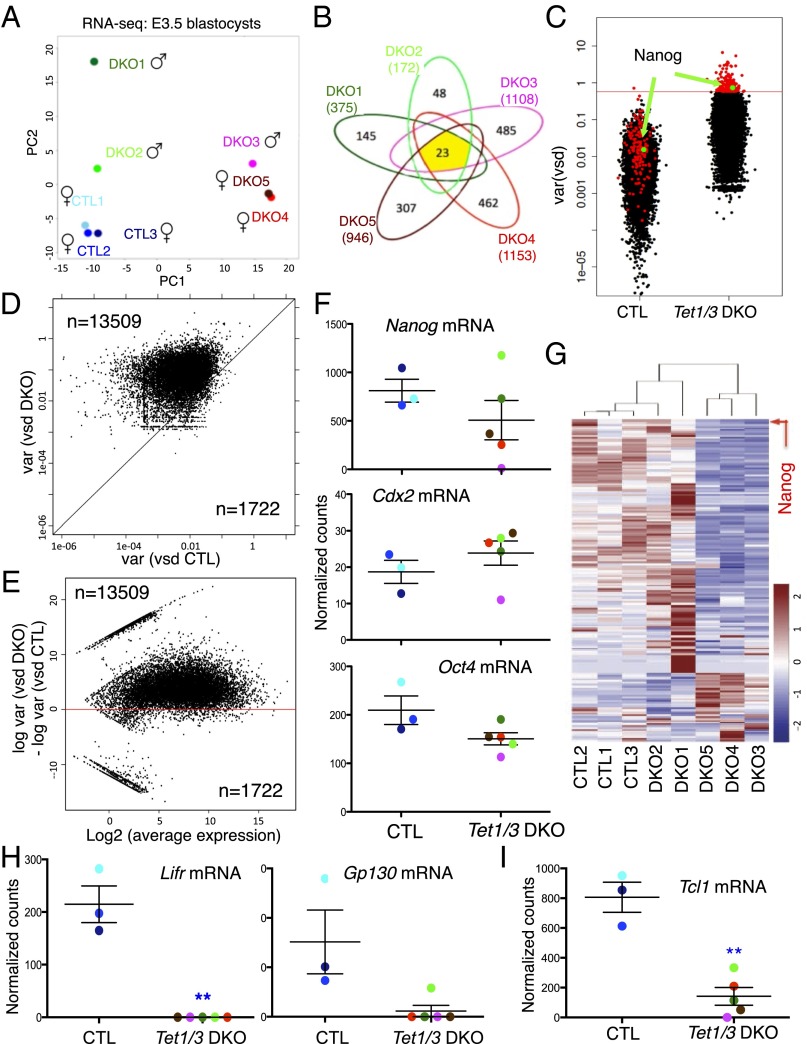
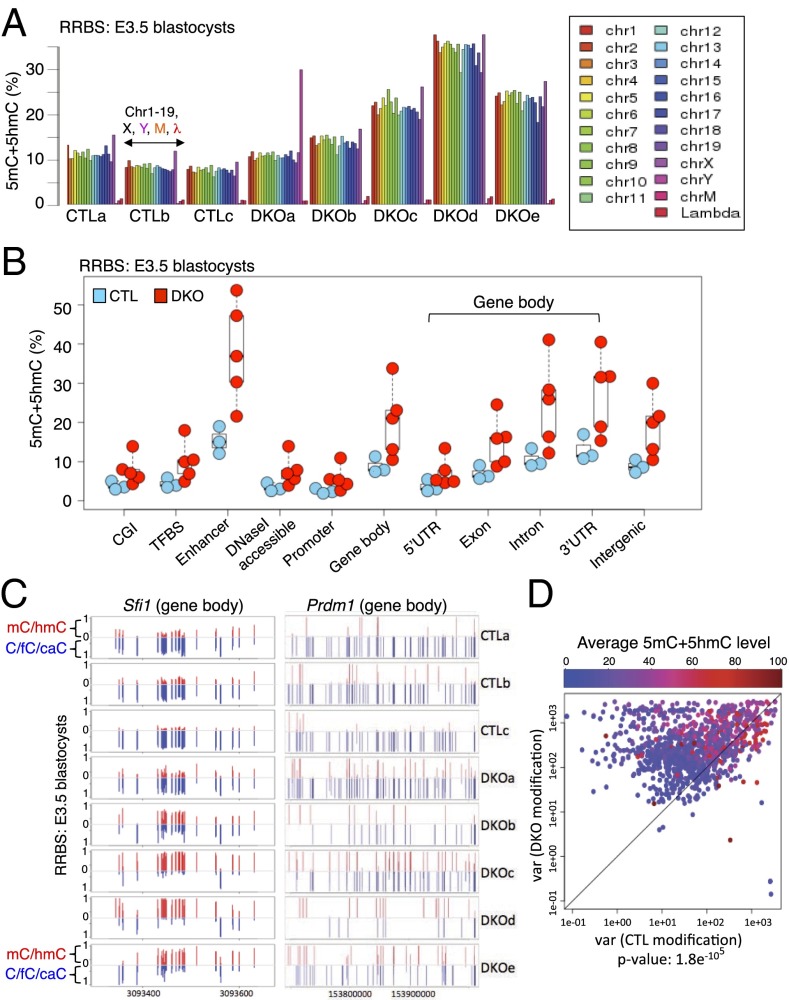
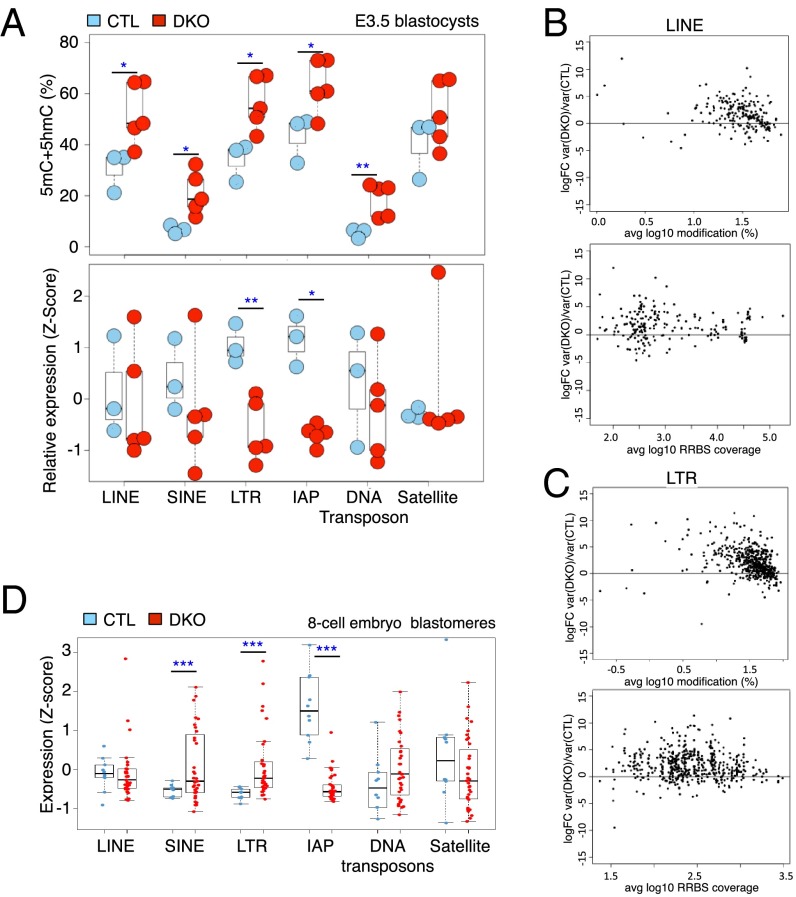
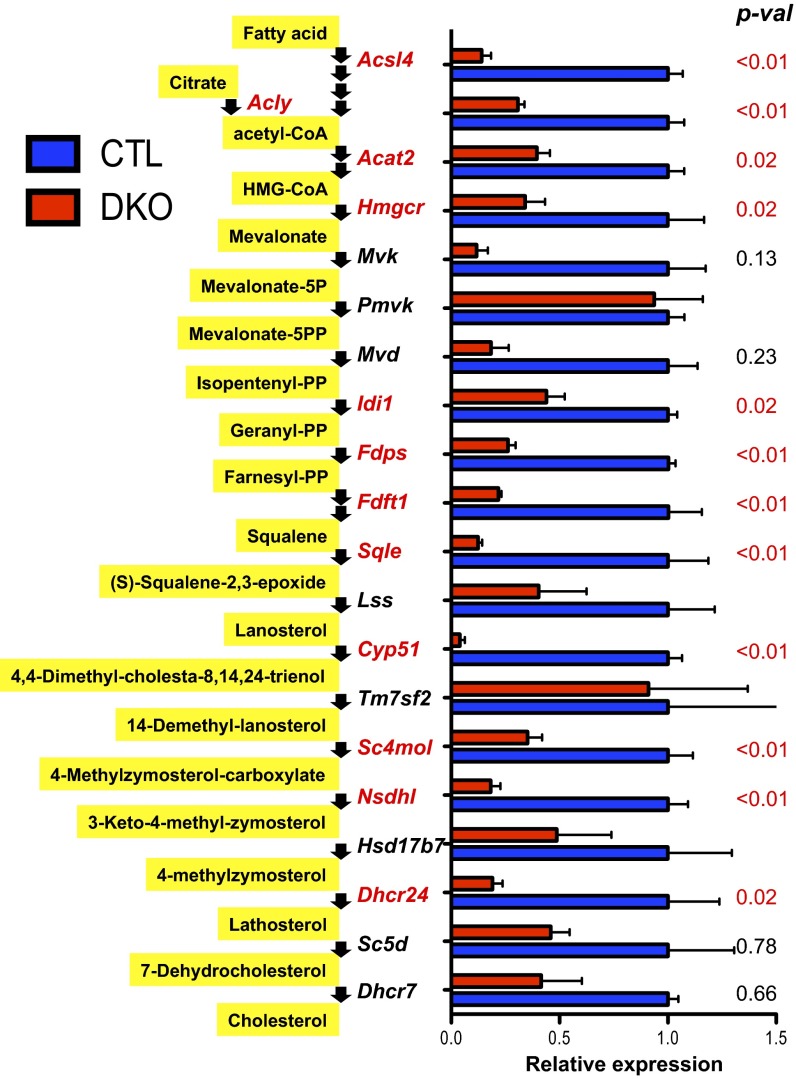
Dioxygenases of the TET (Ten-Eleven Translocation) family produce oxidized methylcytosines, intermediates in DNA demethylation, as well as new epigenetic marks. Here we show data suggesting that TET proteins maintain the consistency of gene transcription. Embryos lacking Tet1 and Tet3 (Tet1/3 DKO) displayed a strong loss of 5-hydroxymethylcytosine (5hmC) and a concurrent increase in 5-methylcytosine (5mC) at the eight-cell stage. Single cells from eight-cell embryos and individual embryonic day 3.5 blastocysts showed unexpectedly variable gene expression compared with controls, and this variability correlated in blastocysts with variably increased 5mC/5hmC in gene bodies and repetitive elements. Despite the variability, genes encoding regulators of cholesterol biosynthesis were reproducibly down-regulated in Tet1/3 DKO blastocysts, resulting in a characteristic phenotype of holoprosencephaly in the few embryos that survived to later stages. Thus, TET enzymes and DNA cytosine modifications could directly or indirectly modulate transcriptional noise, resulting in the selective susceptibility of certain intracellular pathways to regulation by TET proteins.

Keywords: 5-hydroxymethylcytosine; 5hmC; DNA methylation; TET methylcytosine oxidases; cholesterol biosynthesis.


Conflict of interest statement

The authors declare no conflict of interest.

Figures

Fig. 1.
Fig. 1.
Analyses of control and Tet1/3 DKO two-cell and eight-cell embryos. (A) Bar graph showing the percentage of one-cell, two-cell, four-cell, and eight-cell embryos in control (CTL) and Tet1/3 DKO embryos harvested at E2.5. Almost all CTL embryos have reached the eight-cell stage, whereas a substantial fraction of Tet1/3 DKO embryos show aborted or delayed development. (B) Apoptosis (Left), nuclear fragmentation (Middle), and mitotic defects (Right) in representative nonviable two-cell embryos from Tet1/3 DKO mice revealed by DAPI staining. (C) Immunocytochemistry for the lineage markers Nanog and Cdx2 does not reveal any pronounced differences between CTL and Tet1/3 DKO eight-cell embryos. Cdx2 was expressed in all blastomeres, whereas Nanog expression was typically not detected in eight-cell embryos (or occasionally detected in one or a very few blastomeres). (D) Immunocytochemistry using antibodies to 5mC and 5hmC shows global loss of 5hmC and concomitant increase of 5mC in nuclei of Tet1/3 DKO eight-cell embryos compared with CTL. (Scale bar, 50 μm.) (E, Top) Merged and enlarged images of a second control embryo. (Bottom) Tet1/3 DKO embryo from D, Middle, stained with antibodies to 5mC and 5hmC.
Fig. 2.
Fig. 2.
Transcriptional variability associated with Tet1/3 deficiency revealed by single-cell RNA sequencing of individual blastomeres from eight-cell embryos. (A) Principal component analysis of the transcriptomes of 10 CTL and 35 Tet1/3 DKO with the sex chromosome information removed, showing that the 35 Tet1/3 DKO blastomeres are more widely separated than the 10 CTL blastomeres for both principal component 1 (PC1) (absolute gap, 37 vs. 8) and PC2 (17 vs. 13). Groups A–D identified by the clustering analysis of A are indicated. (B) The box-and-whisker plot depicts the distribution of stabilized variances (gene expression variances across samples independent of their expression strength; see Materials and Methods) in eight-cell embryos. Median variances are shown at Bottom. Upper and Lower whiskers represent >75% and <25%, respectively. (C) Correlation plot of expression variances of all genes expressed in single cells of CTL and Tet1/3 DKO eight-cell embryos. Each gene is represented by a dot. Most genes fall above the diagonal, indicating greater variability of expression in Tet1/3 DKO blastomeres compared with controls. (D) The ratios of gene expression variance between CTL and Tet1/3 DKO blastomeres are plotted against the average expression level for each gene. The increased gene expression variance observed in blastomeres from Tet1/3 DKO eight-cell embryos is independent of the level of gene expression. (E) The genes expressed with highest variance in CTL and Tet1/3 DKO blastomeres, Zfp820 (Left) and Zbed3 (Right), respectively, and a gene that shows low variance in both samples, Invs (Bottom), are indicated (also see SI Appendix, Fig. S4E). (F) Principal component analysis of the combined RNA-seq data from our study and the single-cell analysis of zygotes, two-cell, and four-cell embryos performed by Biase et al. (28).
Fig. 3.
Fig. 3.
Expression of the lineage markers Nanog, Cdx2, and Gata6 in control and Tet1/3 DKO E3.5 and E4.5 embryos. (A) Immunocytochemistry for Nanog and Cdx2 expression shows dysregulation of the first step of lineage commitment in Tet1/3 DKO E3.5 embryos compared with control (CTL). Arrows indicate aberrant coexpression of Nanog and Cdx2. (B) Two more control blastocysts (Left) and three Tet1/3 DKO blastocysts with poor or failed Nanog expression (Right). (C) Immunocytochemistry for Nanog, Cdx2, and Gata6 expression shows dysregulation of the second step of lineage commitment in Tet1/3 DKO E4.5 embryos. (Scale bar, 50 μm.) Listed in red are the numbers of embryos displaying the indicated normal or abnormal phenotype, out of the total number of embryos examined. For more examples see SI Appendix, Fig. S5.
Fig. 4.
Fig. 4.
Transcriptional variability associated with Tet1/3 deficiency revealed by RNA sequencing of single E3.5 blastocysts. (A) Principal component analysis (PCA) of three CTL and five Tet1/3 DKO transcriptomes with the sex chromosome information removed, showing that the three control blastocysts cluster together, whereas the five Tet1/3 DKO blastocysts are widely separated. (B) Numbers of genes differentially expressed in each of the Tet1/3 DKO blastocysts compared with the average of the CTL blastocysts. Only 23 genes are differentially expressed in all five Tet1/3 DKO blastocysts relative to control blastocysts. (C) Overall increase in the variance of gene expression in Tet1/3 DKO compared with CTL blastocysts. Each gene is represented by a dot, with Nanog indicated in green. Genes shown in red are those with highest variance (top 1%, n = 178) in Tet1/3 DKO blastocysts. (D) Correlation plot of expression variances of all genes from CTL and Tet1/3 DKO embryos. Most genes fall above the diagonal, indicating greater variability of expression in Tet1/3 DKO blastocysts compared with controls. (E) The ratios of gene expression variance between CTL and Tet1/3 DKO blastocysts are plotted against the average expression level for each gene. The increased gene expression variance observed in Tet1/3 DKO blastocysts is independent of the level of gene expression. (F) Nanog, Cdx2, and Oct4 mRNA expression in control (CTL) and Tet1/3 DKO E3.5 blastocysts quantified by RNA-seq. (G) Heatmap showing expression of the top 1% of variable genes in Tet1/3 DKO blastocysts compared with controls. Nanog is indicated by an arrow. (H) Lifr, Gp130, and (I) Tcl1 expression levels in control (CTL) and Tet1/3 DKO blastocysts assessed by RNA-seq (**adjusted P value <0.01).
Fig. 5.
Fig. 5.
The variable levels of DNA modification (5mC+5hmC) in Tet1/3 DKO E3.5 blastocysts parallel the transcriptional variability observed above. (A) Modification levels on each chromosome were plotted for three CTL and five Tet1/3 DKO E3.5 embryos based on RRBS analysis. Note that the DKOa blastocyst is the only one with a Y chromosome and that cytosines in control unmodified lambda DNA show more than 98% conversion to T in all embryos. (B) The levels of DNA modification at CpG islands (CGI), transcription factor binding sites (TFBS), enhancers, DNaseI accessible regions, promoter (±2 kb relative to the TSS), gene bodies (subdivided into 5′ UTR, exon, intron, 3′ UTR) and intergenic regions. Each circle represents one blastocyst, with the embryo ID shown within each circle: blue circles, control blastocysts; red circles, Tet1/3 DKO blastocysts. (C) Modification levels of part of the gene body of Sfi1 and the entire gene body of Prdm16 from individual control and Tet1/3 DKO blastocysts. Each bar represents one CpG, and the full length of each bar represents 100% modification (red, 5mC+5hmC; blue, C+5fC+5CaC). (D) The correlation plot depicts variances in the DNA modification level of individual CpGs from CTL and Tet1/3 DKO embryos. Each dot represents one CpG (more than eight reads and >10% 5mC+5hmC). The level of DNA modification at each CpG is graded from blue to red. Most dots fall above the diagonal regardless of modification level, indicating thatTet1/3 DKO blastocysts show greater variability of DNA modification compared with controls.
Fig. 6.
Fig. 6.
Variability of DNA modification and expression of repetitive elements in Tet1/3 DKO early embryos. (A, Top) DNA modification (5mC+5hmC) levels associated with LINE, SINE, LTR, IAP, DNA transposon, and satellite sequences taken from RRBS data. Blue circles, control blastocysts; red circles, Tet1/3 DKO blastocysts. (Bottom) Expression levels of the corresponding elements taken from RNA-seq data using a separate set of blastocysts. Blue circles, control blastocysts; red circles, Tet1/3 DKO blastocysts (see Fig. 3). (B and C) The variance ratios of DNA modification for individual CpGs within LINEs (B) and LTRs (C) of CTL and Tet1/3 DKO embryos are plotted against average DNA modification level (Top) and RRBS coverage (Bottom). FC, fold change. (D) Expression of LINE, SINE, LTR, IAP, DNA transposon, and satellite sequences taken from RNA-seq data on 10 individual CTL and 35 individual Tet1/3 DKO blastomeres from eight-cell embryos. Note the strongly diminished expression of IAP elements, also observed for E3.5 blastocysts in A. Welch's t test was applied in A and D; *P, <0.05; **P, <0.01; ***P, <0.001.
Fig. 7.
Fig. 7.
Reproducible down-regulation of genes in the cholesterol biosynthetic pathway in Tet1/3 DKO E3.5 embryos compared with controls. Shown is the sequence of enzymes in the cholesterol biosynthesis pathway, indicating the degree of impaired expression based on RNA-seq data. The averaged normalized counts of three control and five Tet1/3 DKO embryos are plotted. Adjusted P values are shown at Right. Also see SI Appendix, Fig. S8.

Similar articles

Cited by

References

    1. Tahiliani M, et al. Conversion of 5-methylcytosine to 5-hydroxymethylcytosine in mammalian DNA by MLL partner TET1. Science. 2009;324(5929):930–935. - PMC - PubMed
    1. Ito S, et al. Tet proteins can convert 5-methylcytosine to 5-formylcytosine and 5-carboxylcytosine. Science. 2011;333(6047):1300–1303. - PMC - PubMed
    1. He YF, et al. Tet-mediated formation of 5-carboxylcytosine and its excision by TDG in mammalian DNA. Science. 2011;333(6047):1303–1307. - PMC - PubMed
    1. Pastor WA, Aravind L, Rao A. TETonic shift: Biological roles of TET proteins in DNA demethylation and transcription. Nat Rev Mol Cell Biol. 2013;14(6):341–356. - PMC - PubMed
    1. Kohli RM, Zhang Y. TET enzymes, TDG and the dynamics of DNA demethylation. Nature. 2013;502(7472):472–479. - PMC - PubMed

Publication types

MeSH terms