Comparative Study
. 2015 Jul 2;5(10):1083-97.
doi: 10.7150/thno.11711. eCollection 2015.

Superior Performance of Aptamer in Tumor Penetration over Antibody: Implication of Aptamer-Based Theranostics in Solid Tumors

Affiliations
Comparative Study

Superior Performance of Aptamer in Tumor Penetration over Antibody: Implication of Aptamer-Based Theranostics in Solid Tumors

Dongxi Xiang et al. Theranostics. .

Abstract

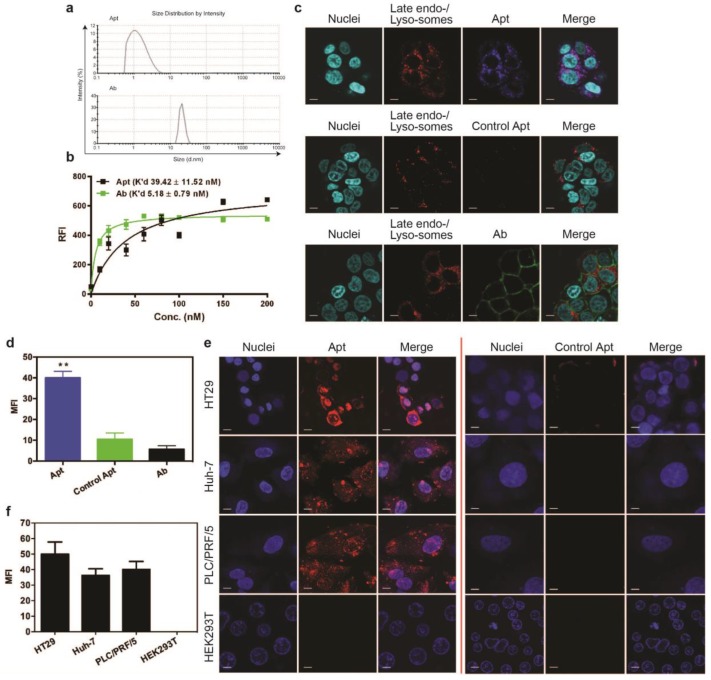
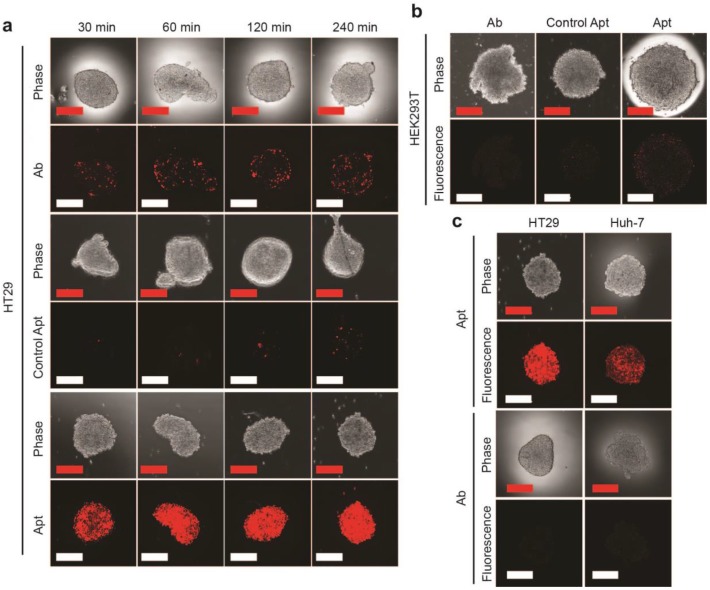
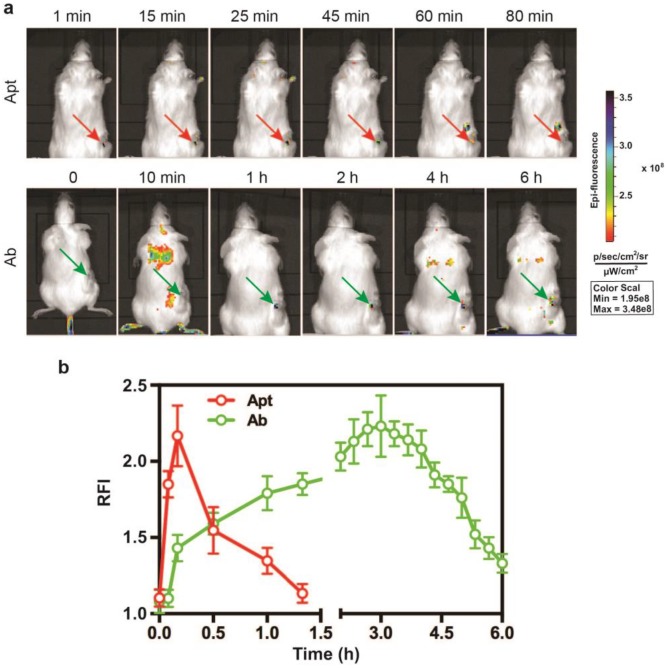
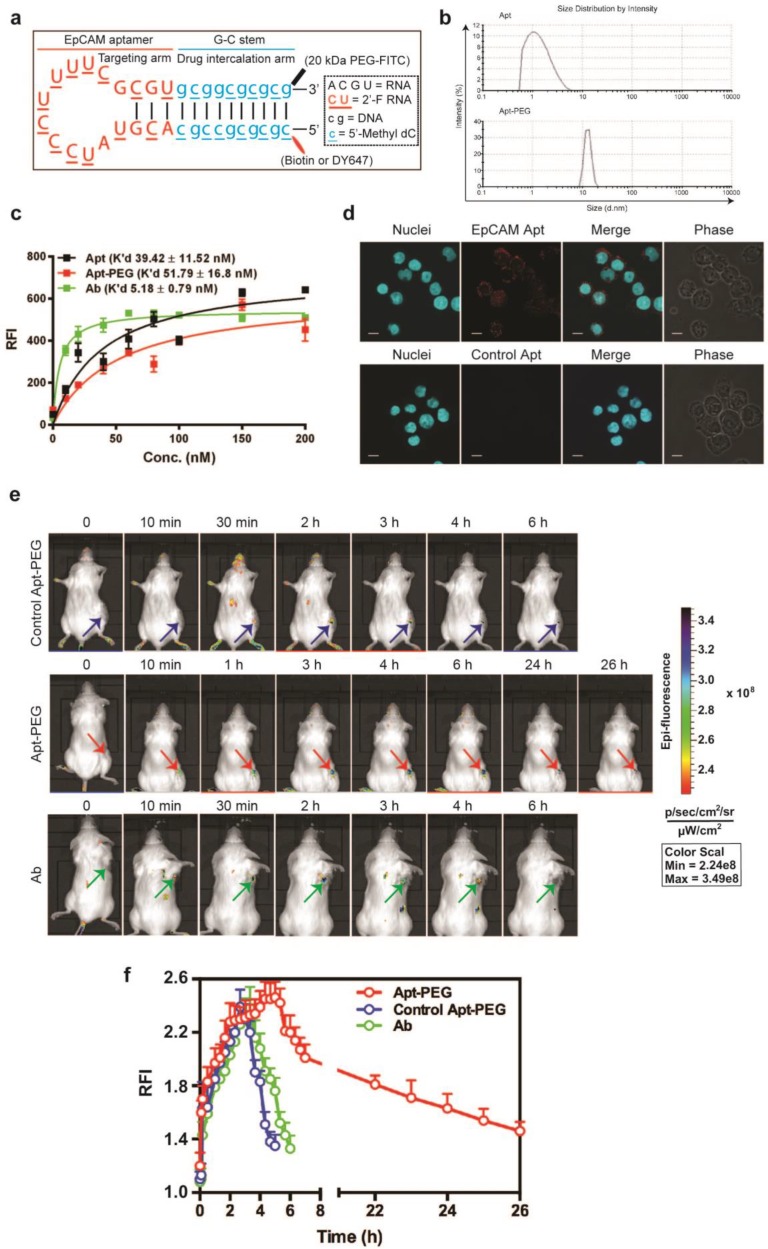
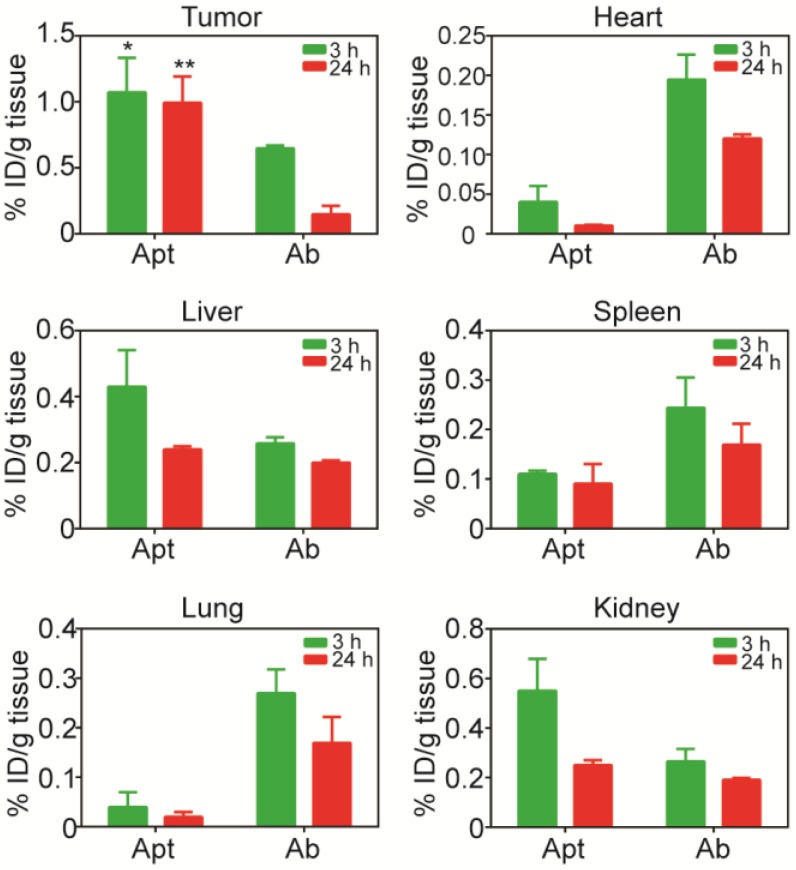
Insufficient penetration of therapeutic agents into tumor tissues results in inadequate drug distribution and lower intracellular concentration of drugs, leading to the increase of drug resistance and resultant failure of cancer treatment. Targeted drug delivery to solid tumors followed by complete drug penetration and durable retention will significantly improve clinical outcomes of cancer therapy. Monoclonal antibodies have been commonly used in clinic for cancer treatment, but their limitation of penetrating into tumor tissues still remains because of their large size. Aptamers, as "chemical antibodies", are 15-20 times smaller than antibodies. To explore whether aptamers are superior to antibodies in terms of tumor penetration, we carried out the first comprehensive study to compare the performance of an EpCAM aptamer with an EpCAM antibody in theranostic applications. Penetration and retention were studied in in vitro three-dimensional tumorspheres, in vivo live animal imaging and mouse colorectal cancer xenograft model. We found that the EpCAM aptamer can not only effectively penetrate into the tumorsphere cores but can also be retained by tumor sphere cells for at least 24 h, while limited tumor penetration by EpCAM antibody was observed after 4 h incubation. As observed from in vivo live animal imaging, EpCAM aptamers displayed a maximum tumor uptake at around 10 min followed by a rapid clearance after 80 min, while the signal of peak uptake and disappearance of antibody appeared at 3 h and 6 h after intravenous injection, respectively. The signal of PEGylated EpCAM aptamers in xenograft tumors was sustained for 26 h, which was 4.3-fold longer than that of the EpCAM antibody. Consistently, there were 1.67-fold and 6.6-fold higher accumulation of PEGylated aptamer in xenograft tumors than that of antibody, at 3 h and 24 h after intravenous administration, respectively. In addition, the aptamer achieved at least a 4-time better tumor penetration in xenograft tumors than that of the antibody at a 200 μm distances from the blood vessels 3 h after intravenous injection. Taken together, these data indicate that aptmers are superior to antibodies in cancer theranostics due to their better tumor penetration, more homogeneous distribution and longer retention in tumor sites. Thus, aptamers are promising agents for targeted tumor therapeutics and molecular imaging.

Keywords: aptamer; targeted tumor therapeutics; tumor penetration.


Conflict of interest statement

Competing Interests: The authors have declared that no competing interest exists.

Figures

Figure 1
Figure 1
Cell binding and internalization of EpCAM aptamer and antibody in vitro. (a) Particle size of EpCAM aptamer and EpCAM antibody as determined by dynamic light scattering. (b) Determination of the equilibrium dissociation constants (K'd) of EpCAM aptamer and EpCAM antibody to HT29 cells using flow cytometry by incubating cells at varying concentrations of aptamer and antibody (1-200 nmol/L). (c) Localization of EpCAM aptamer, control EpCAM aptamer or EpCAM antibody in acidic organelles (late endosome and lysosomes). Following incubation with 100 nM EpCAM aptamer or EpCAM antibody at 37 °C for 15 min and three time washes, HT29 cells were incubated with LysoTracker® Green in the first 90 min of a further 2 h incubation followed by confocal microscopy imaging. (d) Quantification of fluorescence signals from localized aptamer or antibody in acidic organelles (late endosome and lysosomes) as in (c). (e) Specificity of EpCAM aptamer binding and internalization. Three EpCAM-positive cell lines (HT29, Huh-7 and PLC/PRF/5) and the control EpCAM-negative HEK293T cells were incubated with 100 nM EpCAM aptamer or control EpCAM aptamer at 37 °C for 15 min, followed by washing and confocal microscopy imaging. (f) Quantification of fluorescence signals from internalized aptamers in various cell lines as in (e). Ab, antibody; Apt, aptamer, RFI, relative fluorescence intensity; MFI, mean fluorescence intensity. Data are means ± SEM, n=3. Scale bar = 5 μm.
Figure 2
Figure 2
EpCAM aptamer penetrates tumorsphere more effectively than EpCAM antibody. EpCAM aptamer, control aptamer, or EpCAM antibody of the same concentration (100 nM) were incubated with HT29 tumorsphere for up to 240 min at 37 °C. The tumorspheres were then washed three times in PBS and imaged using laser scanning confocal microscopy. (a) Aptamer and antibody staining of HT29 tumorspheres. (b) Aptamer and antibody staining of HEK293T tumorspheres after 240 min incubation. (c) Following a 4 h incubation, the HT-29 and Huh-7 tumorspheres were washed with PBS and incubated in the absence of EpCAM aptamer and EpCAM antibody. Cells incubated with aptamers were imaged using laser scanning confocal microscopy 24 h later; those with antibody imaged 4 h alter. Scale bar = 200 µm.
Figure 3
Figure 3
Superior performance of EpCAM aptamer to the antibody in in vivo molecular imaging. (a) Representative live animal images of aptamers and antibody. NOD-SCID mice bearing HT29 tumor (150 mm3) received a single i.v. injection of 0.75 nmol of EpCAM aptamer and EpCAM antibody. Log-scale heat map (at the right) of photon flux applies to all panels. p/s/cm2/sr: photons per second per cm2 per steradian. Arrow depicts the position of the subcutaneous HT29 tumor. (b) The fluorescence-time curve of EpCAM aptamer and EpCAM antibody in tumors as indicated in (a) was determined by Living Imaging Software v2.50 (Xenogen) with the units of photons/s/cm2/sr. Data are means ± SEM, n=3.
Figure 4
Figure 4
Superior tumor accumulation and retention of PEGylated aptamer than that of antibody. (a) PEGylated aptamer was developed by attaching a 20 kDa PEG-FITC to the 3'-end and a biotin or a DY647 dye to the 5'- end of the DNA strand. (b) Particle size of PEGylated aptamer and antibody as determined by dynamic light scattering. (c) Determination of the equilibrium dissociation constants (K'd) of PEGylated aptamer to HT29 cells using flow cytometry by incubating cells at varying concentrations (1-200 nmol/L). (d) Binding and internalization of PEGylated aptamer to HT29 cells which were incubated with 100 nM EpCAM aptamer at 37 °C for 30 min, followed by washing and confocal microscopy imaging. Scale bar = 10 μm. (e) Live animal imaging of antibodies and aptamers. NOD-SCID mice bearing HT29 tumor (150 mm3) received a single intravenous injection of 0.75 nmol of control PEGylated aptamer, PEGylated aptamer and antibody followed by live animal imaging at the indicated time points. (f) The fluorescence-time curve of PEGylated aptamer in tumors as in (e) was determined by Living Imaging Software v2.50 (Xenogen) with the units of photons/s/cm2/sr. Log-scale heat map (at the right) of photon flux applies to all panels. Data are means ± SEM, n=3. RFI: relative fluorescence intensity.
Figure 5
Figure 5
Biodistribution of PEGylated aptamer and antibody in mice bearing xenograft colorectal tumors. NOD/SCID mice bearing HT29 xenograft tumors (~150 mm3) received a single i.v. injection of 1 nmol/mouse of PEGylated aptamer or antibody. The concentration of aptamer or antibody, expressed as % of injected dose (ID) per g of tissue, in tissues iundicated was determined at 3 h and 24 h after the agent administration using ELISA. Data are means ± SEM (n = 4). *, P < 0.05; **, P < 0.01 compared to antibody.
Figure 6
Figure 6
Time-dependent penetration of PEGylated aptamer and antibody in relation to blood vessels in HT29 xenograft tumors. (a) Representative images of double staining of aptamer or antibody and blood vessels in tumor sections dissected from treated mice-bearing HT29 xenografts 3 h and 24 h after i.v. administration of aptamer or antibody at a dose of 2 nmol/mouse. Blood vessels were stained by chromogenic alkaline phosphatase (black arrow); while aptamer or antibody were stained using DAB peroxidase substrate (brown). Scale bar: 200 μm. (b-c) Quantitative determination of staining intensity against a given perpendicular distance (20-200 μm) to the blood vessels at 3 h. (b) and 24 h (c) after i.v. injection of aptamer or antibody. Data are means ± SEM (n=8).

References

    1. Muchekehu R, Liu D, Horn M. et al. The Effect of Molecular Weight, PK, and Valency on Tumor Biodistribution and Efficacy of Antibody-Based Drugs. Transl Oncol. 2013;6(5):562–72. - PMC - PubMed
    1. Tunggal JK, Cowan DS, Shaikh H, Tannock IF. Penetration of anticancer drugs through solid tissue: a factor that limits the effectiveness of chemotherapy for solid tumors. Clin Cancer Res. 1999;5(6):1583–6. - PubMed
    1. Primeau AJ, Rendon A, Hedley D, Lilge L, Tannock IF. The distribution of the anticancer drug Doxorubicin in relation to blood vessels in solid tumors. Clin Cancer Res. 2005;11(24 Pt 1):8782–8. - PubMed
    1. O'Connor ML, Xiang D, Shigdar S. et al. Cancer stem cells: A contentious hypothesis now moving forward. Cancer Lett. 2014;344(2):180–7. - PubMed
    1. Minchinton AI, Tannock IF. Drug penetration in solid tumours. Nat Rev Cancer. 2006;6(8):583–92. - PubMed

Publication types

Substances