. 2015 Jun 19:6:1369-76.
doi: 10.3762/bjnano.6.141. eCollection 2015.

Alternative types of molecule-decorated atomic chains in Au-CO-Au single-molecule junctions

Affiliations

Alternative types of molecule-decorated atomic chains in Au-CO-Au single-molecule junctions

Zoltán Balogh et al. Beilstein J Nanotechnol. .

Abstract

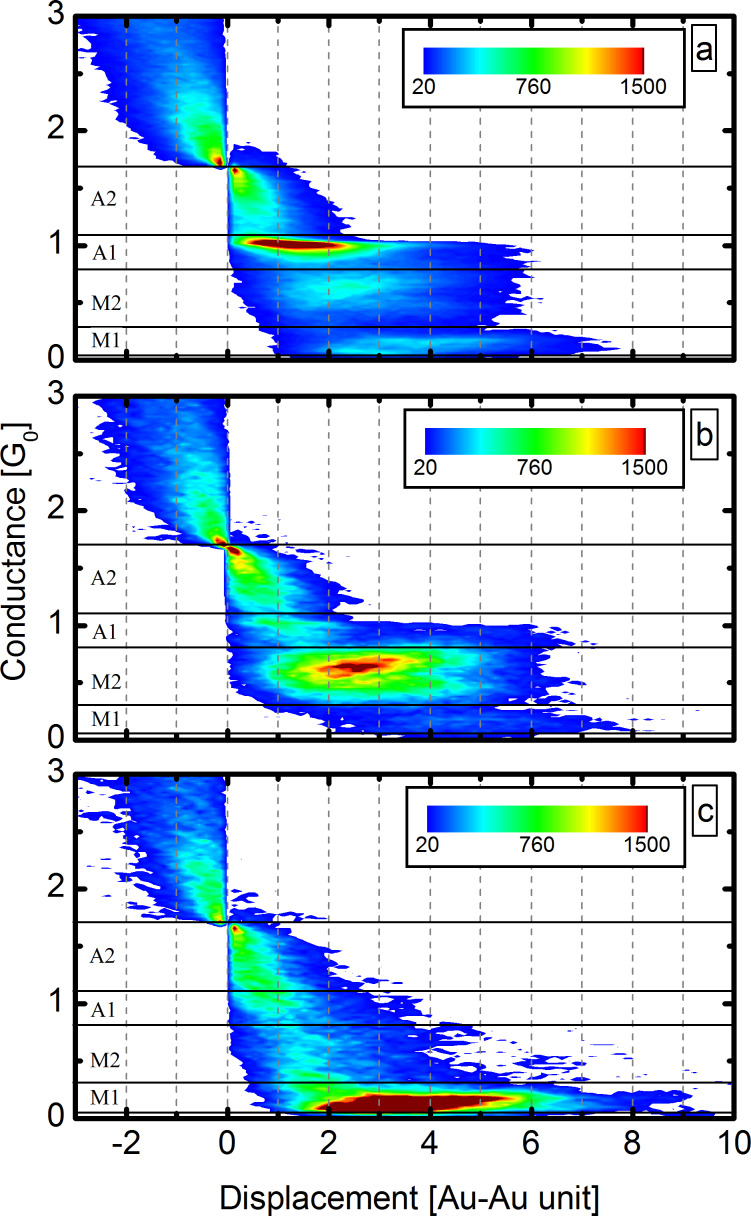
We investigate the formation and evolution of Au-CO single-molecule break junctions. The conductance histogram exhibits two distinct molecular configurations, which are further investigated by a combined statistical analysis. According to conditional histogram and correlation analysis these molecular configurations show strong anticorrelations with each other and with pure Au monoatomic junctions and atomic chains. We identify molecular precursor configurations with somewhat higher conductance, which are formed prior to single-molecule junctions. According to detailed length analysis two distinct types of molecule-affected chain-formation processes are observed, and we compare these results to former theoretical calculations considering bridge- and atop-type molecular configurations where the latter has reduced conductance due to destructive Fano interference.

Keywords: atomic chains; break junction; carbon monoxide; correlation analysis; gold.


Figures

Figure 1
Figure 1
Conductance histogram of Au junctions before (black) and after (grey) the dosing of CO molecules. The latter shows two new molecular peaks at 0.17G0 and 0.67G0. The color background shows the important conductance regions discussed in the text: M1 (0.05–0.3G0, brown), M2 (0.3–0.8G0, orange), A1 (0.8–1.1G0, yellow) and A2 (1.1–1.7G0, red). All histograms are normalized to the number of traces.
Figure 2
Figure 2
(a) Conditional histograms for selected traces with larger than average length in different regions: M1–M2 (green), A1 (black) and A2 (blue). As a reference the grey area graph shows the histogram for all traces. (b) The 2D correlational histogram of Au–CO junctions. (c) Two demonstrative opening traces.
Figure 3
Figure 3
Conditional histograms based on double selection. First the traces are selected for which the molecular plateau in the entire M1–M2 region is longer than average, i.e., the traces corresponding to pronounced molecular junctions. The conditional histogram for these traces (grey area graph) is the same as the green line in Figure 2a. As a next step we select traces from this reduced dataset, for which the M1 (M2) region is longer than average, respectively. The light and dark green curves show the corresponding conditional histograms for the M1 and M2 region, respectively.
Figure 4
Figure 4
(a) Two-dimensional conductance–displacement histogram for all of the measured traces, showing the appearance of the same configurations as the grey curve in Figure 1. (b,c) The 2D conductance–displacement histograms for the same traces that were used to plot the light/dark green, double selected conditional histograms in Figure 3. Panels (b) and (c) correspond to molecular traces selected for the M2 and M1 region, respectively. The electrode-displacement is given in Au–Au distance unit, i.e., the distance of neighbor Au atoms in clean atomic chains. The 2DCDHs are normalized to the number of included traces.
Figure 5
Figure 5
(a) The 2DCDH of all traces with Gref = 0.01 G0. This histogram shows that the junction can break from all the three regions (M1–M2, A1). (b) The histograms of selected traces according to the final configuration selection for the M1 region (light green), M2 region (dark green) and the A1 region (black). (c1–c5) Configurations that can be formed during the junction opening: (c1) and (c2) Au atomic chain with a CO molecule bound in an atop and bridge geometry, respectively. (c3) Pure Au atomic chain. (c4) Precursor molecular configuration. (c5) A parallel CO molecule is incorporated in the chain. (According to our arguments the latter is not observed in the present experiments.)

References

    1. Cuevas J C, Scheer E. Molecular Electronics: An introduction to Theory and Experiment. Singapore: World Scientific Publishing Co Pte Ltd; 2010.
    1. Aradhya S V, Venkataraman L. Nat Nanotechnol. 2013;8:399–410. doi: 10.1038/nnano.2013.91. - DOI - PubMed
    1. Djukic D, van Ruitenbeek J M. Nano Lett. 2006;6:789–793. doi: 10.1021/nl060116e. - DOI - PubMed
    1. Vardimon R, Klionsky M, Tal O. Phys Rev B. 2013;88:161404. doi: 10.1103/PhysRevB.88.161404. - DOI
    1. Reddy P, Jang S-Y, Segalman R A, Majumdar A. Science. 2007;315:1568–1571. doi: 10.1126/science.1137149. - DOI - PubMed

LinkOut - more resources