. 2015 May 21:8:583-93.
doi: 10.1016/j.nicl.2015.05.006. eCollection 2015.

The relative importance of imaging markers for the prediction of Alzheimer's disease dementia in mild cognitive impairment - Beyond classical regression

Affiliations

The relative importance of imaging markers for the prediction of Alzheimer's disease dementia in mild cognitive impairment - Beyond classical regression

Stefan J Teipel et al. Neuroimage Clin. .

Abstract

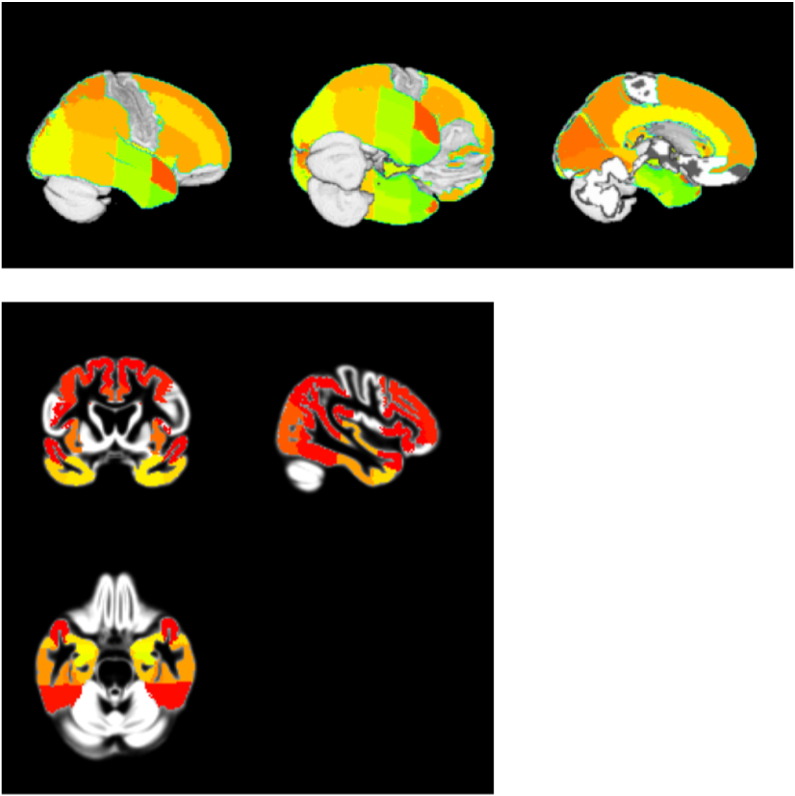
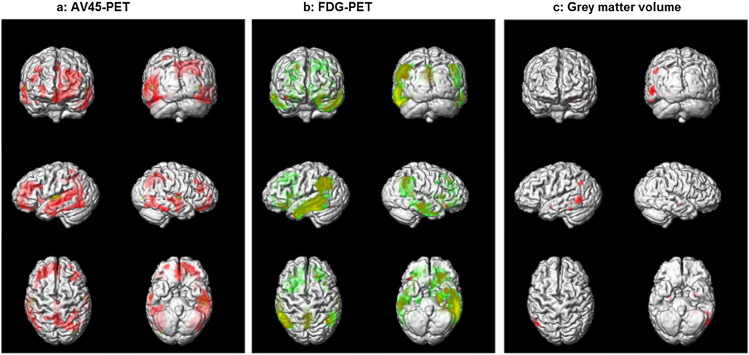
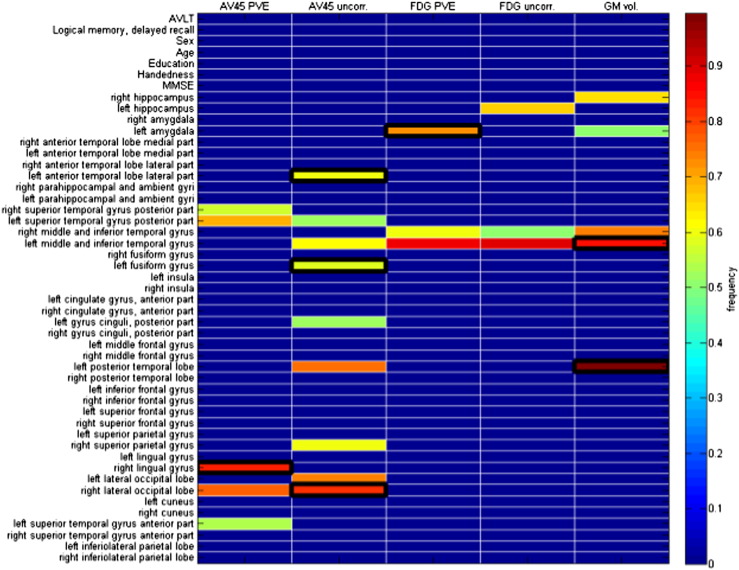
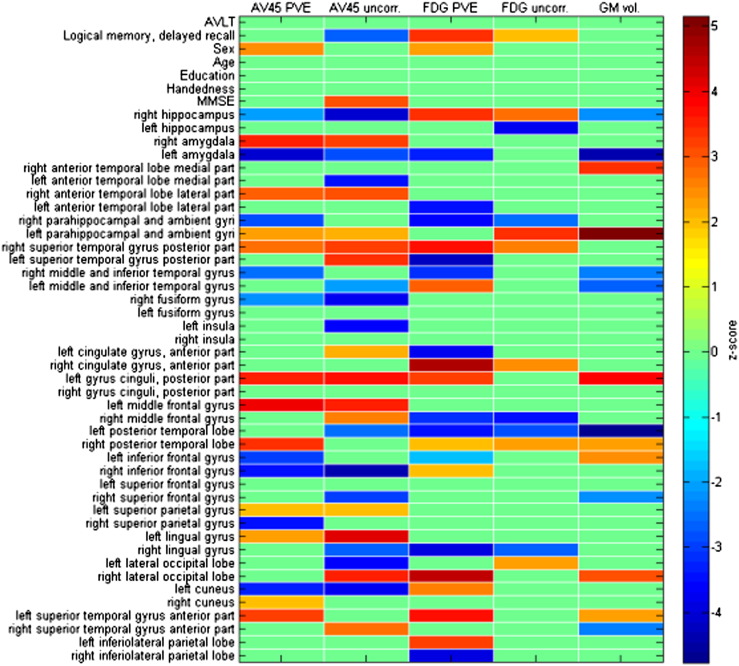
Selecting a set of relevant markers to predict conversion from mild cognitive impairment (MCI) to Alzheimer's disease (AD) has become a challenging task given the wealth of regional pathologic information that can be extracted from multimodal imaging data. Here, we used regularized regression approaches with an elastic net penalty for best subset selection of multiregional information from AV45-PET, FDG-PET and volumetric MRI data to predict conversion from MCI to AD. The study sample consisted of 127 MCI subjects from ADNI-2 who had a clinical follow-up between 6 and 31 months. Additional analyses assessed the effect of partial volume correction on predictive performance of AV45- and FDG-PET data. Predictor variables were highly collinear within and across imaging modalities. Penalized Cox regression yielded more parsimonious prediction models compared to unpenalized Cox regression. Within single modalities, time to conversion was best predicted by increased AV45-PET signal in posterior medial and lateral cortical regions, decreased FDG-PET signal in medial temporal and temporobasal regions, and reduced gray matter volume in medial, basal, and lateral temporal regions. Logistic regression models reached up to 72% cross-validated accuracy for prediction of conversion status, which was comparable to cross-validated accuracy of non-linear support vector machine classification. Regularized regression outperformed unpenalized stepwise regression when number of parameters approached or exceeded the number of training cases. Partial volume correction had a negative effect on the predictive performance of AV45-PET, but slightly improved the predictive value of FDG-PET data. Penalized regression yielded more parsimonious models than unpenalized stepwise regression for the integration of multiregional and multimodal imaging information. The advantage of penalized regression was particularly strong with a high number of collinear predictors.


Figures

Fig. 1
Fig. 1
Selected regions. Regions from the Hammers Maximum Probability atlas (Hammers et al., 2003) that were selected for the classification models projected onto the reference template in standard space. Upper row: surface view and midsagittal view. Lower row: Coronar, sagittal and axial sections focusing on subregions in temporal lobe.
Fig. 2
Fig. 2
Regional pattern of amyloid load, hypometabolism and grey matter atrophy in MCIc vs. MCInc. Clusters of significant increase in AV45 uptake (Fig. 2a), significant decrease in 18FDG uptake (Fig. 2b) or significant decrease in grey matter volume (Fig. 2c) in MCIc vs. MCInc projected onto the reference template in standard space. For PET data, red represents PVE uncorrected PET data, green represents PVE corrected PET data, and yellow indicates overlap. Please note that clusters are shown with at least 50 voxels passing the significance threshold of p < 0.05, FDR corrected, for FDG-PET and grey matter volume data, but with at least 50 voxels passing the significance threshold of p < 0.05, FWE corrected, for AV45-PET data, because at p < 0.05, FDR corrected, almost the entire supratentorial grey matter showed significant effects for AV45-PET uptake.
Fig. 3
Fig. 3
Frequency of variable selection from penalized Cox regression. Colour coded intensity map for frequency of selection of regional values with the modalities of PVE corrected AV45-PET (AV45 PVE), non-PVE corrected AV45-PET (AV45 uncorr.), PVE corrected FDG-PET (FDG PVE), non-PVE corrected FDG-PET (FDG uncorr.), and grey matter volume (GM vol.). Squares with a black margin indicate those parameters that were selected as predictors in a cross-modality prediction model.
Fig. 4
Fig. 4
Results of stepwise Cox regression. Colour coded intensity map for z-scores of selected regional values with the modalities of PVE corrected AV45-PET (AV45 PVE), non-PVE corrected AV45-PET (AV45 uncorr.), PVE corrected FDG-PET (FDG PVE), non-PVE corrected FDG-PET (FDG uncorr.), and grey matter volume (GM vol.) from stepwise Cox regression. Z-scores have been thresholded at an absolute value of z > 1.96, corresponding to a two-tailed error of p < 0.05.
Fig. 5
Fig. 5
Prediction accuracies without and with elastic net penalty. Bar diagram of sensitivity, specificity and overall accuracy to predict conversion status, MCIc vs. MCInc. Bars on the left indicate results for unpenalized logistic regression, on the right from penalized logistic regression with an elastic net penalty (EN) of alpha = 0.5. In the first row, predictor variables have been identified from the within modality penalized Cox regression models and combined across modalities, using bootstrapped cross-validation. In the second row, predictor variables have been identified from the within modality penalized Cox regression models and combined across modalities without cross-validation (i.e. fit in the training sample). In the third row, predictor variables have been identified from the within modality unpenalized stepwise (SW) Cox regression models and combined across modalities, using bootstrapped cross-validation. The stepwise bidirectional selection process is not possible when the number of parameters (p) is larger than the number of cases (n). In the fourth row, predictor variables have been identified from the within modality unpenalized stepwise (SW) Cox regression models and combined across modalities without cross-validation (i.e. fit in the training sample). AUC — area under the receiver operating characteristics (ROC) curve.

Comment in

Similar articles

Cited by

References

    1. Altman D.G., Andersen P.K. Bootstrap investigation of the stability of a Cox regression model. Stat. Med. 1989;8(7):771–783. 2672226 - PubMed
    1. Ashburner J. A fast diffeomorphic image registration algorithm. Neuroimage. 2007;38(1):95–113. 17761438 - PubMed
    1. Belsley D.A. Conditioning Diagnostics: Collinearity and Weak Data in Regression. John Wiley & Sons; ChichesterU.K: 1991.
    1. Bokde A.L., Pietrini P., Ibáñez V., Furey M.L., Alexander G.E., Graff-Radford N.R., Rapoport S.I., Schapiro M.B., Horwitz B. The effect of brain atrophy on cerebral hypometabolism in the visual variant of Alzheimer disease. Arch. Neurol. 2001;58(3):480–486. 11255453 - PubMed
    1. Bokde A.L., Teipel S.J., Drzezga A., Thissen J., Bartenstein P., Dong W., Leinsinger G., Born C., Schwaiger M., Moeller H.J., Hampel H. Association between cognitive performance and cortical glucose metabolism in patients with mild Alzheimer's disease. Dement. Geriatr. Cogn. Disord. 2005;20(6):352–357. 16192725 - PubMed

Publication types

MeSH terms