. 2015 Jul 22:4:e08490.
doi: 10.7554/eLife.08490.

Viral dark matter and virus-host interactions resolved from publicly available microbial genomes

Affiliations

Viral dark matter and virus-host interactions resolved from publicly available microbial genomes

Simon Roux et al. Elife. .

Abstract

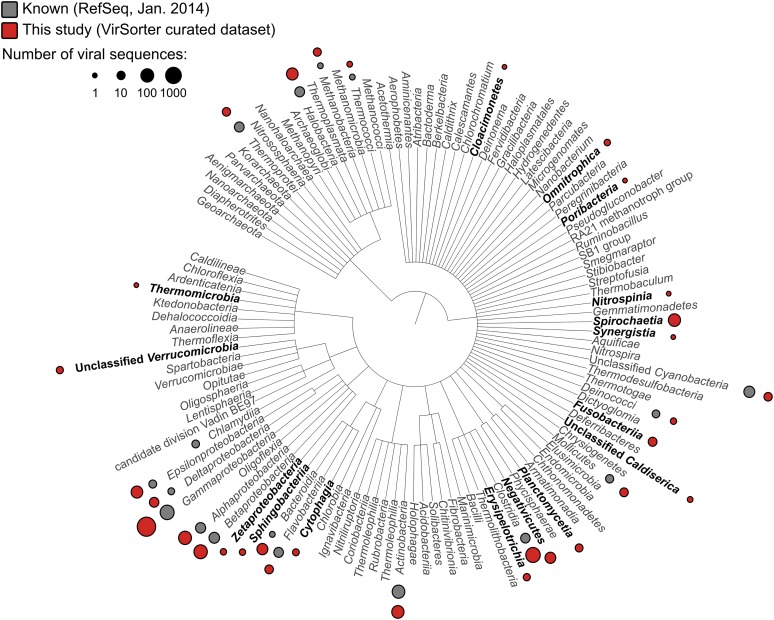
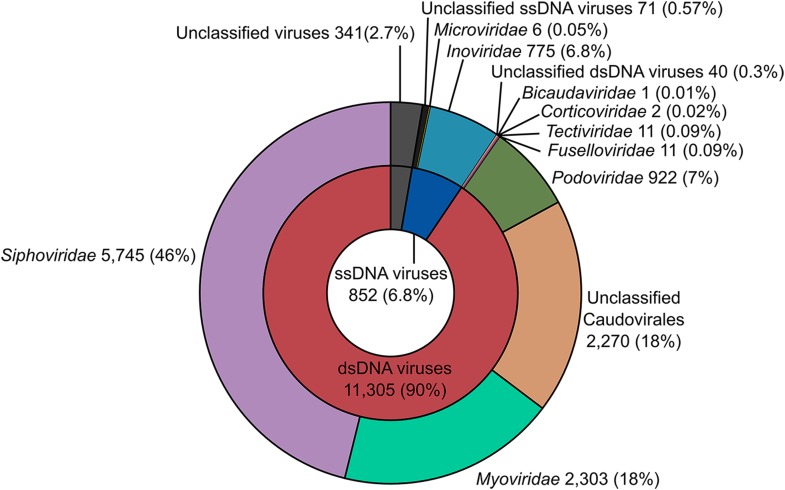
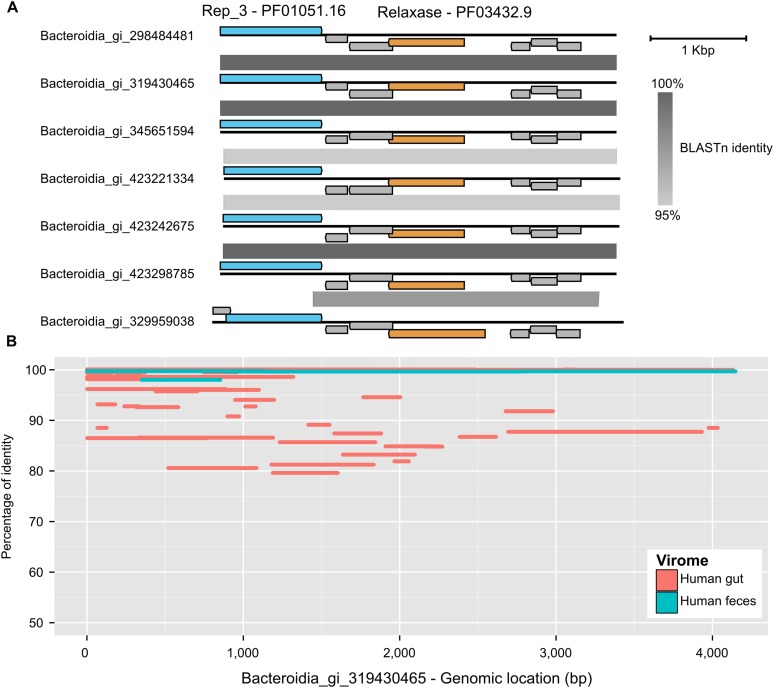
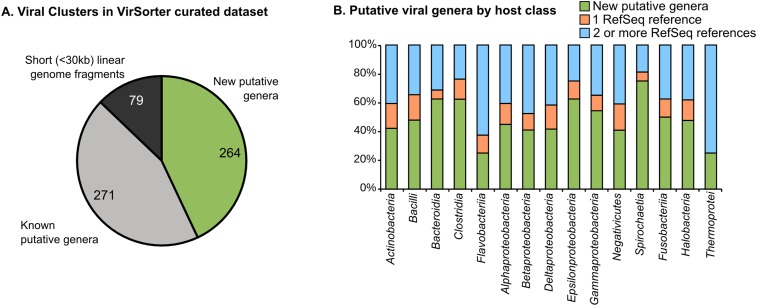
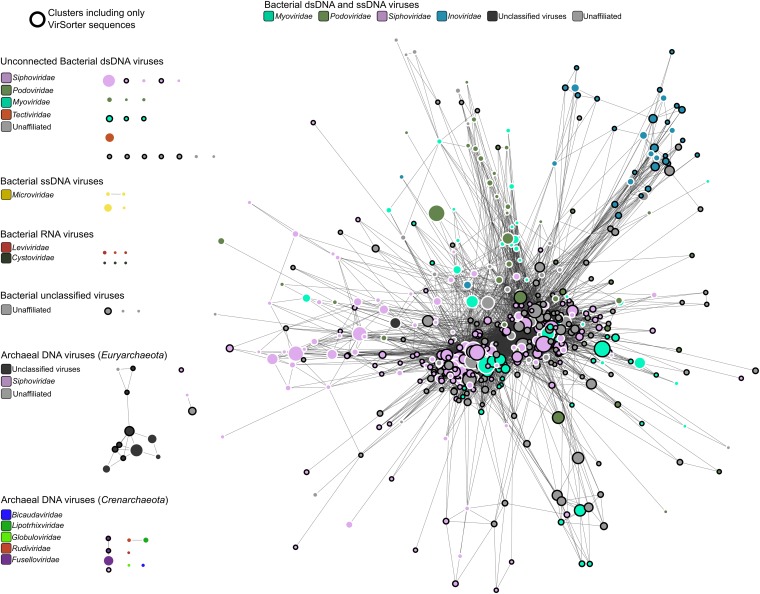
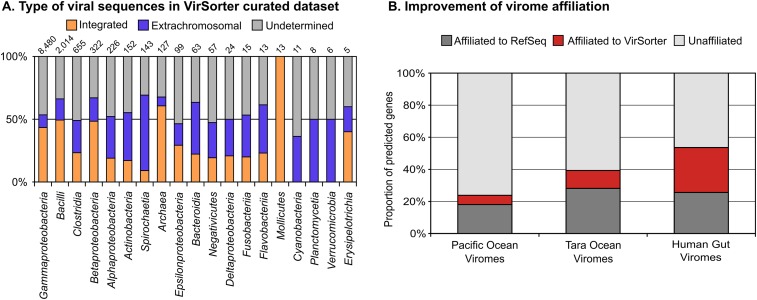
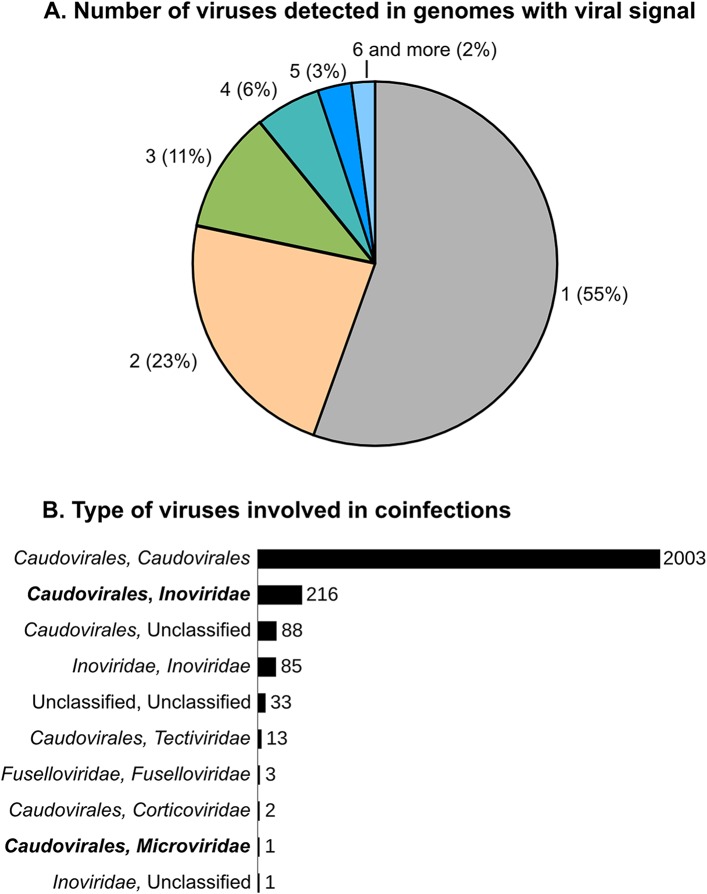
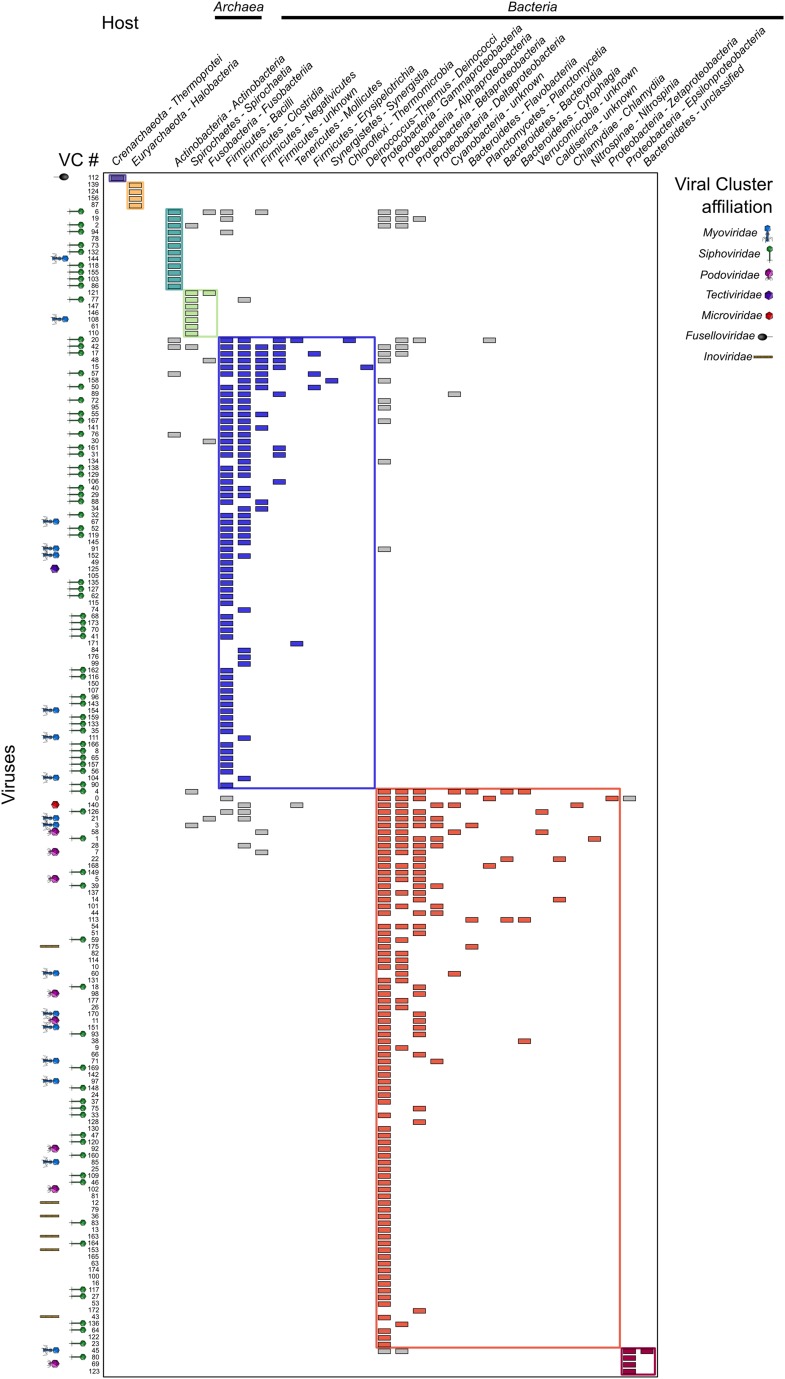
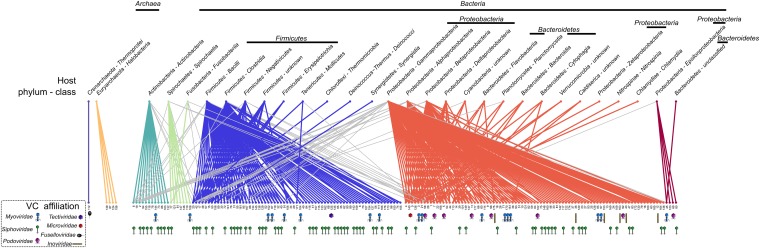
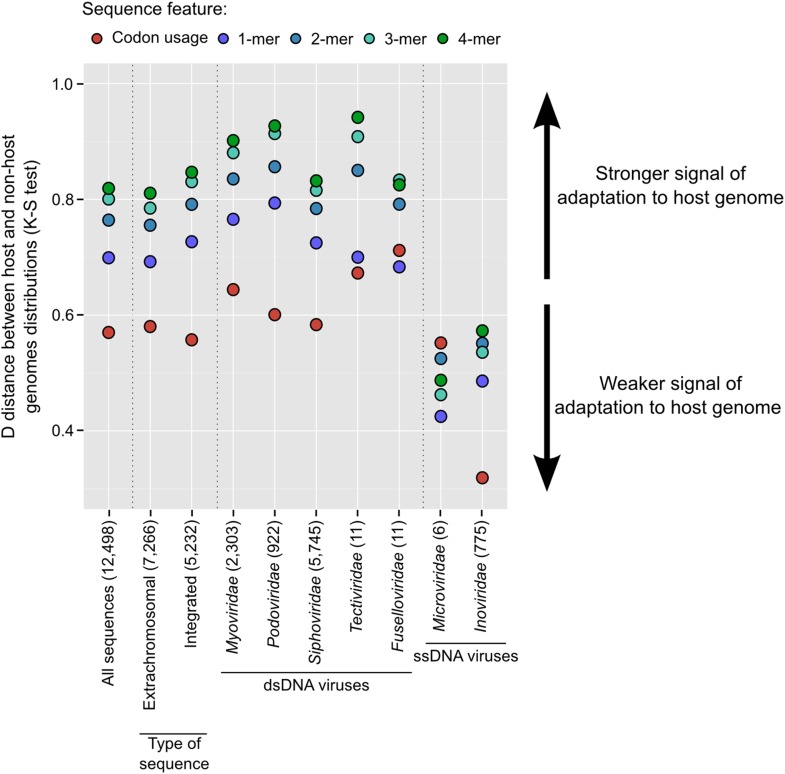
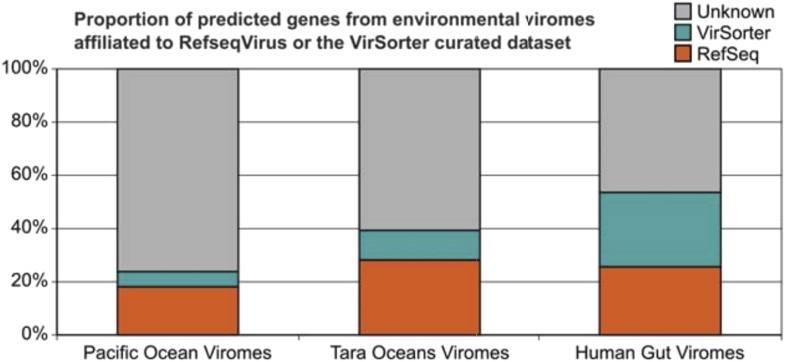
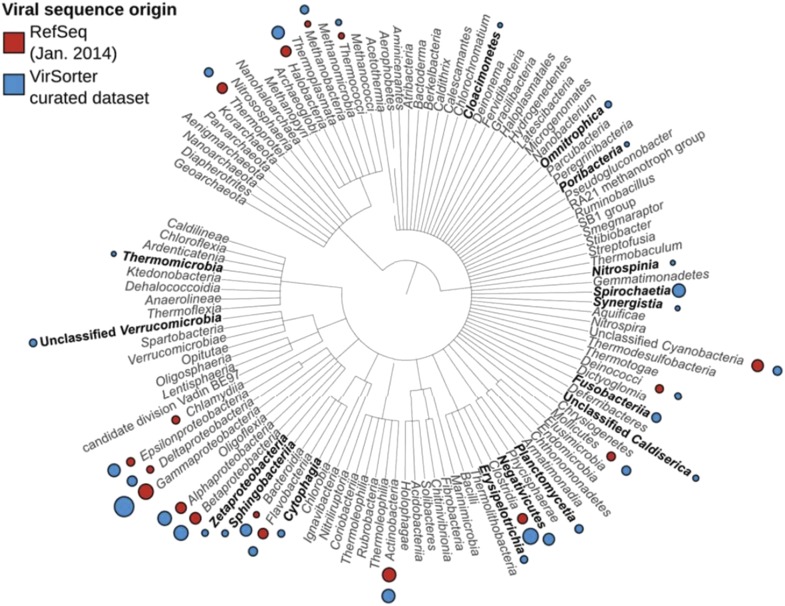
The ecological importance of viruses is now widely recognized, yet our limited knowledge of viral sequence space and virus-host interactions precludes accurate prediction of their roles and impacts. In this study, we mined publicly available bacterial and archaeal genomic data sets to identify 12,498 high-confidence viral genomes linked to their microbial hosts. These data augment public data sets 10-fold, provide first viral sequences for 13 new bacterial phyla including ecologically abundant phyla, and help taxonomically identify 7-38% of 'unknown' sequence space in viromes. Genome- and network-based classification was largely consistent with accepted viral taxonomy and suggested that (i) 264 new viral genera were identified (doubling known genera) and (ii) cross-taxon genomic recombination is limited. Further analyses provided empirical data on extrachromosomal prophages and coinfection prevalences, as well as evaluation of in silico virus-host linkage predictions. Together these findings illustrate the value of mining viral signal from microbial genomes.

Keywords: ecology; evolutionary biology; genomics; none; phage; prophage; virus; virus-host adaptation.


Conflict of interest statement

The authors declare that no competing interests exist.

Figures

Figure 1.
Figure 1.. Distribution of viral sequences from the VirSorter curated data set across the bacterial and archaeal phylogeny.
For each bacteria or archaea phylum (or phylum-level group), corresponding viruses in RefSeq (gray) and VirSorter curated data set (red) are indicated with circles proportional to the number of sequences available. Groups for which no viruses were available in RefSeq are highlighted in black. DOI: http://dx.doi.org/10.7554/eLife.08490.003
Figure 1—figure supplement 1.
Figure 1—figure supplement 1.. Viral diversity in the VirSorter data set.
The best BLAST hits of predicted proteins along each sequence (i.e., within 75% of the best BLAST hit for this sequence) were used in a Lowest Common Ancestor affiliation (here displayed at the family level). ‘Unclassified Caudovirales’ gathers viruses only affiliated to the Caudovirales level without confident affiliation to the Myo-, Sipho-, or Podoviridae. The number and percentage of sequences affiliated is indicated next to each family. DOI: http://dx.doi.org/10.7554/eLife.08490.007
Figure 1—figure supplement 2.
Figure 1—figure supplement 2.. Genome map comparison (A) and recruitment plot (B) of Bacteroidia virus sequences from a putative new order.
Replication-associated, Relaxase, and hypothetical proteins are depicted in blue, orange, and gray respectively. The recruitment plot includes two viromes from human feces samples from two different studies (Human gut assembly, Minot et al., 2012, and Human feces, Kim et al., 2011). Identity percentage is based on a blastn between virome contigs and the reference genome. DOI: http://dx.doi.org/10.7554/eLife.08490.008
Figure 2.
Figure 2.. Degree of novelty of viruses detected in VirSorter curated data set.
(A) Viral clusters (VCs) are considered as putative new genera when including at least one sequence larger than 30 kb, circular, or known to be a complete genome (from RefSeq). These putative genera were considered as ‘new’ when the VC did not include any RefSeq sequence, and ‘known’ otherwise. (B) The proportion of new VCs (containing no RefSeqABVir), VCs with only one RefSeqABVir sequence, and VCs with more than one RefSeqABVir sequence is displayed for host classes associated with more than 10 virl sequences. Only ‘putative genera’ VCs were considered (i.e., clusters containing a RefSeqABVir genome, a circular sequence, or a sequence with more than 30 predicted genes). DOI: http://dx.doi.org/10.7554/eLife.08490.009
Figure 2—figure supplement 1.
Figure 2—figure supplement 1.. Structure of viral sequence space sampled in VirSorter data set.
Network of virus clusters (VCs) based on gene content comparison between viral genome sequences from RefSeqABVir and VirSorter data set. VCs including only VirSorter sequences are highlighted with a black outline. The size of nodes is proportional to the number of sequences in the cluster and the color of the node corresponds to the BLAST-based affiliation (at the family level) of its members when consistent (i.e., agreement between >75% of the cluster members, otherwise clusters are indicated as ‘unaffiliated’). DOI: http://dx.doi.org/10.7554/eLife.08490.011
Figure 2—figure supplement 2.
Figure 2—figure supplement 2.. Benchmarks used to determine the best value for inflation and significance thresholds for virus clustering.
For each pair of values (inflation and significance threshold), the genome network was computed and its overall shape evaluated with ICCC (intra-cluster clustering coefficient). The chosen values are highlighted in green in the table and with a star on the associated plot. DOI: http://dx.doi.org/10.7554/eLife.08490.012
Figure 3.
Figure 3.. Extrachromosomal prophages in VirSorter curated data set and improvement in virome affiliation.
(A) The distribution of VirSorter curated data set as ‘integrated’ (i.e., prophages integrated in the host chromosome), ‘extrachromosomal’ (i.e., >30 kb or circular sequences with no microbial genes), or ‘undetermined’ (<30 kb linear with no microbial genes) is indicated for each host class with at least five VirSorter curated data set sequences. The number of sequences associated with each host class in indicated above the histogram. (B) Improvement in the proportion of affiliated genes from viromes with VirSorter data set. Predicted genes from the Pacific Ocean Viromes (Hurwitz and Sullivan, 2013), Tara Ocean Viromes (Brum et al., 2015), and Human Gut Viromes (Minot et al., 2012) were compared to RefSeqVirus (May 2015) and the VirSorter data set (BLASTp, threshold of 50 on bit score and 0.001 on e-value). Predicted proteins affiliated to VirSorter (in blue) did not display any significant similarity to a RefSeq sequence. DOI: http://dx.doi.org/10.7554/eLife.08490.013
Figure 3—figure supplement 1.
Figure 3—figure supplement 1.. Contig map of a putative new extrachromosomal prophage.
Contig Spirochaetia_gi_359585655 represent a complete genome (the contig was detected as circular) from a new genus (affiliated to a VC with no RefSeqABVir sequence). Functional affiliation of predicted genes is indicated on the map, with notably two genes (ParA/ParB) indicative of extrachromosomal prophages, as well as two genes (in orange) affiliated to the ACR_tran efflux pump family, of which some members are involved in antiobiotic resistance phenotypes. This contig belongs to the virus cluster VC_61, composed of 35 new putative extrachromosomal prophages from different Spirochetes genomes. DOI: http://dx.doi.org/10.7554/eLife.08490.014
Figure 4.
Figure 4.. Scale and range of co-infection.
(A) Number of different viral sequences detected by host genome. Numbers are based on the set of microbial genomes with at least one viral sequence detected (5492 genomes). (B) Affiliation of viruses involved in multiple infections of the same host. Affiliations are deduced from best BLAST hits alongside the viral sequences, as in Figure 1. Co-infections involving dsDNA and ssDNA viruses are highlighted in bold. DOI: http://dx.doi.org/10.7554/eLife.08490.015
Figure 5.
Figure 5.. Virus–host network between virus clusters and host classes (matrix visualization).
A cell in the matrix is colored when at least one virus from a virus cluster (VC, rows) was retrieved in a genome from a host class (columns). This virus–host network is detected as significantly modular by lp-Brim (modularity Q = 0.45; the same index computed from 99 randomly permuted matrices ranged from 0.02 to 0.17, with an average of 0.08). The different modules are highlighted in color, with inter-module links in gray. Virus clusters are identified by their number and their family-level affiliation (based on BLAST-based affiliation of the cluster members) is indicated next to each cluster when available (virus clusters with inconsistent members affiliation are considered as ‘unclassified’, affiliations are spread along the x-axis for spacing purpose). Host phylum and class are indicated for each host column, with domains indicated above the corresponding hosts. DOI: http://dx.doi.org/10.7554/eLife.08490.016
Figure 5—figure supplement 1.
Figure 5—figure supplement 1.. Virus–host network between virus clusters and host classes (network visualization).
An edge is displayed between a virus cluster (VC) and a host class when at least one virus from this cluster was retrieved in a genome from the host class. This network is detected as significantly modular by lp-Brim (modularity Q = 0.45; the same index computed from 99 randomly permuted matrices ranged from 0.02 to 0.17, with an average of 0.08). The different modules are highlighted in color, with inter-module links in gray. VCs are identified by their number and their family-level affiliation (based on BLAST-based affiliation of the cluster members) is indicated below each cluster when available (VCs with inconsistent members affiliation are considered as ‘unclassified’). Host phylum and class are indicated for each host node, with phyla (when multiple class from the same phylum are included in the network) and domains indicated above the corresponding host nodes. DOI: http://dx.doi.org/10.7554/eLife.08490.017
Figure 6.
Figure 6.. Adaptation of viral genome composition and codon usage to the host genome.
K–S distances between distributions of virushost distances and virus–non-host distances for each metrics (in color) and different subsets of the viral sequences (all sequences, by type, and by taxonomy). Only families with more than 5 genomes are displayed (although it should be noted that the VirSorter data set includes only 6 Microviridae sequences). The number of sequences in each category is indicated in brackets. Distributions used to compute distances are displayed in Figure 6—figure supplement 1. DOI: http://dx.doi.org/10.7554/eLife.08490.018
Figure 6—figure supplement 1.
Figure 6—figure supplement 1.. (A) K–S distances between distributions of virus–host distances and virus–non-host distances for each metrics (in color) and different subsets of the viral sequences (based on the number of tRNA genes detected).
The number of sequences in each category is indicated below the number of tRNA. (B) Distribution of k-mer distances between viral and cellular genomes and codon usage adaptation index for host, host genus, host family, and non-host (different order) genomes. For each viral genome, the distance to the host is displayed, as well as 10 randomly taken distances to genomes from each category and different subsets of the viral sequences (by taxonomy on the left column, and by number of tRNA genes on the rigth column). DOI: http://dx.doi.org/10.7554/eLife.08490.019
Figure 6—figure supplement 2.
Figure 6—figure supplement 2.. Distance between k-mer frequency vectors of virus genome subsamples and host genomes for Caudovirales.
Viral genomes (1000) were randomly sub-sampled at different sizes (from 2000 to 20,000 bp). Only Caudovirales genomes were selected for this subsample analysis. For each size of k-mer, the result of a linear regression of distance between host or non-host and viral subsample size is indicated. The same distances for the Microviridae and Inoviridae (taken from Figure 6A) are indicated for comparison, and associated with the size of the reference genome of each group (Enterobacteria phage phiX174 and Enterobacteria phage M13). For clarity's sake, the almost-identical values for 2-mer, 3-mer, and 4-mer for Microviridae are slightly horizontally shifted. DOI: http://dx.doi.org/10.7554/eLife.08490.020
Author response image 1.
Author response image 1.. Improvement in the proportion of affiliated genes from viromes with VirSorter dataset.
Predicted genes from the Pacific Ocean Viromes (Hurwitz and Sullivan, 2013), Tara Ocean Viromes (Brumnoza, et al., 2015) and Human Gut Viromes (Minot et al., 2013) were compared to RefSeqVirus (May 2015) and the 12.5k VirSorter dataset (BLASTp, threshold of 50 on bit score and 0.001 on e-value). Predicted proteins affiliated to VirSorter (in blue) did not display any significant similarity to a RefSeq virus, but can now be associated with a phage and a host through the VirSorter database. DOI: http://dx.doi.org/10.7554/eLife.08490.024
Author response image 2.
Author response image 2.. Viral sequences distribution of RefSeq and VirSorter dataset.
For each host group, a circle proportional to the number of viral genomes available is noted in red for RefSeq and blue for VirSorter. Hosts for which no RefSeq references were available are highlighted in bold. DOI: http://dx.doi.org/10.7554/eLife.08490.025

Comment in

References

    1. Abedon ST. Phage evolution and ecology. Advances in Applied Microbiology. 2009;67:1–45. doi: 10.1016/S0065-2164(08)01001-0. - DOI - PubMed
    1. Akhter S, Aziz RK, Edwards RA. PhiSpy: a novel algorithm for finding prophages in bacterial genomes that combines similarity- and composition-based strategies. Nucleic Acids Research. 2012;40:1–13. doi: 10.1093/nar/gks406. - DOI - PMC - PubMed
    1. Allers E, Moraru C, Duhaime MB, Beneze E, Solonenko N, Canosa JB, Amann R, Sullivan MB. Single-cell and population level viral infection dynamics revealed by phageFISH, a method to visualize intracellular and free viruses. Environmental Microbiology. 2013a;15:2306–2318. doi: 10.1111/1462-2920.12100. - DOI - PMC - PubMed
    1. Allers E, Wright JJ, Konwar KM, Howes CG, Beneze E, Hallam SJ, Sullivan MB. Diversity and population structure of Marine Group A bacteria in the Northeast subarctic Pacific Ocean. The ISME Journal. 2013b;7:256–268. doi: 10.1038/ismej.2012.108. - DOI - PMC - PubMed
    1. Andersson AF, Banfield JF. Virus population dynamics and acquired virus resistance in natural microbial communities. Science. 2008;320:1047–1050. doi: 10.1126/science.1157358. - DOI - PubMed

Publication types