. 2015 Jul 21;109(2):415-27.
doi: 10.1016/j.bpj.2015.06.017.

A human ventricular myocyte model with a refined representation of excitation-contraction coupling

Affiliations

A human ventricular myocyte model with a refined representation of excitation-contraction coupling

Yukiko Himeno et al. Biophys J. .

Abstract

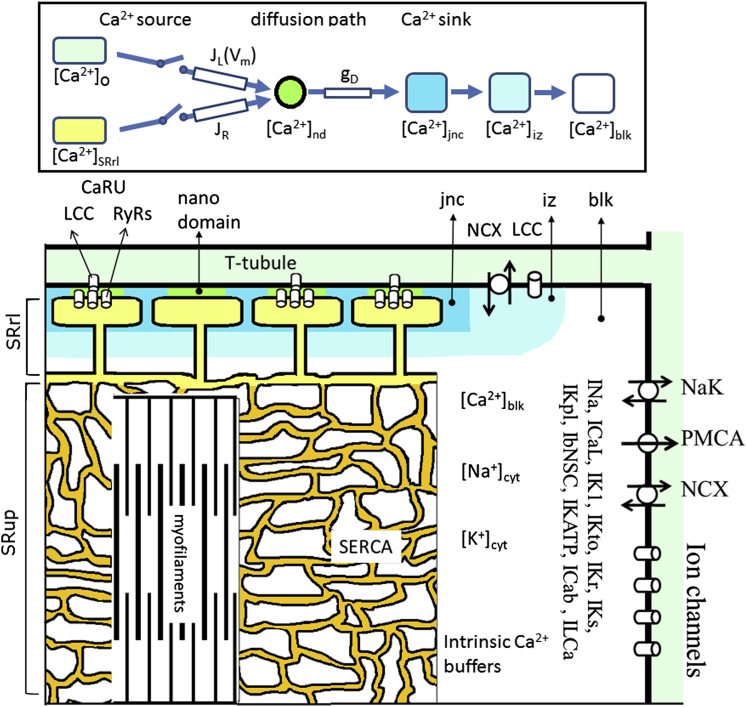
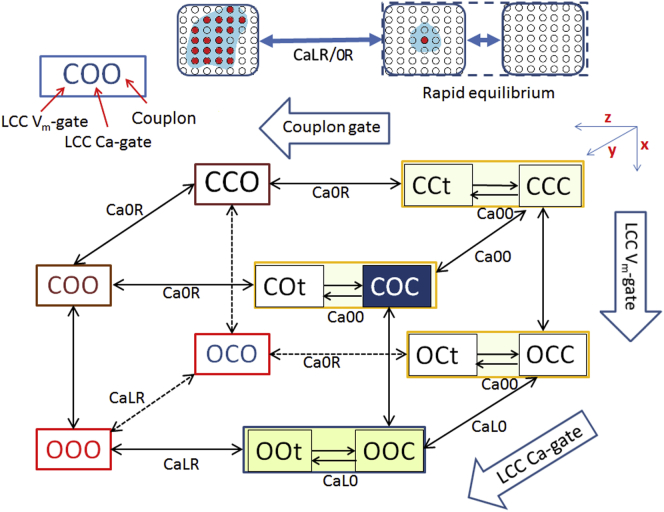
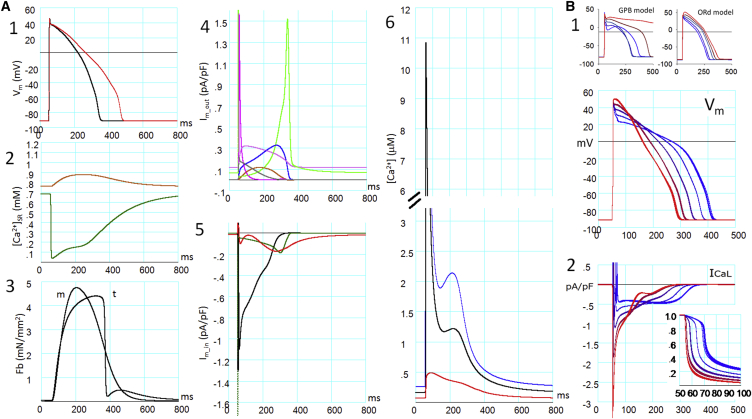
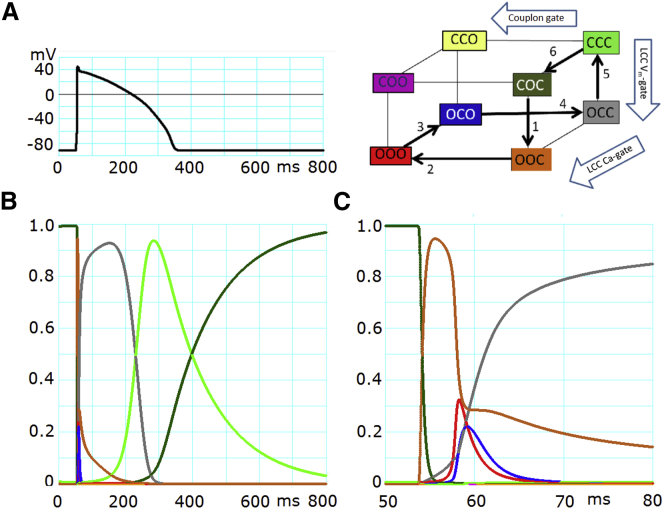
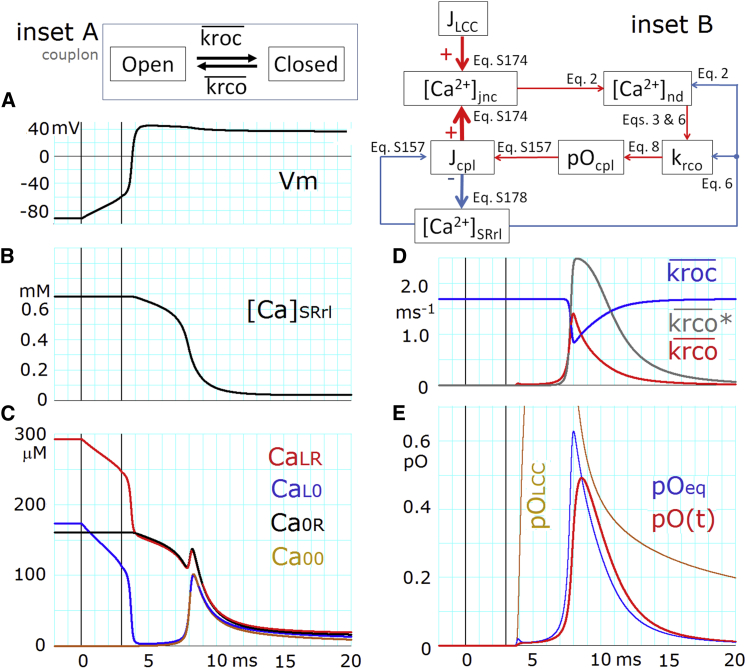
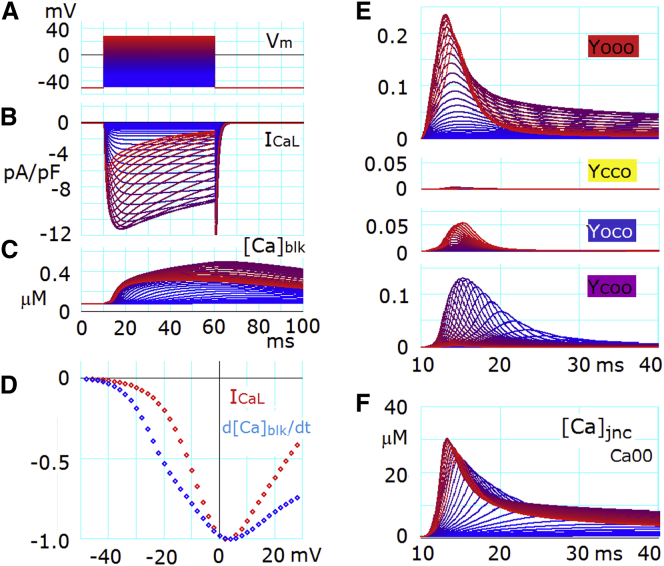
Cardiac Ca(2+)-induced Ca(2+) release (CICR) occurs by a regenerative activation of ryanodine receptors (RyRs) within each Ca(2+)-releasing unit, triggered by the activation of L-type Ca(2+) channels (LCCs). CICR is then terminated, most probably by depletion of Ca(2+) in the junctional sarcoplasmic reticulum (SR). Hinch et al. previously developed a tightly coupled LCC-RyR mathematical model, known as the Hinch model, that enables simulations to deal with a variety of functional states of whole-cell populations of a Ca(2+)-releasing unit using a personal computer. In this study, we developed a membrane excitation-contraction model of the human ventricular myocyte, which we call the human ventricular cell (HuVEC) model. This model is a hybrid of the most recent HuVEC models and the Hinch model. We modified the Hinch model to reproduce the regenerative activation and termination of CICR. In particular, we removed the inactivated RyR state and separated the single step of RyR activation by LCCs into triggering and regenerative steps. More importantly, we included the experimental measurement of a transient rise in Ca(2+) concentrations ([Ca(2+)], 10-15 μM) during CICR in the vicinity of Ca(2+)-releasing sites, and thereby calculated the effects of the local Ca(2+) gradient on CICR as well as membrane excitation. This HuVEC model successfully reconstructed both membrane excitation and key properties of CICR. The time course of CICR evoked by an action potential was accounted for by autonomous changes in an instantaneous equilibrium open probability of couplons. This autonomous time course was driven by a core feedback loop including the pivotal local [Ca(2+)], influenced by a time-dependent decay in the SR Ca(2+) content during CICR.


Figures

Figure 1
Figure 1
Composition of the HuVEC model demonstrated by a half-sarcomere. The compartments of jnc, iz, and blk in the cytosol, SR, and T-tubule are filled with different colors. The ion channels and transporters are located on the sarcolemma, SERCA and RyRs are on the SR membrane, and the contractile fibers are in blk. A single CaRU consists of a hypothetical LCC and a couplon in the junctional cleft (filled with green color), and individual CaRUs are spatially separated from their neighbors by jnc. The inset at the top shows a schematic presentation of the diffusion pathway of Ca2+ from the Ca2+ sources to the sink. JL, JR, and gD represent the permeability of single LCCs and RyRs, and the Ca2+ flux rate from nd to jnc, respectively. The myofilaments were embedded in an SR network (SRup). ICaL: L-type Ca2+ current; INa: sum of Na+ currents in transient and late modes; INaT + INaL; IK1: inward rectifier K+ current; IKr: rapid component of delayed rectifier K+ current; IKs: slow component of delayed rectifier K+ current; IKto: transient outward K+ current; IKpl: plateau K+ current; Il(Ca): Ca2+-activated background cation current; ICab: background Ca2+ current; IKATP: ATP-sensitive K+ current; IbNSC: background nonselective cation current; NaK: Na+/K+ pump; NCX: Na+/Ca2+ exchanger; PMCA: plasma membrane Ca2+ ATPase; SERCA: sarco-/endoplasmic reticulum Ca2+ pump.
Figure 2
Figure 2
Scheme of the state transitions of the CaRU model (see text for further explanation). The inset shown at the top is a schematic illustration of a cluster of RyRs corresponding to the closed, triggered, and activated states of a couplon from right to left, respectively. Circles filled with red are open RyRs and open circles are closed ones. The blue stretch in the vicinity of open RyRs is an image of spreading Ca2+. The first activation of a single RyR within a couplon is achieved either by Ca2+ influx through an activated LCC or by a spontaneous increase in [Ca2+]nd during various Ca2+-overload conditions.
Figure 3
Figure 3
(A and B) A standard AP in the HuVEC model (A) and the effects of increased [Ca2+]o on the AP and ICaL (B). The AP was evoked by a 3-ms current injection at 50 ms. When stabilized at CL = 1000 ms, the AP parameters were measured. (A1, the resting potential) Approximately −91.4 mV (−84 mV (50), −81 mV (51), −87 mV (52)); maximum rate of rise of the AP: 244 Vs−1 (comparable to that in Péréon et al. (52)); duration at 90% repolarization (APD90): 287 ms (300 ms (51,53,54); and the plateau of Vm immediately after phase 1 repolarization: ∼+37.7 mV. The red AP was obtained when IKr was completely suppressed in a separate protocol. (A2) [Ca2+]SRup (chocolate) and [Ca2+]SRrl (green). (A3) Isotonic Fb at 6 mN/mm2 (trace showing the delayed peak, t) and isometric Fb at 0.91 μm half sarcomere length (m) in mN/mm2. (A4) Outward current components (IKto (magenta), IKr (blue), IKs (chocolate), IK1 (yellow-green), IKpl (gray), and INaK (pink)). (A5) Inward current components (INaL (dark green), ICaL (black), and INCX (red)). The negative peak of INaL at the onset of the AP is off the scale. INaT was not plotted. (A6) [Ca2+]jnc (blue), [Ca2+]iz (black), and [Ca2+]blk (red). The large transient peak of [Ca2+]jnc is off the scale and not shown. (B1) APs after a change in [Ca2+]o are superimposed in the GPB and ORd models (top). Gradient colors from blue to red are coded in reference to [Ca2+]o, which was increased from 0.45 to 7.2 mM by a factor of 2. The same values for [Ca2+]o were applied to the HuVEC model, and five AP traces were obtained after a change in [Ca2+]o are superimposed (bottom). (B2) Traces of the ICaL current and open probabilities of its Ca2+-dependent inactivation gate (inset, with an expanded timescale) are shown using the same color code as in (B1).
Figure 4
Figure 4
State transitions of CaRU during the AP. (A) The AP was triggered by a 3-ms current injection at 50 ms. (B) The probability of each state of CaRU is plotted on the same timescale as in (A) (ms). Each trace color indicates the state of CaRU of the corresponding color in the inset. Arrows 1–6 in the inset show the direction of major fluxes of the CaRU state transition after onset of the AP. (C) The time courses of the same state probabilities as in (A) are plotted on an expanded timescale for the initial period of 50–80 ms.
Figure 5
Figure 5
Activation and deactivation of couplons determined by the positive-feedback mechanism. (A) AP. (B) [Ca2+]SRrl. (C) [Ca2+]nd (CaLR, CaL0, Ca0R, and Ca00). The dotted curves of CaLR, CaL0, and Ca0R indicate that they are theoretical values and have virtually no influence on the kinetics, since both the couplon and LCC are mostly closed during this period. (D) The overall activation rate ( krco¯ ) and deactivation rate ( krco¯ ) of the couplon and krco¯ were obtained after fixing [Ca2+]SRrl to a control value. (E) pO(t) (= Yooo + Ycoo + Yoco + Ycco, red), and pOeq and pOLCC (Yooo + Yooc; the peak is off the scale). The two vertical lines in all panels indicate the onset and offset of the stimulus current pulse. Inset A shows the reduced two-state transition of a couplon. Inset B shows the feedback loop formed by the five time-dependent variables, connected by five red arrows with equation numbers. The thick red and blue arrows indicate each Ca2+ release flux, which directly increases or decreases [Ca2+]jnc or [Ca2+]SRrl, respectively.
Figure 6
Figure 6
Graded Ca2+ release evoked by voltage-clamp pulses. (A) Voltage-clamp pulses for 50 ms were applied from a holding potential of −50 mV to various depolarized levels, from −38 to +30 mV, in increments of 2 mV. All recordings in all panels except for (D) are plotted with gradient colors from blue to red, coded in reference to the test potentials shown in (A). (B) Whole-cell ICaL. (C) [Ca2+]blk. (D) The voltage relationship of peak ICaL (red) and peak d[Ca2+]blk/dt (blue) was recorded with test pulses in 2 mV increments, normalized by each peak value. (E) Time evolution of Yooo, Ycco, Yoco, and Ycoo. (F) Ca2+ accumulation in jnc is represented by Ca00.

Similar articles

Cited by

References

    1. Priebe L., Beuckelmann D.J. Simulation study of cellular electric properties in heart failure. Circ. Res. 1998;82:1206–1223. - PubMed
    1. Ten Tusscher K.H., Bernus O., Panfilov A.V. Comparison of electrophysiological models for human ventricular cells and tissues. Prog. Biophys. Mol. Biol. 2006;90:326–345. - PubMed
    1. ten Tusscher K.H., Noble D., Panfilov A.V. A model for human ventricular tissue. Am. J. Physiol. Heart Circ. Physiol. 2004;286:H1573–H1589. - PubMed
    1. Grandi E., Pasqualini F.S., Bers D.M. A novel computational model of the human ventricular action potential and Ca transient. J. Mol. Cell. Cardiol. 2010;48:112–121. - PMC - PubMed
    1. O’Hara T., Virág L., Rudy Y. Simulation of the undiseased human cardiac ventricular action potential: model formulation and experimental validation. PLOS Comput. Biol. 2011;7:e1002061. - PMC - PubMed

Publication types

MeSH terms