. 2015 Jul 21;109(2):428-38.
doi: 10.1016/j.bpj.2015.06.007.

Emergent stem cell homeostasis in the C. elegans germline is revealed by hybrid modeling

Affiliations

Emergent stem cell homeostasis in the C. elegans germline is revealed by hybrid modeling

Benjamin A Hall et al. Biophys J. .

Abstract

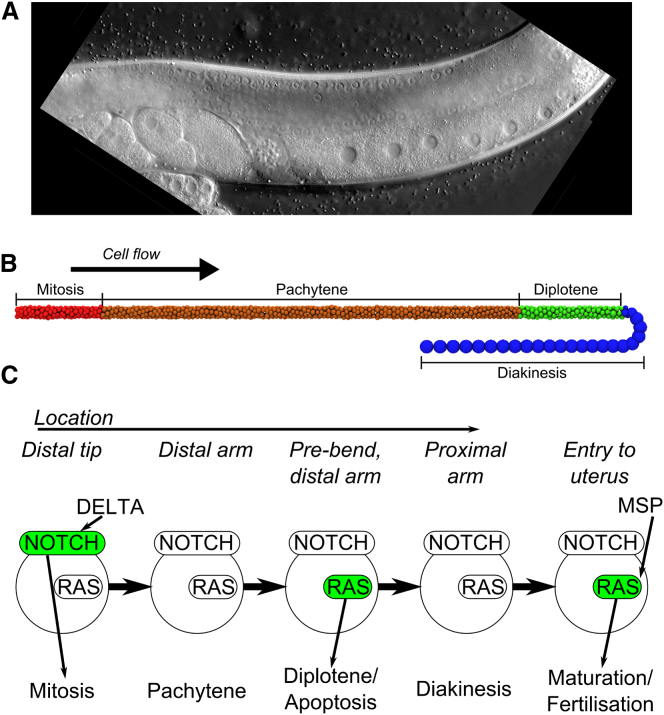
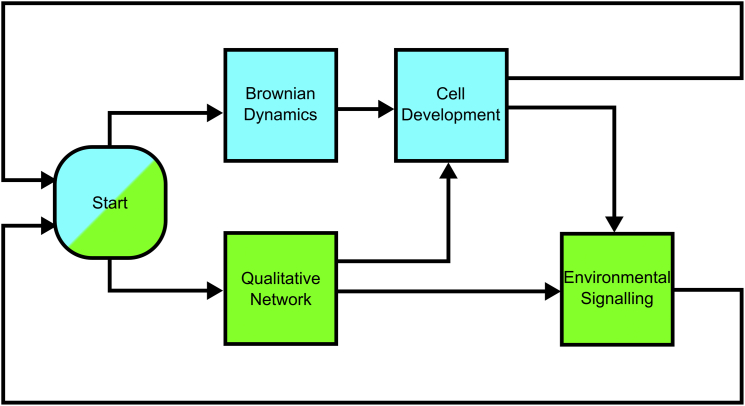
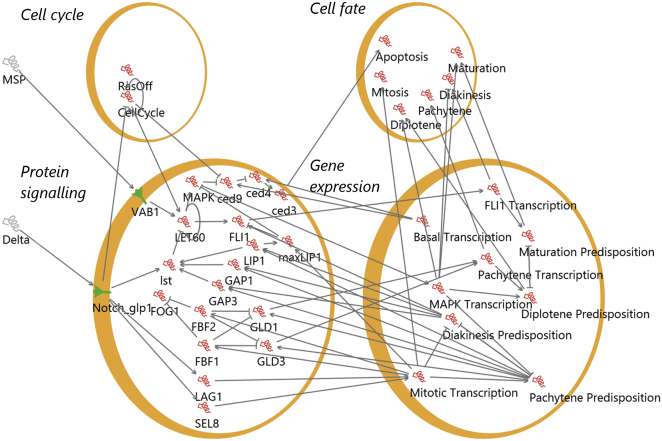
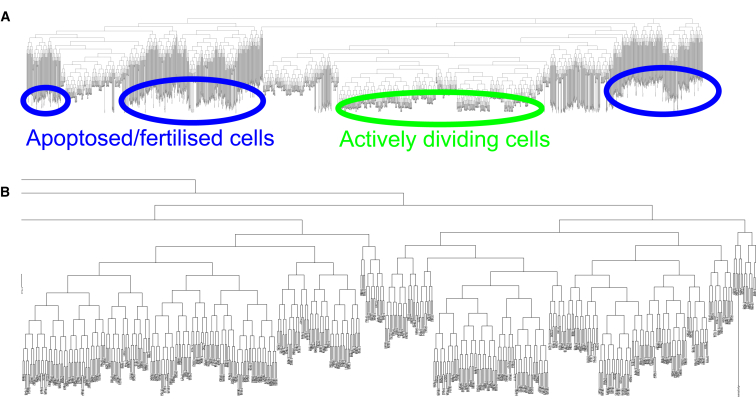
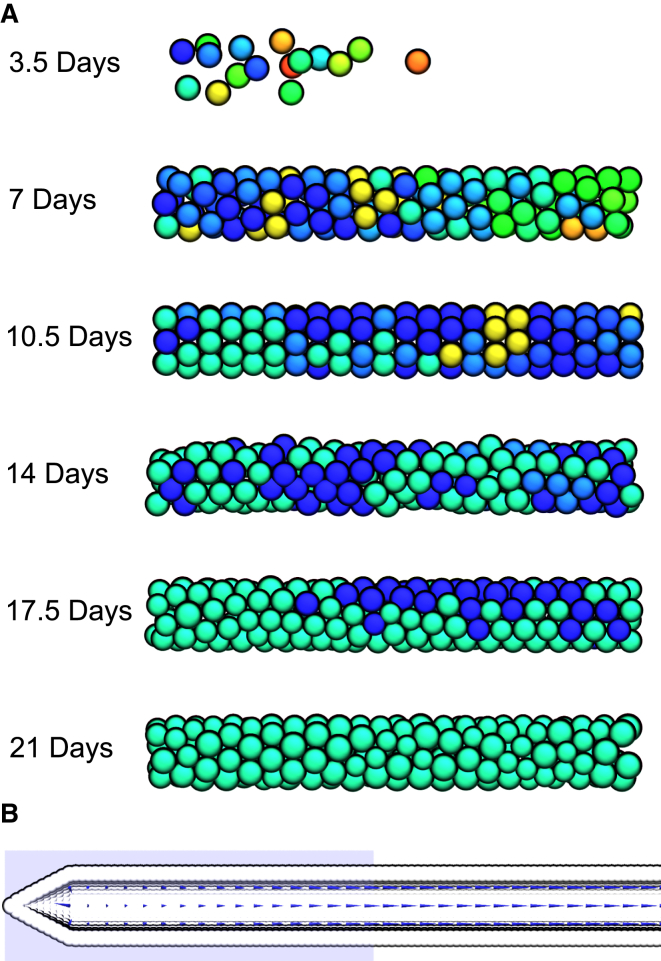
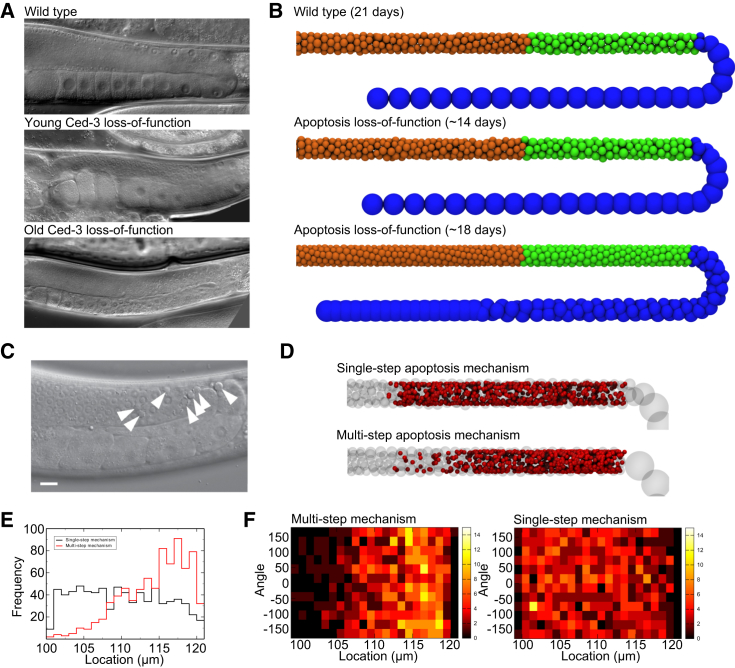
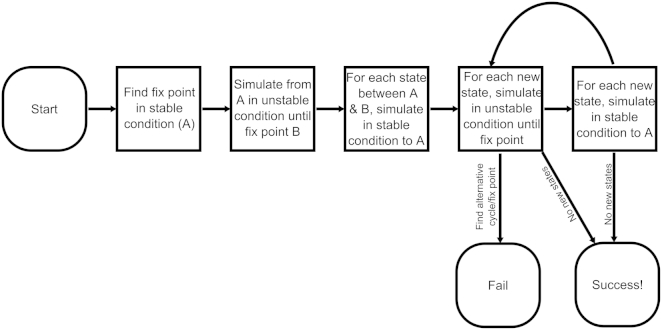
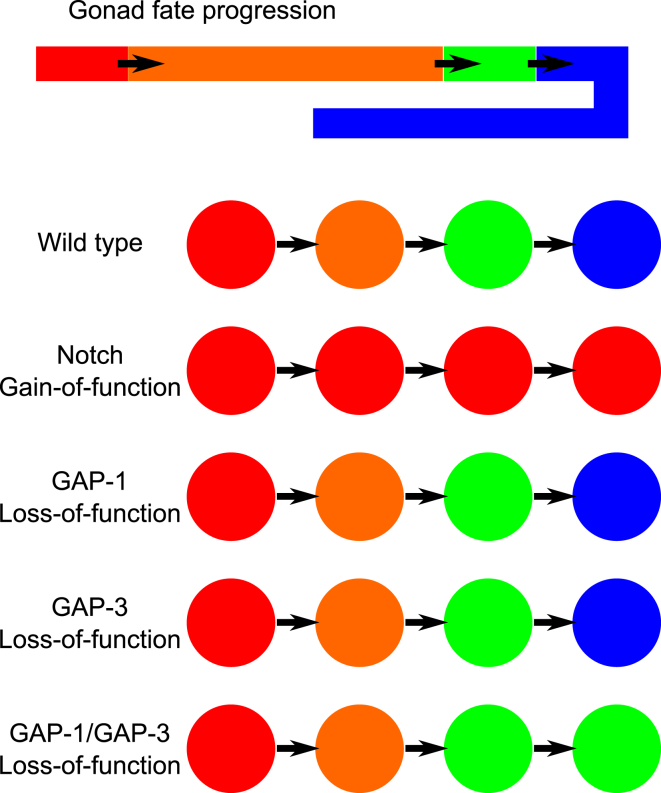
The establishment of homeostasis among cell growth, differentiation, and apoptosis is of key importance for organogenesis. Stem cells respond to temporally and spatially regulated signals by switching from mitotic proliferation to asymmetric cell division and differentiation. Executable computer models of signaling pathways can accurately reproduce a wide range of biological phenomena by reducing detailed chemical kinetics to a discrete, finite form. Moreover, coordinated cell movements and physical cell-cell interactions are required for the formation of three-dimensional structures that are the building blocks of organs. To capture all these aspects, we have developed a hybrid executable/physical model describing stem cell proliferation, differentiation, and homeostasis in the Caenorhabditis elegans germline. Using this hybrid model, we are able to track cell lineages and dynamic cell movements during germ cell differentiation. We further show how apoptosis regulates germ cell homeostasis in the gonad, and propose a role for intercellular pressure in developmental control. Finally, we use the model to demonstrate how an executable model can be developed from the hybrid system, identifying a mechanism that ensures invariance in fate patterns in the presence of instability.


Figures

Figure 1
Figure 1
Images of the C. elegans germline and our model. (A) Microscopy images of the germline. (B) The complete physical model of the germ cells. Cells in the distal tip undergo mitosis in response to DELTA, and movement out of the distal tip initiates cell behavior shifting to meiosis and entry into pachytene stage I (orange). RAS activation in the pachytene region causes progression through pachytene and entry into diplotene (green). In the bend region, germ cells progress into diakinesis (blue), begin oogenesis, and move into the proximal arm. The first 150 oocytes are fertilized at the end of the proximal gonad arm and removed from the simulation. Instead of progressing through diplotene/diakinesis, approximately half of the germ cells undergo apoptosis. After fertilization has ceased, the tube becomes blocked and oocytes cease moving. (C) A simplified model of fate progression in germline cells. DELTA activates NOTCH, triggering mitosis. Once a cell moves out of a DELTA-rich environment, cells enter pachytene where RAS activation causes pachytene exit and entry into diplotene or apoptosis. As RAS is downregulated, cells progress into diakinesis. Finally, the major sperm protein (MSP) induces oocyte maturation in the most proximal oocyte by reactivating the RAS/MAPK pathway.
Figure 2
Figure 2
Depiction of the hybrid model updates as a flow chart. The hybrid model is made of a set of cells, each of which consists of a physical particle and a single state of a QN. (Blue) Updates to the physical models; (green) updates to the QN. Initially, both the cell positions and QNs are updated independently, based on their previous state (see the main text for Brownian Dynamics, and Qualitative Networks). The cell particles are then updated based on the cell’s physical properties and the QN (cell development), to account for growth, division, and death of the cells. Cells that divide are replaced by two cells whose total volume is equal to the volume of the parent cell, and each with a QN in the same state as the parent. Finally, the QN is updated according to the new positions and physical properties of the cell. To see this figure in color, go online.
Figure 3
Figure 3
QN model of germ cell signaling, rendered in the BMA. Cell fates, cell cycle events, protein signaling networks, and gene expressions are represented as separate entities for clarity. Each gene, protein, or fate is a separate variable in the QN. To see this figure in color, go online.
Figure 4
Figure 4
Simulated lineage of germline cells. (A) The complete lineage of model germline cells descended from a single cell over 21 days. Cell divisions are indicated by a fork in the lineage. (Long, vertical shaded lines) Cells have stopped dividing for a period of time and been removed from the simulation (by death or fertilization). Fertilization and apoptosis can be seen to remove entire branches of the lineage, but at any one time the pool of proliferating cells is made up of a number of different branches due to thermal mixing (the randomization of mitotic planes by Brownian motion). (B) Expanded lineage showing just the population of dividing cells at the end of the simulation. The final set of dividing cells is separated by up to 13 generations. Seven to eight generations would be sufficient to generate ∼200 cells to fill the distal tip. To see this figure in color, go online.
Figure 5
Figure 5
Dynamics of the stem cell population. (A) At 3.5 days, every cell is given a unique color and all descendants of that cell retain the same color. In the model, it takes ∼18 days for ancestors of one of these cells to exclusively dominate the distal tip (roughly 22 generations). In principle, the descendants of a single cell could dominate within eight generations (7 days). (B) The vector field of average cellular motion across 21 days (plotted as blue spikes). (White) Cross section of the gonadal wall; (blue box) distal tip region. In the mitotic region, the forces generated by cellular division cause cells to move randomly, which in turn causes the averages to be small and/or directionless. Cells in the pachytene stage and at the edge of the distal tip zone move clearly in a single direction, driven by forces generated through division in the distal tip.
Figure 6
Figure 6
Effects of apoptosis mutations and alternative mechanisms. (A) Microscopy images showing germ cells in wild-type animals, and young and old Ced-3 loss-of-function mutations. (B) Wild-type models at 21 days show a distinct pattern of states across the length of the tube, with large oocytes in the distal arm and bend, after RAS downregulation. While apoptosis loss-of-function mutations appear normal at 14 days, the excess flow in cells caused by the loss from cell death causes smaller oocytes to move into the distal arm in older worms. Cells are colored by fate (orange, pachytene; green, diplotene; blue, diakinesis). (C) Microscopy image taken from Pinto and Hengartner (47) showing apoptosis preferentially occurring just before the bend (corpses indicated by white arrows). (D) Locations of apoptosis in two mechanisms of apoptosis (red spheres; transparent spheres show cell positions in a single frame, for reference). In a single-step model, cells randomly die and are removed from the simulation immediately, while in the multistep model cells randomly shrink until they reach a minimum size, and then die and are removed from the simulation. The single-step model results in deaths evenly distributed along the RAS activation zone, while in the multistep model cells die preferentially at the end of the RAS zone. (E) Histogram showing frequency of death as a function of location in the gonad. The RAS zone ranges from 100 μm to the bend at 120 μm. (F) Heat maps quantitatively showing the distribution of deaths around the tube for different death models. Deaths are evenly distributed across the radius of the tube.
Figure 7
Figure 7
Proving all accessible states lead to a single fix point when moving from a stabilizing environment to an unstable environment. Cells at the border between two environments may move back and forth across the boundary due to diffusive motion. The different environments are represented by changes in constant values in the model (different conditions). All accessible states in the two different conditions are enumerated and tested to find whether they lead to the same fix point or not. This proceeds as follows: in the stable environment, the stable state is identified (shown as A). A simulation from state A in the unstable condition is performed until fix-point B is reached, and the set of states between A and B are collected. For each state, a simulation is performed in the stable condition until A is reached, and the set of states encountered in each simulation is recorded. If these have not been observed previously, simulations are performed in the unstable condition to determine if they reach fix-point B. This is repeated until either no new states are found (i.e., all accessible states have been identified), or an alternative fix point or cycle is discovered.
Figure 8
Figure 8
Fate progressions of germline cells. Germline cells follow an invariant developmental path from a mitotic state (red), to the pachytene stage I (orange), to diplotene (green), and finally to diakinesis (blue). This progression of fates observed in the hybrid model can be abstracted to an executable model, where we can characterize different mutations in terms of distinct fate progressions. This new executable model highlights that any instability of the germline cells in the absence of ligand can always lead to an invariant fate progression if the initial mitotic state is stable.

Similar articles

Cited by

References

    1. Kimble J., Crittenden S.L. Germline proliferation and its control. WormBook. 2005:1–14. - PMC - PubMed
    1. Kimble J.E., White J.G. On the control of germ cell development in Caenorhabditis elegans. Dev. Biol. 1981;81:208–219. - PubMed
    1. Lander A.D., Kimble J., Oskarsson T. What does the concept of the stem cell niche really mean today? BMC Biol. 2012;10:19. - PMC - PubMed
    1. Maciejowski J., Ugel N., Hubbard E.J. Quantitative analysis of germline mitosis in adult C. elegans. Dev. Biol. 2006;292:142–151. - PubMed
    1. Crittenden S.L., Leonhard K.A., Kimble J. Cellular analyses of the mitotic region in the Caenorhabditis elegans adult germ line. Mol. Biol. Cell. 2006;17:3051–3061. - PMC - PubMed

Publication types