. 2015 Jul 22;10(7):e0132595.
doi: 10.1371/journal.pone.0132595. eCollection 2015.

The DNA-Binding Domain of S. pombe Mrc1 (Claspin) Acts to Enhance Stalling at Replication Barriers

Affiliations

The DNA-Binding Domain of S. pombe Mrc1 (Claspin) Acts to Enhance Stalling at Replication Barriers

Juergen Zech et al. PLoS One. .

Abstract

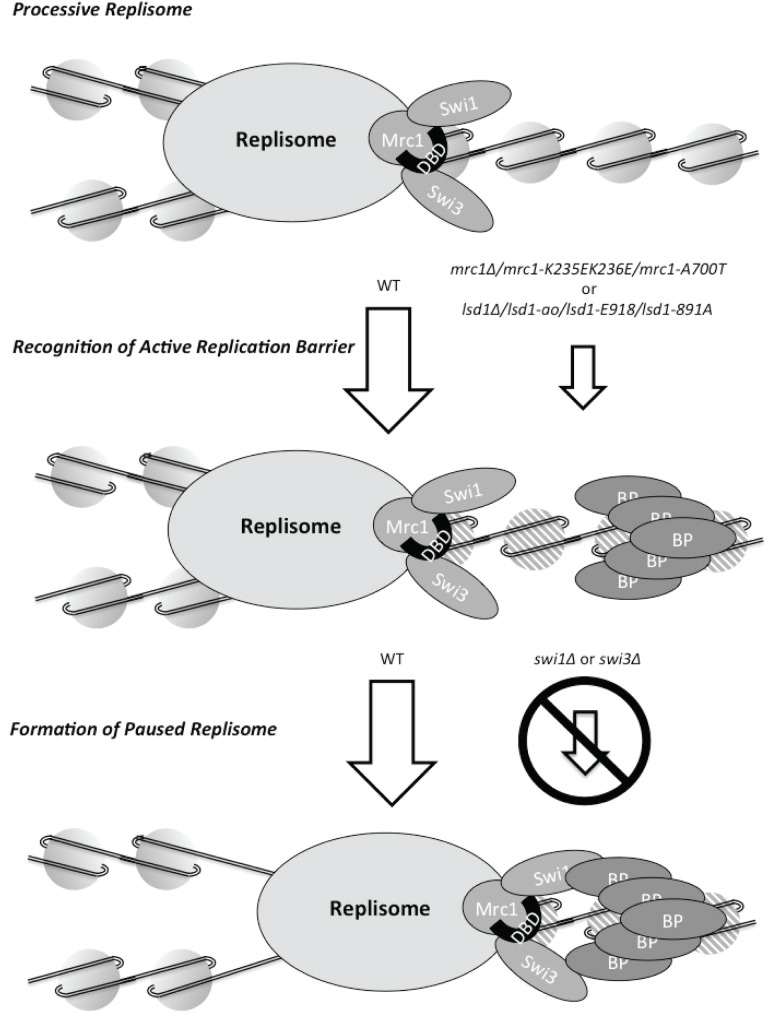
During S-phase replication forks can stall at specific genetic loci. At some loci, the stalling events depend on the replisome components Schizosaccharomyces pombe Swi1 (Saccharomyces cerevisiae Tof1) and Swi3 (S. cerevisiae Csm3) as well as factors that bind DNA in a site-specific manner. Using a new genetic screen we identified Mrc1 (S. cerevisiae Mrc1/metazoan Claspin) as a replisome component involved in replication stalling. Mrc1 is known to form a sub-complex with Swi1 and Swi3 within the replisome and is required for the intra-S phase checkpoint activation. This discovery is surprising as several studies show that S. cerevisiae Mrc1 is not required for replication barrier activity. In contrast, we show that deletion of S. pombe mrc1 leads to an approximately three-fold reduction in barrier activity at several barriers and that Mrc1's role in replication fork stalling is independent of its role in checkpoint activation. Instead, S. pombe Mrc1 mediated fork stalling requires the presence of a functional copy of its phylogenetically conserved DNA binding domain. Interestingly, this domain is on the sequence level absent from S. cerevisiae Mrc1. Our study indicates that direct interactions between the eukaryotic replisome and the DNA are important for site-specific replication stalling.


Conflict of interest statement

Competing Interests: The authors have declared that no competing interests exist.

Figures

Fig 1
Fig 1. The use of mating-type switching of S. pombe as a screening tool to identify genes, influencing the stalling of DNA replication forks at the MPS1 site.
(A) Mechanism of mating-type switching in S. pombe: S. pombe cells can switch between two different mating-types Plus (P) and Minus (M). Top line drawing. The mating-type of a cell is determined by the mat1 locus, which can contain either P or M information. Switching involves the precise replacement of the mating-type cassette at mat1 with the opposite mating-type information through a recombination event that utilizes one of two donor-loci, located centromere-distal to mat1, mat2P or mat3M, as donors of the genetic information (top line-drawing). In addition, cells of the two mating-types can either be un-switchable (M, P) or switchable (M*, P*); switchable cells carry a ribonucleotide imprint at the mat1 locus (see below). Importantly, the mat1 locus is replicated in a uni-directional manner due to the presence of a terminator of replication (the RTS1 element) on the centromere-proximal (cen) side. Lower line drawings. (I) When DNA replication takes place in S-phase, the replisome replicating mat1 pauses at the MPS1 barrier located at the boundary of the mat1 cassette. This pause leads to the site-specific priming of an Okazaki fragment. (II) The replication fork then progresses on, and the primer from the Okazaki fragment is converted into an imprint consisting of two ribonucleotides incorporated into the DNA. (III) After cell division, this imprint is inherited by one daughter cell (M*) making it capable of switching mating type: (IV) In the following S-phase a break is introduced at the site of the imprint, when the leading-strand runs into the imprint present in the template strand, (V) leading to the induction of the recombination event (bold dashed line) that underlies mating-type switching. (B) To identify factors involved in replication pausing at the MPS1 site, the Bioneer knockout library was crossed with an h 90 strain that had been tagged at the mat1 locus with a S. cerevisiae LEU2 genetic marker. The sporulation phenotype of different gene knockouts was examined after selection on YEA+G418+cyclohexamide (the different genes are knocked out with a Kan R cassette, and cyclohexamide kills diploid cells due the recessive cyh r mutation) followed by selection on AA-Leu (LEU2 is linked with mat1). Low and non-sporulating strains were identified by iodine staining of strains grown on sporulation media (PMA+), and these candidate strains where analysed by Southern blot analysis to further assess the level of mat1 imprinting. Δmrc1 was identified and verified as a candidate that influenced pausing at the MPS1 barrier. (C) Sporulation staining phenotype and sporulation levels of Δmrc1 generated from the Bioneer knockout library, as well as of the mrc1-A700T (K234Stop) generated according to Holmes, et al. [40]. The low sporulation phenotype of the Δmrc1 stain can be complemented by the transformation of a plasmid containing a genomic copy of the mrc1 gene (pMRC1). Strain names are given above each panel, and the percentage of spores observed in the colonies by confocal microscopy is given below. Graphs to the right display the level of sporulation observed in the mutant colonies relative to wild-type colonies (100%).
Fig 2
Fig 2. Characterization of the mrc1 mutations.
(A) Top line-drawing; schematic representation of the mating type region showing the 10.4 kb HindIII fragment containing the mat1 locus. The positions of the imprint-dependent DSB and of the S. cerevisiae LEU2 gene inserted in the mat1 region (strain JZ217) are indicated. (B) Left panel, Southern blot of HindIII-digested DNA probed with a mat1P specific probe. This probe hybridises to the mat1 (10.4 kb), mat2P (6.3 kb) and mat3M (4.2 kb) cassettes as well as to the mat1 DSB products (5.0 and 5.4 kb, DSB). Above the panel, strains names are given. Below the panel the mrc1 alleles (vertical bold text) and the mat1 alleles (horizontal text) are given. To the right a graph displays the mean level of DSBs in the strains relative to the wild-type level (100%). The values are based on two measurements, with values indicated with vertical lines. (C) Comparison of sporulation levels of the Δmrc1 strain to swi1-111 and swi3-146 strains. To the right a graph displays the mean level of sporulation in the strains relative to the wild-type level (100%). See Fig 1C for description. (D) Comparison of imprinting levels between Δmrc1, swi1-111 and swi3-146 strains. For description see panel 1B. (E) Top line-drawing; WT; schematic representation of the 2.7 kb NdeI fragment of the mating-type region used to examine replication fork pausing at the mat1 MPS1. The position of the DSB, the polarity of replication in this region (black arrow), the replication pause site MPS1 and the position of the probe used to hybridise 2D-gels of this region are shown. Middle panels, quantification of replication pausing in wild type and mrc1 strains at the MPS1 site (the pause signal is indicated with an arrow and P). Genotypes and strain names are given above the 2D-gel panels. Below the panels the intensity of the replication fork pause signal is shown for each strain as a percentage of the WT pause signal’s intensity. Two independent experiments were performed and the mean is given. Lower panel, graph displaying the data obtained above.
Fig 3
Fig 3. Quantification of the effect the Δmrc1 mutation has on the replication pausing and termination at different barriers.
(A) Left panel, schematic representation of the mating-type region containing the replication termination site RTS1, the mat1 locus, the polarity of replication within the region and the replication pause site MPS1. The plasmid pBZ142 contains the RTS1 site element and the ars1 origin [83]. Middle and right panel, deletion of mrc1 reduces replication termination (indicated with an arrow and T) and pausing (indicated with an arrow and P) at the RTS1 (probed with a 0.8 kb BamHI fragment from pBZ142). Genotypes and strain names are given above the 2D-gel panels, and the relative intensity of the barrier signals below. Graphs; the replication fork pausing and termination signals’ intensities are given for each strain as a percentage of the WT signals. The results given are the mean from two independent experiments. (B) Left panel, schematic representation of the BamHI fragment of an rDNA repeat containing the gene for 28S ribosomal RNA, the polarity of PolI transcription, the position of the 0.55 kb probe used for the Southern analysis of 2D-gels, the rDNA barriers and the ars3001 origin [84]. Middle and right panels, see above for description. (C) Left panel, schematic representation of the plasmid pJR-3XU containing the tRNA-Glu08 gene and the ars1 origin [54]. Middle and right panels, see above for description (probe 0.6 kb BamHI, SacI fragment from pJR1-3XU).
Fig 4
Fig 4. Mrc1 influences pausing at MPS1 independently of the presence and absence of the imprint in mat1 and its function in the S-phase checkpoint.
(A) Quantification of the amount of pausing in an Msmt0 genetic background. Top panel, line drawing of the mat1 locus, displaying the position of the smt0 deletion. Lower panels, 2D-gel analysis of the mat1 locus from Msmt0 and Msmt0 Δmrc1 strains. For a description refer to Fig 2E legend. (B) Effect of the deletion of S-phase checkpoint genes on sporulation. Top line drawing; line drawing; Domain structure of Mrc1. The positions of the DNA binding domain and the Rad3 SQ/TQ phosphorylation sites are indicated. Bottom panel; characterization of the sporulation phenotype of rad3, cds1, chk1 and mrc1-3A mutant strains. Photographs of individual colonies stained with iodine are shown. Below each picture the percentage of sporulation is given. Graphs below show the percentage of sporulation relative to that observed for the wild-type strain (100%). (C) Top line drawing. Replication stress at the replication progression complex (RPC) leads to Hsk1 dependent hyper-phosphorylation of Mrc1. Middle and bottom panels; sporulation phenotypes of given strains. For description see Fig 1C legend. Please note that a decreased sporulation phenotype has previously been observed in a hsk1-ts mutant [59]. (D) Quantification of imprinting levels for the strains given above in (C). Asterix indicates signal due to plasmid-probe cross hybridisation. For a description refer to Fig 2B legend.
Fig 5
Fig 5. Quantification of the effect of the abolition of the DNA-binding activity of mrc1 on the mat1 imprinting and MPS1 replication pausing.
(A) Alignment of the helix-turn-helix DNA binding domain present in the family of Mrc1 proteins. The alignment was made using Clustal [85]. The consensus of the conserved domain is given below. In the last line the corresponding region of S. cerevisiae Mrc1 is shown. (B) Schematic representation of the mutant mrc1 alleles. The positions of the mutations affecting the DNA-binding domain and Rad3 phosphorylation sites are given. (C) Left panels; staining phenotypes and sporulation levels of strains carrying the mrc1 DNA-binding domain mutations (see Fig 1 panel C legend for description). (D) Top line drawing; schematic representation of the mating type region, showing the 10.4 kb HindIII fragment containing the mat1 locus. Lower left panel, Southern blot of HindIII-digested DNA from mrc1 strains hybridised with a mat1P specific probe. (see Fig 2A & 2B legend for description). Lower right panel, graphical representation of the DSB signal strengths as a percentage of the WT signal’s strength. (E) Top panel; schematic representation of the 2.7 kb NdeI fragment of the mating-type region used to examine replication fork pausing at MPS1. Middle panels, 2D-gel analysis of replication pausing at MPS1 in wild type and mutant strains (for a description see Fig 2 panel B). Lower panel, the replication fork pausing is given for each strain as percentage of the WT pause signal. The mean is given for data obtained from two independent experiments.
Fig 6
Fig 6. Detection of a functional intra-S phase checkpoint in the mrc1-K235E, K236E mutant genetic background.
WT, mrc1-K235E, K236E, Δmrc1, swi1-111 strains were grown logarithmic in rich YEA media. Cultures were exposed either to 0%, 0.0075% or 0.015% MMS for 2 and 4 hours. Cells cultures were analysed by FACS as displayed. The concentration of MMS used is given above the panels and the genotypes and strain names below the panels.
Fig 7
Fig 7. Time-course of replication pausing at the MPS1 of a cdc10-ts Δmrc1 mutant and cdc10-ts strains.
(A) Line-drawing of the analysed region.; Schematic representation of the 2.7 kb NdeI fragment of the mating-type region used to examine replication fork pausing at the mat1 MPS1. The position of the DSB and the polarity of replication in this region (black arrow), the replication pause site MPS1 are shown. (B) Outline of the experimental procedure used for experiment shown in panel D. (C) 2D-gel analysis of log-phase cultures. (D) 2D-gel and FACS analysis of synchronized cultures progressing through S-phase. The analysed region is shown in panel A. Time points are given to the left of the panels. Genotypes and strain names are shown on top of the panels. Experimental procedure is shown in Panel B. (E) Direct quantification of the pause singals’ intensities for experiment shown in panel D. Only the three given time-points were quantified.
Fig 8
Fig 8. Model of replisome stalling at protein-mediated DNA replication barriers in S. pombe.
The replisome arriving at a DNA replication barrier with a receptive chromatin structure (marked by hatched histones) recognizes the DNA replication barrier by an interaction between the chromosomal DNA and the Mrc1 DNA binding domain. This process facilitates the formation of a stably paused replisome mediated by Swi1, Swi3 and barrier-specific chromatin-bound non-histone proteins (BP). Mutations leading to a loss of function of the catalytic domain of lsd1 or the mrc1 DNA binding domain reduce barrier activity. Loss of function mutations of swi1 or swi3 abolish barrier activity.

Similar articles

Cited by

References

    1. Dalgaard JZ, Godfrey EL, MacFarlane RJ (2011) Eukaryotic Replication Barriers: How. Why and Where Forks Stall In: Seligmann H, editor. DNA Replication-Current Advances: INTECH; pp. 269–304.
    1. Voineagu I, Narayanan V, Lobachev KS, Mirkin SM (2008) Replication stalling at unstable inverted repeats: interplay between DNA hairpins and fork stabilizing proteins. Proc Natl Acad Sci U S A 105: 9936–9941. 10.1073/pnas.0804510105 - DOI - PMC - PubMed
    1. Voineagu I, Surka CF, Shishkin AA, Krasilnikova MM, Mirkin SM (2009) Replisome stalling and stabilization at CGG repeats, which are responsible for chromosomal fragility. Nat Struct Mol Biol 16: 226–228. 10.1038/nsmb.1527 - DOI - PMC - PubMed
    1. Liu G, Myers S, Chen X, Bissler JJ, Sinden RR, Leffak M (2012) Replication fork stalling and checkpoint activation by a PKD1 locus mirror repeat polypurine-polypyrimidine (Pu-Py) tract. J Biol Chem 287: 33412–33423. - PMC - PubMed
    1. Krasilnikov AS, Panyutin IG, Samadashwily GM, Cox R, Lazurkin YS, Mirkin SM (1997) Mechanisms of triplex-caused polymerization arrest. Nucleic Acids Res 25: 1339–1346. - PMC - PubMed

Publication types

MeSH terms