

Increased human AP endonuclease 1 level confers protection against the paternal age effect in mice
- PMID: 26201249
- PMCID: PMC4554949
- DOI: 10.1016/j.mrfmmm.2015.06.008
Increased human AP endonuclease 1 level confers protection against the paternal age effect in mice
Abstract
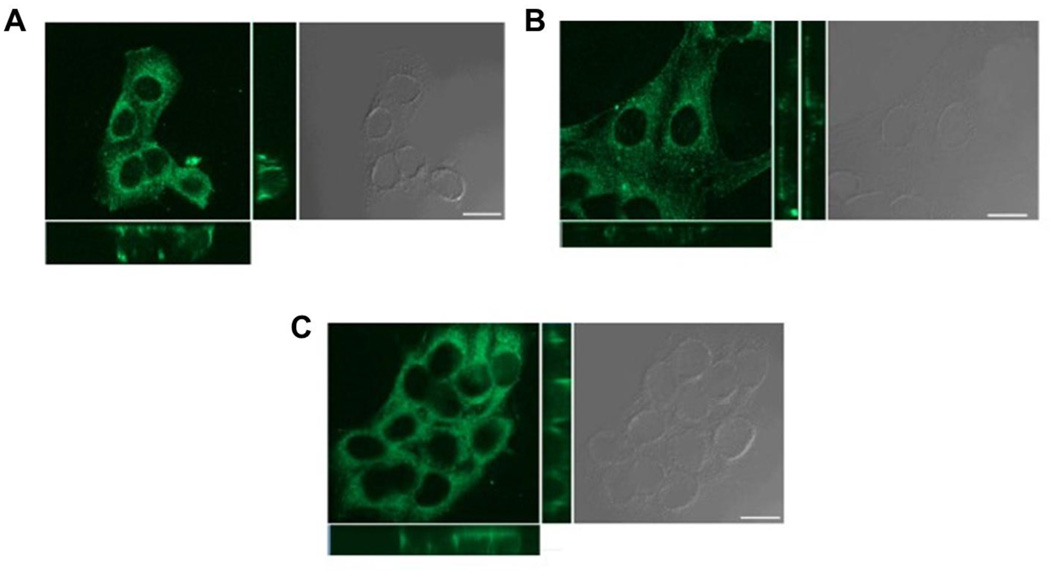
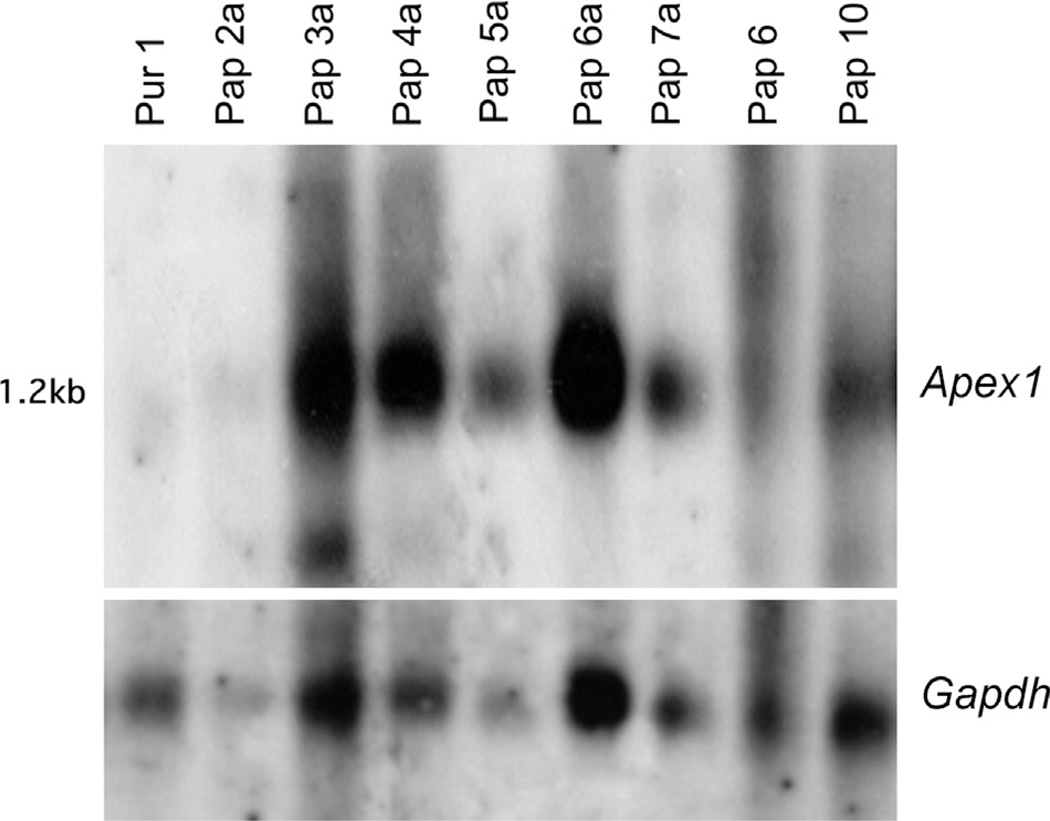
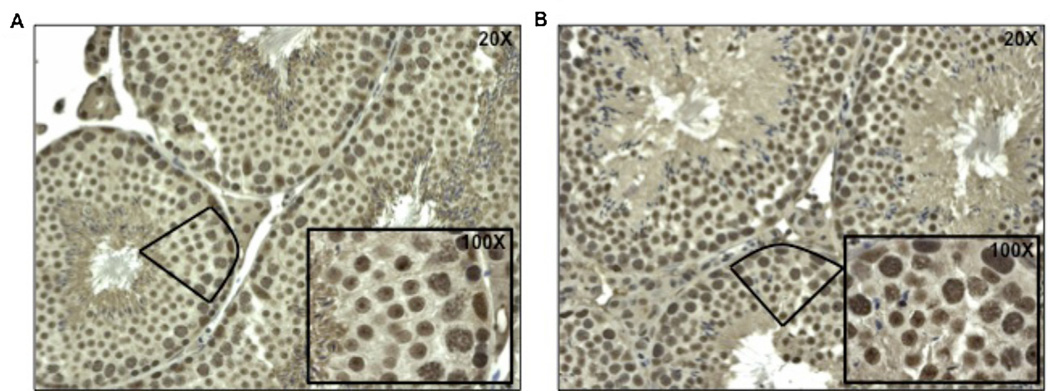
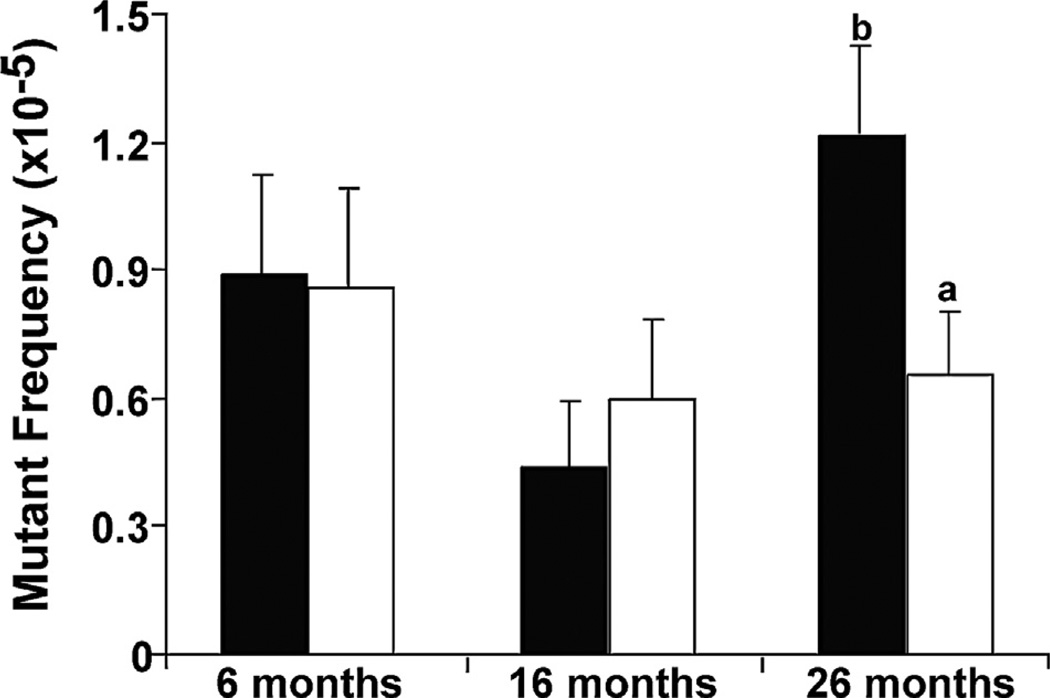
Increased paternal age is associated with a greater risk of producing children with genetic disorders originating from de novo germline mutations. Mice mimic the human condition by displaying an age-associated increase in spontaneous mutant frequency in spermatogenic cells. The observed increase in mutant frequency appears to be associated with a decrease in the DNA repair protein, AP endonuclease 1 (APEX1) and Apex1 heterozygous mice display an accelerated paternal age effect as young adults. In this study, we directly tested if APEX1 over-expression in cell lines and transgenic mice could prevent increases in mutagenesis. Cell lines with ectopic expression of APEX1 had increased APEX1 activity and lower spontaneous and induced mutations in the lacI reporter gene relative to the control. Spermatogenic cells obtained from mice transgenic for human APEX1 displayed increased APEX1 activity, were protected from the age-dependent increase in spontaneous germline mutagenesis, and exhibited increased apoptosis in the spermatogonial cell population. These results directly indicate that increases in APEX1 level confer protection against the murine paternal age effect, thus highlighting the role of APEX1 in preserving reproductive health with increasing age and in protection against genotoxin-induced mutagenesis in somatic cells.
Keywords: APEX1; DNA repair; LacI; Mutagenesis; Paternal Age; Spermatogenesis.
Copyright © 2015 Elsevier B.V. All rights reserved.
Conflict of interest statement
The authors declare that there are no conflicts of interest.
Figures


Similar articles
-
Age-related instability in spermatogenic cell nuclear and mitochondrial DNA obtained from Apex1 heterozygous mice.Mol Reprod Dev. 2011 Dec;78(12):906-19. doi: 10.1002/mrd.21374. Epub 2011 Sep 14. Mol Reprod Dev. 2011. PMID: 21919107 Free PMC article.
-
Spontaneous mutagenesis is enhanced in Apex heterozygous mice.Mol Cell Biol. 2004 Sep;24(18):8145-53. doi: 10.1128/MCB.24.18.8145-8153.2004. Mol Cell Biol. 2004. PMID: 15340075 Free PMC article.
-
Base excision repair is limited by different proteins in male germ cell nuclear extracts prepared from young and old mice.Mol Cell Biol. 2002 Apr;22(7):2410-8. doi: 10.1128/MCB.22.7.2410-2418.2002. Mol Cell Biol. 2002. PMID: 11884623 Free PMC article.
-
From DNA Repair to Redox Signaling: The Multifaceted Role of APEX1 (Apurinic/Apyrimidinic Endonuclease 1) in Cardiovascular Health and Disease.Int J Mol Sci. 2025 Mar 26;26(7):3034. doi: 10.3390/ijms26073034. Int J Mol Sci. 2025. PMID: 40243693 Free PMC article. Review.
-
Age-Dependent De Novo Mutations During Spermatogenesis and Their Consequences.Adv Exp Med Biol. 2019;1166:29-46. doi: 10.1007/978-3-030-21664-1_2. Adv Exp Med Biol. 2019. PMID: 31301044 Review.
Cited by
-
Mitigating age-related somatic mutation burden.Trends Mol Med. 2023 Jul;29(7):530-540. doi: 10.1016/j.molmed.2023.04.002. Epub 2023 Apr 29. Trends Mol Med. 2023. PMID: 37121869 Free PMC article. Review.
-
Germline Stem Cell Competition, Mutation Hot Spots, Genetic Disorders, and Older Fathers.Annu Rev Genomics Hum Genet. 2016 Aug 31;17:219-43. doi: 10.1146/annurev-genom-083115-022656. Epub 2016 Apr 8. Annu Rev Genomics Hum Genet. 2016. PMID: 27070266 Free PMC article. Review.
References
-
- Kong A, Frigge ML, Masson G, Besenbacher S, Sulem P, Magnusson G, Gudjonsson SA, Sigurdsson A, Jonasdottir A, Wong WS, Sigurdsson G, Walters GB, Steinberg S, Helgason H, Thorleifsson G, Gudbjartsson DF, Helgason A, Magnusson OT, Thorsteinsdottir U, Stefansson K. Rate of de novo mutations and the importance of father’s age to disease risk. Nature. 2012;488:471–475. - PMC - PubMed
-
- Martin JA, Hamilton BE, Sutton PD, Ventura SJ, Mathews TJ, Osterman MJ. Births: final data for 2008, National vital statistics reports: from the Centers for Disease Control and Prevention, National Center for Health Statistics. National Vital Statistics System. 2010;59(1):3–71. - PubMed
-
- Sanders SJ, Murtha MT, Gupta AR, Murdoch JD, Raubeson MJ, Willsey AJ, Ercan-Sencicek AG, DiLullo NM, Parikshak NN, Stein JL, Walker MF, Ober GT, Teran NA, Song Y, El-Fishawy P, Murtha RC, Choi M, Overton JD, Bjornson RD, Carriero NJ, Meyer KA, Bilguvar K, Mane SM, Sestan N, Lifton RP, Gunel M, Roeder K, Geschwind DH, Devlin B, State MW. De novo mutations revealed by whole-exome sequencing are strongly associated with autism. Nature. 2012;485:237–241. - PMC - PubMed
-
- O’Roak BJ, Vives L, Girirajan S, Karakoc E, Krumm N, Coe BP, Levy R, Ko A, Lee C, Smith JD, Turner EH, Stanaway IB, Vernot B, Malig M, Baker C, Reilly B, Akey JM, Borenstein E, Rieder MJ, Nickerson DA, Bernier R, Shendure J, Eichler EE. Sporadic autism exomes reveal a highly interconnected protein network of de novo mutations. Nature. 2012;485:246–250. - PMC - PubMed
-
- Neale BM, Kou Y, Liu L, Ma’ayan A, Samocha KE, Sabo A, Lin CF, Stevens C, Wang LS, Makarov V, Polak P, Yoon S, Maguire J, Crawford EL, Campbell NG, Geller ET, Valladares O, Schafer C, Liu H, Zhao T, Cai G, Lihm J, Dannenfelser R, Jabado O, Peralta Z, Nagaswamy U, Muzny D, Reid JG, Newsham I, Wu Y, Lewis L, Han Y, Voight BF, Lim E, Rossin E, Kirby A, Flannick J, Fromer M, Shakir K, Fennell T, Garimella K, Banks E, Poplin R, Gabriel S, DePristo M, Wimbish JR, Boone BE, Levy SE, Betancur C, Sunyaev S, Boerwinkle E, Buxbaum JD, Cook Devlin EHB, Jr, Gibbs RA, Roeder K, Schellenberg GD, Sutcliffe JS, Daly MJ. Patterns and rates of exonic de novo mutations in autism spectrum disorders. Nature. 2012;485:242–245. - PMC - PubMed
Publication types
MeSH terms
Substances
Grants and funding
LinkOut - more resources
Full Text Sources
Other Literature Sources
Molecular Biology Databases
Research Materials
Miscellaneous
