Comparative Study
. 2015 Jul 23;16(1):150.
doi: 10.1186/s13059-015-0702-5.

Comparative assessment of methods for the computational inference of transcript isoform abundance from RNA-seq data

Affiliations
Comparative Study

Comparative assessment of methods for the computational inference of transcript isoform abundance from RNA-seq data

Alexander Kanitz et al. Genome Biol. .

Abstract

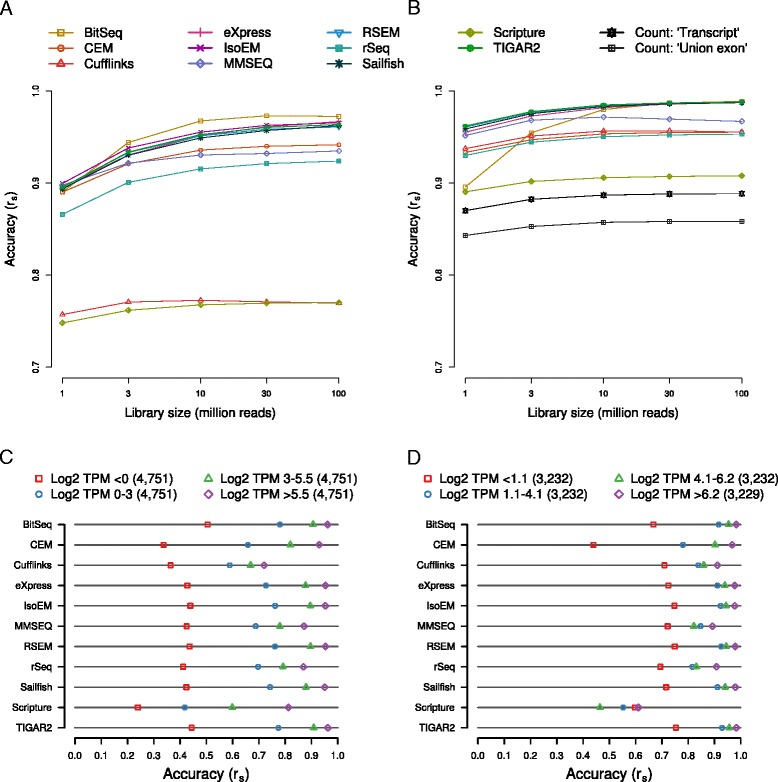
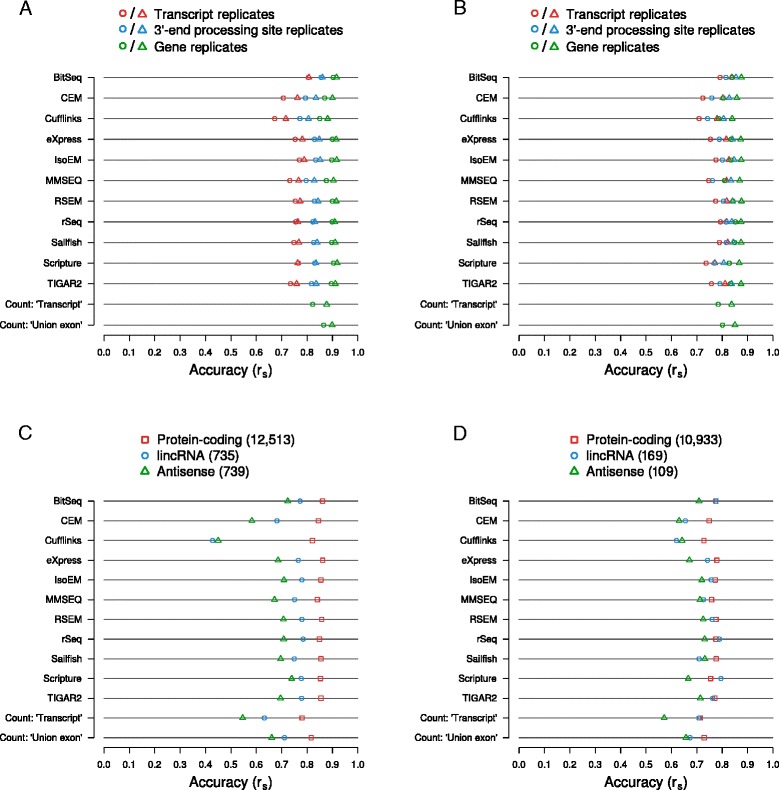
Background: Understanding the regulation of gene expression, including transcription start site usage, alternative splicing, and polyadenylation, requires accurate quantification of expression levels down to the level of individual transcript isoforms. To comparatively evaluate the accuracy of the many methods that have been proposed for estimating transcript isoform abundance from RNA sequencing data, we have used both synthetic data as well as an independent experimental method for quantifying the abundance of transcript ends at the genome-wide level.

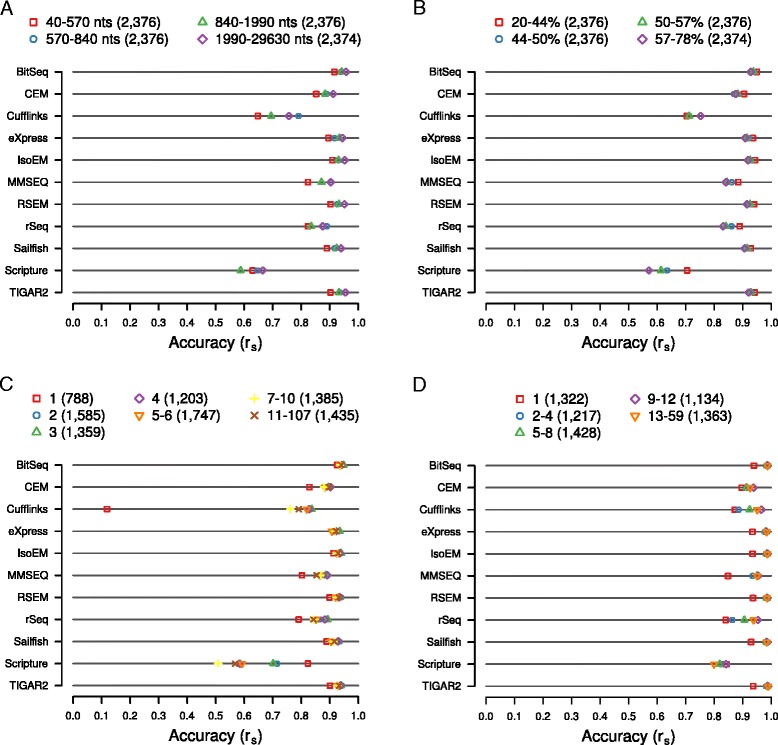
Results: We found that many tools have good accuracy and yield better estimates of gene-level expression compared to commonly used count-based approaches, but they vary widely in memory and runtime requirements. Nucleotide composition and intron/exon structure have comparatively little influence on the accuracy of expression estimates, which correlates most strongly with transcript/gene expression levels. To facilitate the reproduction and further extension of our study, we provide datasets, source code, and an online analysis tool on a companion website, where developers can upload expression estimates obtained with their own tool to compare them to those inferred by the methods assessed here.

Conclusions: As many methods for quantifying isoform abundance with comparable accuracy are available, a user's choice will likely be determined by factors such as the memory and runtime requirements, as well as the availability of methods for downstream analyses. Sequencing-based methods to quantify the abundance of specific transcript regions could complement validation schemes based on synthetic data and quantitative PCR in future or ongoing assessments of RNA-seq analysis methods.


Figures

Fig. 1
Fig. 1
Running time and memory requirements. Transcript isoform abundances were estimated with each of the indicated methods from in silico-generated datasets of different ‘sequencing’ depths. The running times (a and b) and memory footprints (c and d) are shown as a function of sequencing depth. Programs were run on either one (a and c) or 16 cores (b and d). Note that TIGAR2 is missing in (b) and (d), because the method does not support the use of multiple cores
Fig. 2
Fig. 2
Influence of sequencing depth and expression levels on the accuracy of expression estimates. Transcript isoform and gene expression levels were estimated with each of the indicated methods from in silico-generated datasets of different ‘sequencing’ depths. The accuracy of a method was assessed in terms of the Spearman correlation coefficient (rs) between the estimates and the known input levels (‘ground truth’) of expressed transcripts (a) and genes (b). Based on their true abundances, transcripts (c) and genes (d) were distributed across four bins of expression levels. Estimation accuracies as in (a) and (b) are indicated for each method and bin. The numbers of transcripts and genes in each bin are indicated together with the expression ranges that they cover. Estimates are based on a sequencing depth of 30 million reads
Fig. 3
Fig. 3
Impact of gene structural features on expression estimates. All transcripts or genes expressed at medium levels (0 < log2 TPM <5.5) were distributed across bins according to transcript length (a), GC content (b), the number exons per transcript (c), and the number of transcripts per gene (d). Ranges of the corresponding values covered by each bin are indicated in the legends above each chart. In all cases, expression levels were estimated with each of the indicated methods based on in silico-generated sequencing data (read depth = 30 million). The accuracy of estimates was measured in terms of how well they correlate with true expression levels, expressed as the Spearman correlation coefficient rs, and is indicated for each bin and method
Fig. 4
Fig. 4
Agreement between expression estimates for replicates of Jurkat cells. a Transcript isoform and gene expression levels were estimated with each of the indicated methods from two biological replicates of human Jurkat cell RNA-seq data. The agreement between expression estimates of the two replicates are indicated as Spearman correlation coefficients rs, both at the level of transcripts and genes. b A-seq-2-based 3′ end processing site expression level estimates for the two replicates are plotted against each other. The Spearman correlation coefficient rs is indicated. c As in (b), but gene level estimates are compared. d As in (a), but with the addition of 3′ end processing site abundances. For computing expression estimates for either feature type (transcript, 3′ end processing site, and gene), only those transcripts are considered that end in annotated 3′ end processing sites (see main text and Methods for details)
Fig. 5
Fig. 5
Agreement between the expression level estimated computationally from RNA-seq data and those measured with an independent experimental method. a and b Abundances of 3′ end processing sites in two independent samples (circles: replicate 1, triangles: replicate 2) of human Jurkat (a) or murine NIH/3T3 cells (b) were quantified with A-seq-2. Based on RNA-seq data obtained the same cell cultures, the abundances of transcripts ending at these processing sites were estimated with each of the indicated methods and aggregated per processing site. 3′ end processing site estimates were further aggregated per gene. The agreement between A-seq-2- and RNA-seq-based expression estimates was computed as Spearman correlation coefficients (rs) for 3′ end processing sites, genes, and transcripts (when processing sites were associated with exactly one transcript). Refer to the main text and the Methods section for further details. c and d Similar to (a) and (b), but only gene expression level estimates were considered and Spearman correlation coefficients were computed independently for different classes of gene biotypes, both for the human (c) and mouse (d) data. Plotted data represent means of the Spearman correlation coefficients calculated for each of two replicates

References

    1. Modrek B, Lee C. A genomic view of alternative splicing. Nat Genet. 2002;30:13–19. doi: 10.1038/ng0102-13. - DOI - PubMed
    1. Zavolan M, Kondo S, Schonbach C, Adachi J, Hume DA, Hayashizaki Y, et al. Impact of alternative initiation, splicing, and termination on the diversity of the mRNA transcripts encoded by the mouse transcriptome. Genome Res. 2003;13:1290–1300. doi: 10.1101/gr.1017303. - DOI - PMC - PubMed
    1. Nagasaki H, Arita M, Nishizawa T, Suwa M, Gotoh O. Species-specific variation of alternative splicing and transcriptional initiation in six eukaryotes. Gene. 2005;364:53–62. doi: 10.1016/j.gene.2005.07.027. - DOI - PubMed
    1. Chern T-M, van Nimwegen E, Kai C, Kawai J, Carninci P, Hayashizaki Y, et al. A simple physical model predicts small exon length variations. PLoS Genet. 2006;2 doi: 10.1371/journal.pgen.0020045. - DOI - PMC - PubMed
    1. Bradley RK, Merkin J, Lambert NJ, Burge CB. Alternative splicing of RNA triplets is often regulated and accelerates proteome evolution. PLoS Biol. 2012;10 doi: 10.1371/journal.pbio.1001229. - DOI - PMC - PubMed

Publication types

LinkOut - more resources