

doi: 10.1186/s13059-015-0706-1.
Single-cell RNA-seq transcriptome analysis of linear and circular RNAs in mouse preimplantation embryos
Affiliations
- PMID: 26201400
- PMCID: PMC4511241
- DOI: 10.1186/s13059-015-0706-1
Item in Clipboard
Single-cell RNA-seq transcriptome analysis of linear and circular RNAs in mouse preimplantation embryos
Genome Biol.
.
Abstract
Circular RNAs (circRNAs) are a new class of non-polyadenylated non-coding RNAs that may play important roles in many biological processes. Here we develop a single-cell universal poly(A)-independent RNA sequencing (SUPeR-seq) method to sequence both polyadenylated and non-polyadenylated RNAs from individual cells. This method exhibits robust sensitivity, precision and accuracy. We discover 2891 circRNAs and 913 novel linear transcripts in mouse preimplantation embryos and further analyze the abundance of circRNAs along development, the function of enriched genes, and sequence features of circRNAs. Our work is key to deciphering regulation mechanisms of circRNAs during mammalian early embryonic development.
Figures
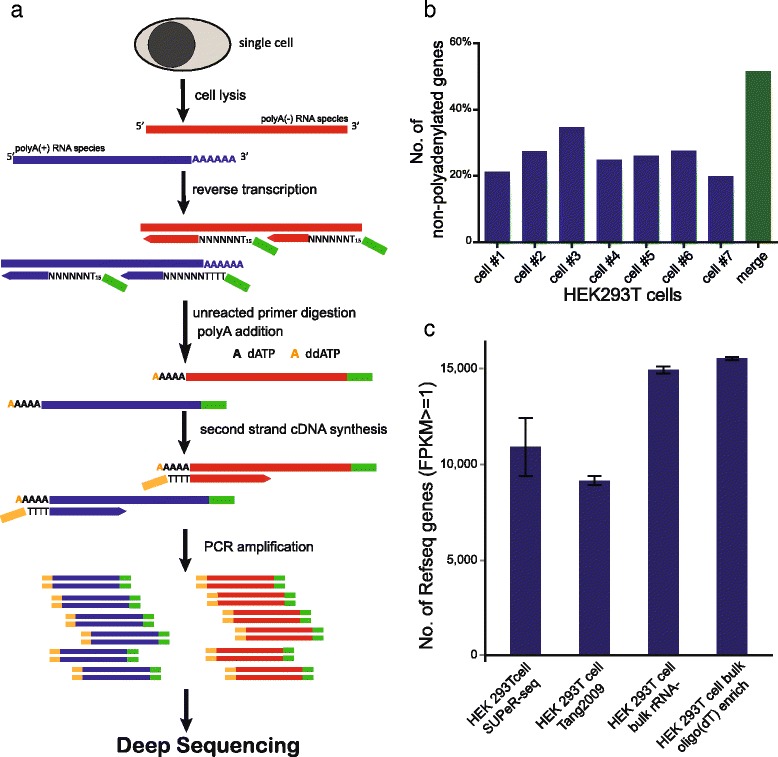
Experimental pipeline of SUPeR-seq, and its sensitivity at the whole-transcriptome scale. a The schematic of SUPeR-seq analysis. A single cell is lysed to release RNAs. RNAs are then reverse transcribed into first-strand cDNAs using random primers with a fixed anchor sequence (AnchorX-T15N6). Unreacted primers are then digested using ExoSAP-IT, followed by adding poly(A) tails to the 3′ ends of the first-strand cDNAs using dATP doped with 1 % ddATP to restrict the length of poly(A) tails. Second-strand cDNAs are synthesized using poly(T) primers with a different anchor sequence (AnchorY-T24). Then the double-stranded cDNAs are evenly amplified by PCR using AnchorX-T15 and AnchorY-T24 primers. Finally the purified single cell cDNAs are used to prepare sequencing libraries following Illumina’s TruSeq DNA sample preparation protocols. b Detection sensitivity of SUPeR-seq on poly(A)- genes in individual cells. We identified 696 poly(A)- genes by bulk RNA sequencing, of which around 30 % could be recovered in a single cell by SUPeR-seq (for details, see Additional file 3). When merged the SUPeR-seq data of the seven single cell samples together, over 50 % of these 696 genes could be successfully recovered by SUPeR-seq in at least one cell. c The number of genes detected from individual and bulk HEK293T cells using different protocols. SUPeR-seq detected 10,911 genes on average from an individual cell with FPKM ≥1(Fragments Per Kilobase of exon model per Million mapped reads), 19.3 % more than the Tang2009 protocol did (9148 genes on average). For comparison, 14,931 genes were detected with FPKM ≥1 in the four rRNA-depleted total RNA samples from bulk HEK293T cells, and 15,535 genes were detected in the four oligo(dT)-enriched total RNA samples from bulk HEK293T cells
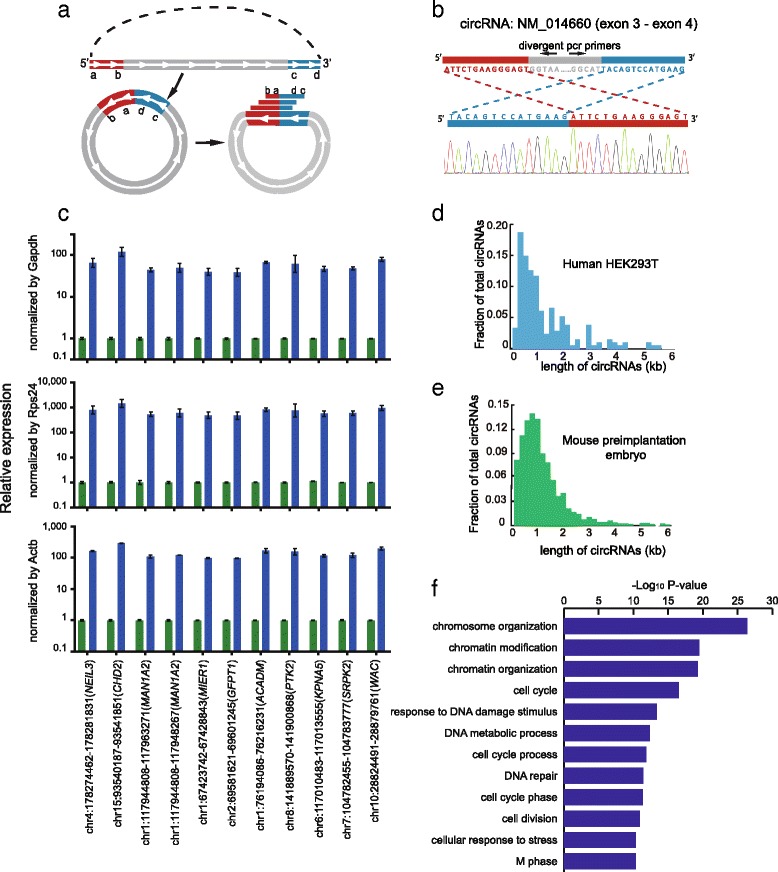
Detection of circRNAs by SUPeR-seq in individual HEK293T cells and mouse preimplantation embryos. a Identification of circRNAs in the SUPeR-seq dataset. The termini of two exons are in a sequential order (a–-b……c–-d) along the genome, the red part shows the upstream exon at the 5′ end of the gene while the blue part shows the downstream exon at the 3′ end of the gene (top). When looped, the two exons join together from head to tail in a reversed order (c–d–a–b, bottom). Various sequencing reads covering the junction site can identify the cyclization of a circRNA. b Sanger sequencing validation of a newly discovered circRNA through SUPeR-seq in a single HEK293T cell. The end-joining region of the circRNA is PCR amplified to confirm the reversed order of the joined exons. The sequence of the end-joining region is unique to the circRNA but not the host linear RNA. The joint region of the circRNA is chr7:11021999–11030474, and the host gene is PHF14. c Quantitative RT-PCR of HEK293T cell total RNA treated with RNase R or mock treatment as a control. The circRNA candidates showed ten- to hundred-fold enrichment compared with common linear mRNAs after treatment with RNase R (here we use Gapdh, Rps24 and Actb as linear RNA controls). This clearly demonstrates that all the circRNA candidates are circular. For each circRNA, we made two replicates in the RT-qPCR step. d The length distribution of the circRNAs (141 in total) detected in single HEK293T cells. e The length distribution of circRNAs (2891 in total) detected in mouse preimplantation embryos. f The top GO terms are displayed for 1316 genes from which circRNAs are generated in mouse preimplantation embryos
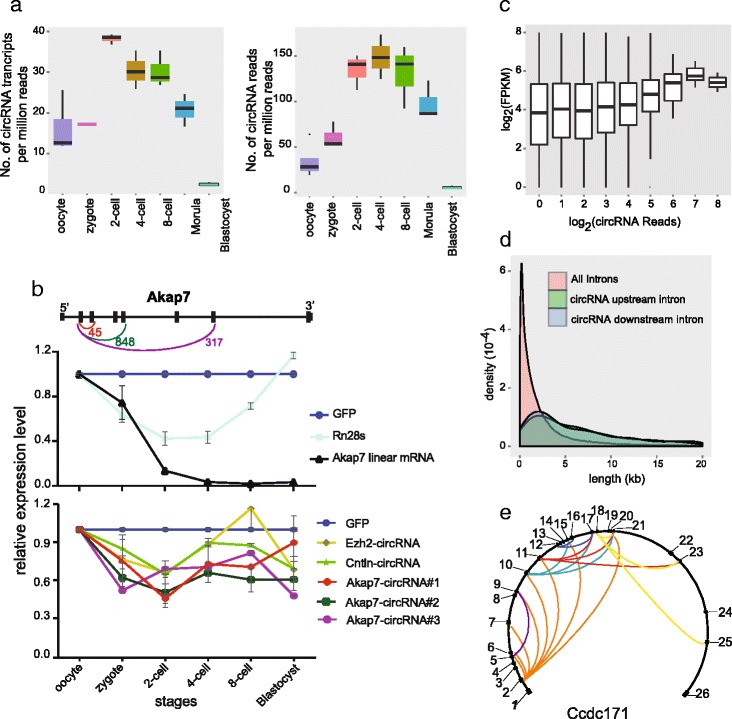
Characterization of the circRNAs expressed in the mouse preimplantation embryos. a The number of circRNA transcripts and the number of reads mapping to circRNAs (only counting the reads spanning the end-joining site of circRNAs) per million mapped paired-end reads at each stage of mouse preimplantation embryos. Five biological replicates were used for the oocyte samples, and three biological replicates for each of the other six stages. The concentration of circRNAs is elevated between the two-cell and eight-cell stages and decreased drastically at the morula and blastocyst stages. b The expression dynamics of five circRNAs analyzed by RT-qPCR. Top: circRNAs generated from the same gene share the 5′ exon to form the head-to-tail junction sites. The arcs show the joint between two exons. The numbers indicate the junction reads for corresponding circRNAs in the SUPeR-seq dataset. CircRNAs with longer downstream introns show higher expression levels as measured by the circRNA-specific end-joining reads. Middle: RT-qPCR of the linear transcripts from the mouse oocyte to blastocyst stage. Bottom: the abundance of circRNAs analyzed by RT-qPCR from the mouse oocyte to blastocyst stage. GFP RNAs were spiked-in during purification of total RNAs as a control for the technical variation in each sample. Ezh2-circRNA stands for chr6:47540677–47577667 (exons 2–15 of Ezh2), Cntln-circRNA stands for chr4:84971131–85006524 (exons 6–12 of Cntln), Akap7-circRNA#1 stands for chr10:25283892–25289730 (exons 2–3 of Akap7), Akap7-circRNA#2 stands for chr10:25267307–25289730 (exons 2–5 of Akap7), Akap7-circRNA#3 stands for chr10:25220610–25289730 (exons 2–7 of Akap7). The circRNAs are more stable compared with linear ones during the maternal to zygotic transition. c The relationship of circRNA read counts with the host gene FPKM. Genes detected with higher circRNA counts also show higher expression levels of linear transcripts. d Length distributions of flanking introns of the 2891 circRNAs found in mouse preimplantation embryos. The upstream intron is originally adjacent to the first exon of a circRNA before cyclization and the downstream intron is adjacent to the last exon. Both these specific upstream and downstream introns tend to be much longer than other introns in the same gene. e An example (Ccdc171) showing that one host linear RNA gene could generate multiple circRNA species with different joints. All the exons are indicated and numbered along the gene. The arcs between different exons within the circle show end-joining events of the circRNAs
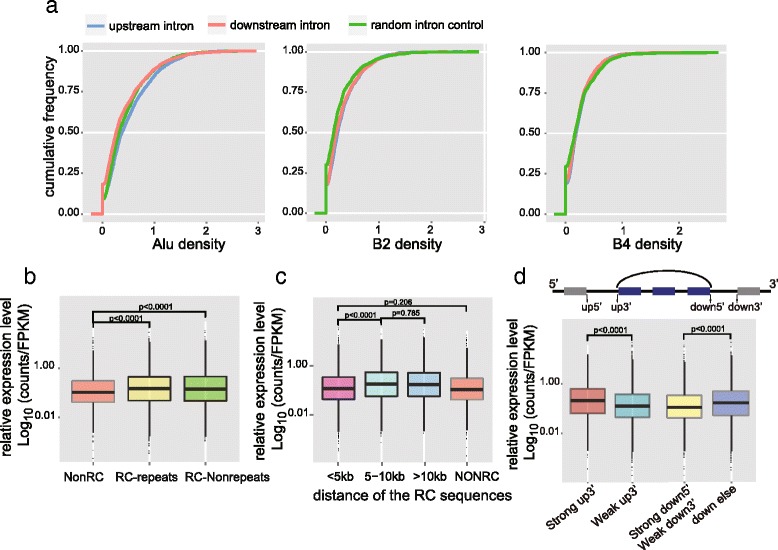
Analysis of reverse complementary sequences and repeat elements for circRNA formation. a Three kinds of repeat element density in the introns adjacent to end-joining exons of circRNAs. b CircRNAs are divided into three groups according to whether the upstream and downstream introns contain reverse complementary (RC) sequences and whether these sequences belong to repeat elements (RC-repeats and RC-Nonrepeats). The circRNA expression levels are normalized by the host gene FPKM. CircRNAs with adjacent introns containing RC sequences shows higher expression than those without RC sequences (NonRC). Moreover, the circRNA expression shows positive correlation with the number of RC sequence pairs (Fig. S8c in Additional file 1). c We calculated the distance between the nearest pair of RC sequences by summing up their distances to the circRNA splicing sites. When the distance is less than 5 kb, the RC sequences seem not to help circRNA formation. d CircRNAs are classed by the strength of the upstream splicing site (up5′ and up3′) of the first exon forming the end-joining site and those with strong up3′ (top) show higher expression than those with weak up3′, while no differences caused by the strength of up5′ were observed. Then when classing the circRNAs by strength of downstream splicing motif (down5′ and down 3′), only circRNAs with strong down5′ and weak down3′ show higher expression than all the other groups
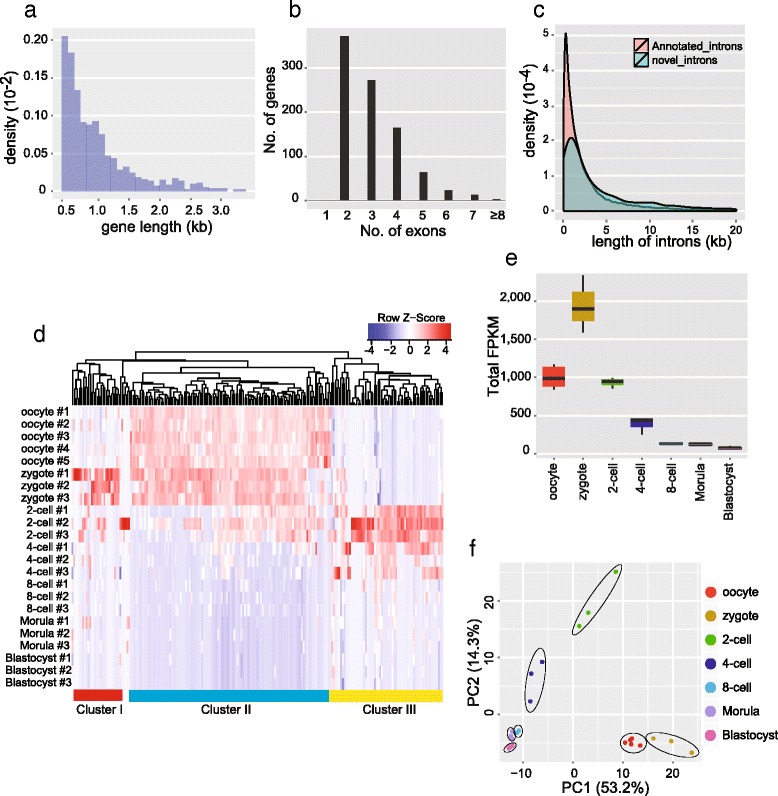
De novo assembled novel transcripts in mouse preimplantation embryos. a Length distribution for de novo assembled novel transcripts. Candidate novel transcripts with lengths less than 500 bp were filtered out. b Exon number distribution for de novo assembled novel transcripts. Candidate novel transcripts with lengths less than 500 bp were filtered out. c Intron length distribution for novel candidate transcripts. The introns of novel candidate genes were slightly longer than annotated introns, on average. d Hierarchical clustering analysis of novel transcripts, which shows stage-specific expression of genes in mouse preimplantation embryo samples. These genes can be divided into three major clusters: cluster I are early zygotic genes which are expressed during the zygote stage and then are down-regulated at later stages; cluster II are maternal genes, which account for over 60 % of novel genes; cluster III are late zygotic genes which start to be expressed from the two-cell stage. e The total FPKM of all 913 novel genes in each embryonic stage, showing enrichment in the embryo stages before the eight-cell stage, especially in zygotes. f Principal component (PC) analysis of mouse preimplantation embryos based on the 913 novel transcripts
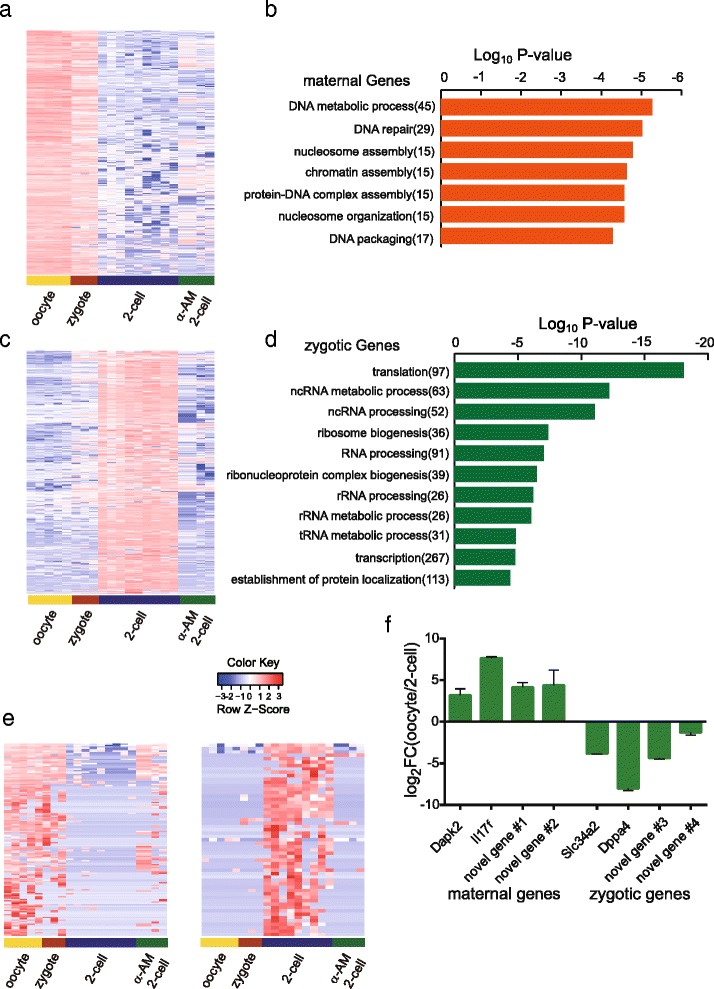
Maternally and zygotically expressed genes in mouse preimplantation embryos. a Heatmap of maternally expressed genes. b The top enriched GO terms overrepresented in 1238 maternally expressed genes. c Heatmap of zygotically expressed genes. The zygotic genes are down-regulated after blocking of transcription with α-Amanitine treatment of the embryos. d The top enriched GO terms overrepresented in 4143 zygotically expressed genes. e Expression levels of 139 novel maternal genes and 57 novel zygotic genes in mouse oocytes, normal two-cell embryos and α-Amanitine treated two-cell embryos were analyzed. e (lLeft: the maternal genes show high expression levels in oocyte samples and are largely down-regulated in normal two-cell embryos. Some maternal genes are also still highly expressed in α-Amanitine treated two-cell embryos. (rRight: the zygotic genes are highly expressed in normal two-cell embryos. Out of the 57 novel zygotic genes, 54 could be validated, which means they are not transcribed in two-cell embryos treated with 100 ng/ml α-Amanitine. f RT-qPCR validation of both annotated and novel maternal and zygotic candidate genes. Maternal genes have ΔΔCt(two-cell-oocyte) > 1 and zygotic genes have ΔΔCt(two-cell-oocyte) < −1. Novel gene #1 to novel gene #4 refer to comp20337_c0, comp46577_c0, comp46858_c0 and comp89562_c0, respectively (also see Additional file 6)
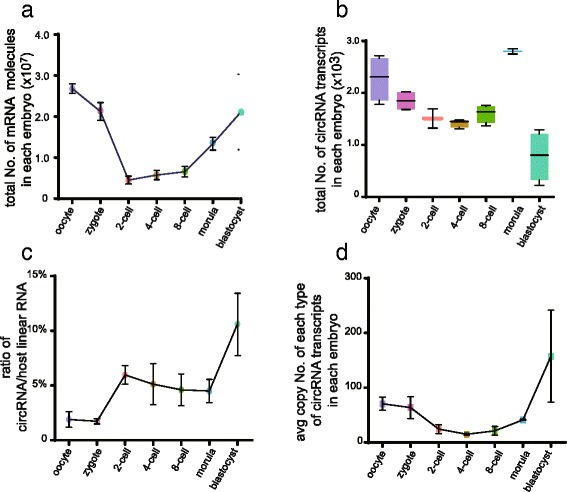
Absolute copy numbers of mRNA molecules in single embryos evaluated by ERCC spike-ins. Absolute copy numbers of mRNAs (a) and circRNAs (b) in individual embryos at each developmental stage deduced by ERCC spike-ins. c The average copy number ratio of circRNAs to their host genes. d The average molecule number for each circRNA transcript in every individual embryo for each developmental stage deduced by ERCC spike-ins
References
Publication types
MeSH terms
Substances
Associated data
- Actions
LinkOut - more resources
Full Text Sources
Other Literature Sources
Molecular Biology Databases
