

Triggered Ca2+ influx is required for extended synaptotagmin 1-induced ER-plasma membrane tethering
- PMID: 26202220
- PMCID: PMC4585464
- DOI: 10.15252/embj.201591565
Triggered Ca2+ influx is required for extended synaptotagmin 1-induced ER-plasma membrane tethering
Abstract
The extended synaptotagmins (E-Syts) are ER proteins that act as Ca(2+)-regulated tethers between the ER and the plasma membrane (PM) and have a putative role in lipid transport between the two membranes. Ca(2+) regulation of their tethering function, as well as the interplay of their different domains in such function, remains poorly understood. By exposing semi-intact cells to buffers of variable Ca(2+) concentrations, we found that binding of E-Syt1 to the PI(4,5)P2-rich PM critically requires its C2C and C2E domains and that the EC50 of such binding is in the low micromolar Ca(2+) range. Accordingly, E-Syt1 accumulation at ER-PM contact sites occurred only upon experimental manipulations known to achieve these levels of Ca(2+) via its influx from the extracellular medium, such as store-operated Ca(2+) entry in fibroblasts and membrane depolarization in β-cells. We also show that in spite of their very different physiological functions, membrane tethering by E-Syt1 (ER to PM) and by synaptotagmin (secretory vesicles to PM) undergo a similar regulation by plasma membrane lipids and cytosolic Ca(2+).
Keywords: Orai1; PLC; STIM1; membrane contact sites; tricalbin.
© 2015 The Authors.
Figures
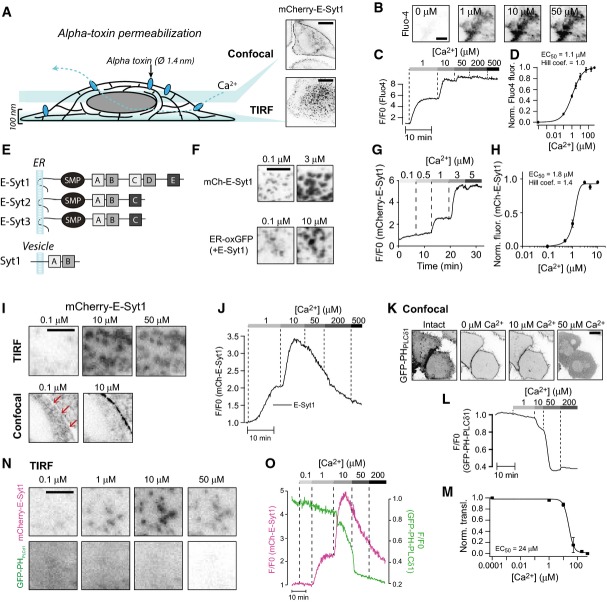
Schematic representation of the in situ binding assay based on fluorescence microscopy of α-toxin-permeabilized HeLa-M cells expressing fluorescent fusion proteins. Insets shows ER-PM contact sites as seen by confocal microscopy (top) or TIRF microscopy (bottom). In this and all other black and white micrographs, fluorescence is show in black. Scale bar, 10 μm.
TIRF microscopy images of a HeLa cell loaded with the Ca2+ indicator Fluo-4 following α-toxin permeabilization and exposure to buffers with the indicated Ca2+ concentrations.
Fluo-4 fluorescence intensity changes following permeabilization and the addition of Ca2+ buffers as in (B). Scale bar, 10 μm.
Dose–response curve for Ca2+-induced Fluo-4 fluorescence change (means ± SEM for 59 cells from 9 separate experiments).
Drawings of the E-Syts and synaptotagmin 1 (Syt1). C2 domains with greater structural similarity to each other are indicated by the same shade of gray.
TIRF microscopy images showing expansion of ER-PM contacts labeled by mCherry-E-Syt1 (top) or the luminal ER marker ER-oxGFP (bottom) in response to Ca2+. Scale bar, 2 μm.
TIRF microscopy recording of mCherry-E-Syt1 fluorescence from a cell following permeabilization and exposure to buffers with the indicated Ca2+ concentrations.
Dose–response curve for Ca2+-induced mCherry-E-Syt1 plasma membrane binding (means ± SEM for 38 cells from 6 separate experiments).
TIRF (top) and confocal (bottom) microscopy images of HeLa cells expressing mCherry-E-Syt1 following permeabilization and exposure to Ca2+. Scale bar, 2 μm. Red arrows points to the plasma membrane region.
TIRF microscopy recording of mCherry-E-Syt1 fluorescence from a cell following permeabilization and exposure to buffers with the indicated Ca2+ concentrations.
Confocal microscopy images of HeLa cells showing the distribution of the PI(4,5)P2 biosensor GFP-PH-PLCδ1 before and after permeabilization and exposure to buffers with the indicated Ca2+ concentrations. Scale bar, 10 μm.
PM GFP-PH-PLCδ1 fluorescence changes following permeabilization and the addition of buffers with the indicated Ca2+ concentrations.
Dose–response curve for Ca2+-induced GFP-PH-PLCδ1 PM fluorescence change (means ± SEM for 12 cells from 3 separate experiments).
TIRF micrographs from a permeabilized cell expressing mCherry-E-Syt1 and GFP-PH-PLCδ1. Scale bar, 2 μm.
PM fluorescence change for the cell in (N).
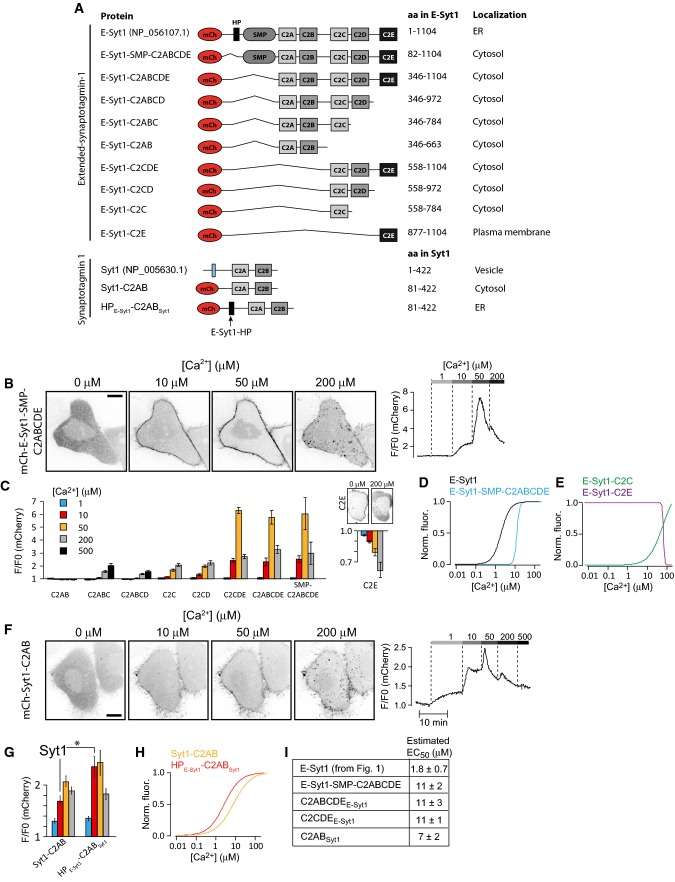
Schematic representation of E-Syt1 and Syt1 domain structures and of fusion proteins used in the study.
Confocal microscopy images (left) and changes in plasma membrane fluorescence (right) following α-toxin permeabilization and exposure to increasing Ca2+ concentrations for mCherry-E-Syt1-SMP-C2ABCDE.
Quantification of the relative fluorescence change at the plasma membrane for the indicated E-Syt1 fusion proteins after exposure to 1, 10, 50, 200, and 500 μM Ca2+ (means ± SEM for 24 (C2AB), 31 (C2ABC), 27 (C2ABCD), 38 (C2C), 33 (C2CD), 21 (C2E), 44 (C2CDE), 45 (C2ABCDE), and 48 (SMP-C2ABCDE) cells from > 3 separate experiments). The Ca2+-induced dissociation of mCherry-E-Syt1-C2E from the PM is shown to the right on a separate y-axis, with example confocal micrographs to illustrate the distribution at low and high Ca2+ concentration shown above.
Normalized dose–response curves for Ca2+-induced mCh-E-Syt1 and mCh-E-Syt1-SMP-C2ABCDE PM binding.
Normalized dose–response curves for mCh-E-Syt1-C2C and mCh-E-Syt1-C2E PM binding at different Ca2+ concentrations.
Confocal microscopy images (left) and changes in plasma membrane fluorescence (right) following α-toxin permeabilization and exposure to increasing Ca2+ concentrations for mCherry-Syt1-C2AB.
Quantification of the fluorescence change at the plasma membrane for the indicated Syt1 fusion proteins after exposure to 1, 10, 50, and 200 μM Ca2+ (means ± SEM for 31 and 11 cells from 6 and 2 separate experiments, *P < 0.05).
Dose–response curves for Ca2+-induced PM binding of mCh-Syt1-C2AB and mCh-HPE-Syt1-C2ABSyt1.
Estimated EC50 values for Ca2+-induced plasma membrane binding (means ± SEM). As discussed in the text, these values are approximate. They represent an underestimation for those fusion proteins whose PM binding is biphasic at high Ca2+ concentrations (see FigEV1 for representative curves from which these values were derived).
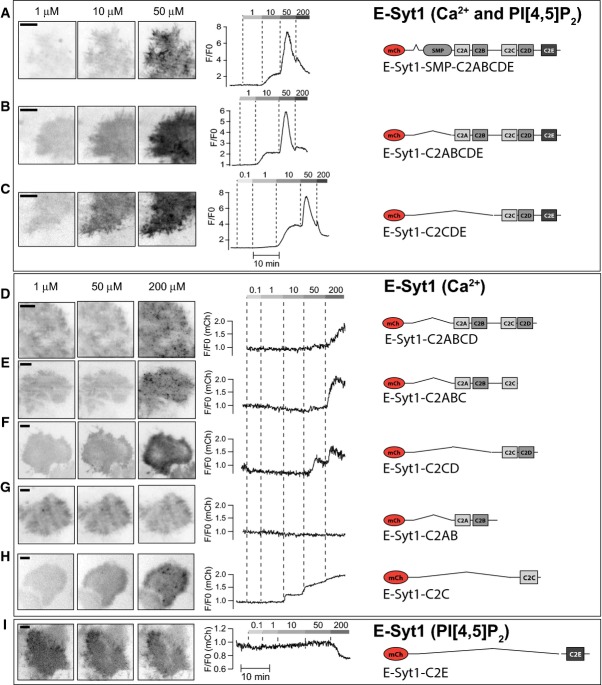
A–C TIRF micrographs (left) and single-cell TIRF recordings of mCherry fluorescence for the indicated E-Syt1 domain deletion protein binding the plasma membrane PI(4,5)P2 in a Ca2+-dependent manner.
D–H TIRF micrographs (left) and single-cell TIRF recordings of mCherry fluorescence for the indicated E-Syt1 domain deletion protein binding the plasma membrane in a PI(4,5)P2-independent and Ca2+-dependent manner.
I TIRF micrographs (left) and single-cell TIRF recording of mCherry fluorescence for the indicated E-Syt1 domain deletion protein binding the plasma membrane in a PI(4,5)P2-dependent and Ca2+-independent manner.
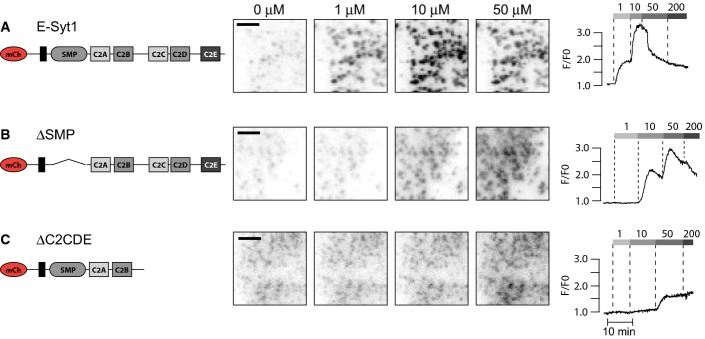
A–C TIRF micrographs (left) and single-cell TIRF recordings of mCherry fluorescence (right) for the indicated, ER-localized E-Syt1 domain deletion proteins. All scale bars, 2 μm.
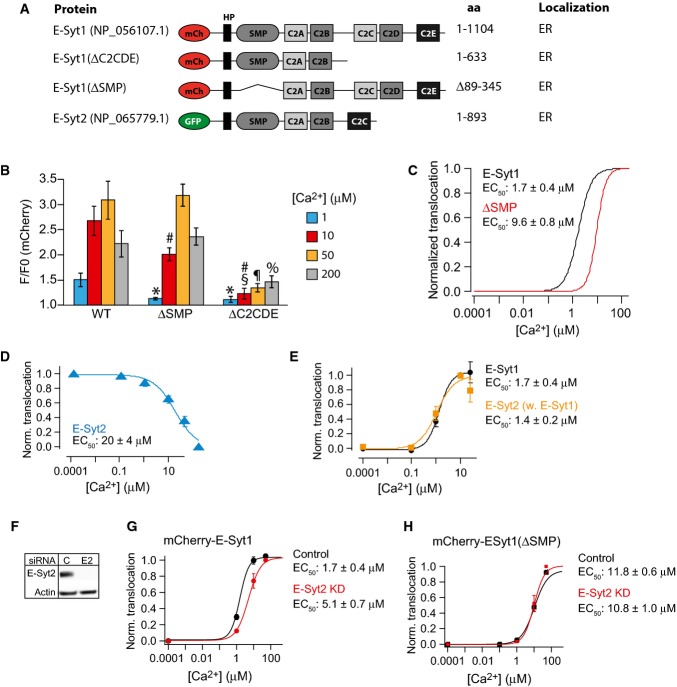
A Schematic representation of fusion proteins used in the study.
B Quantification of the fluorescence change at the plasma membrane for the indicated fusion proteins after exposure to 1, 10, 50, and 200 μM Ca2+ presented as means ± SEM for 51 (E-Syt1), 34 (E-Syt1(ΔSMP)), and 36 (E-Syt1(ΔC2CDE)) cells from > 3 separate experiments. *P < 0.01 compared to WT. #P < 0.01 (ΔSMP) or P < 0.01 (ΔC2CDE) compared to WT. §P < 0.01 compared to ΔSMP. ¶P < 0.01 compared to ΔSMP. %P < 0.01 compared to ΔSMP.
C Dose–response curves for Ca2+-induced PM binding of mCh-E-Syt1 and mCh-E-Syt1(ΔSMP).
D Dose–response curve for Ca2+-induced PM dissociation of GFP-E-Syt2 (means ± SEM for 12 cells from 3 separate experiments).
E Dose–response curves for Ca2+-induced plasma membrane binding of GFP-E-Syt2 (yellow) and mCherry-E-Syt1 (black) in cells co-expressing the two constructs (means ± SEM for 13 cells from 3 separate experiments).
F Immunoblot showing E-Syt2 expression levels in control (C) and E-Syt2 (E2) siRNA-treated HeLa cells.
G, H Dose–response curves for Ca2+-induced PM binding of mCherry-E-Syt1 (G) or mCherry-E-Syt1(ΔSMP) (H) in control and E-Syt2 KD cells (means ± SEM for 15 cells from 3 separate experiments).
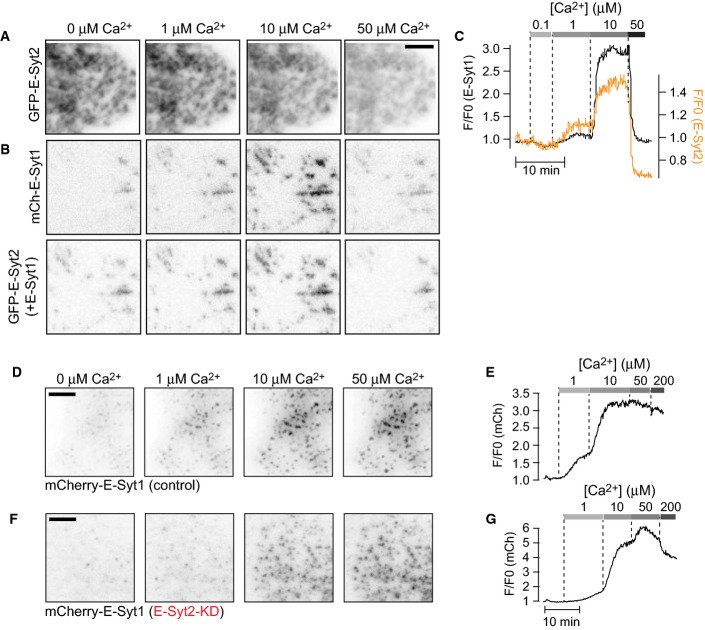
A, B TIRF micrographs of GFP-E-Syt2 (A) or GFP-E-Syt2 and mCherry-E-Syt1 (B) fluorescence from a permeabilized cell exposed to buffers with the indicated Ca2+ concentrations.
C Single-cell TIRF recording of mCherry-E-Syt1 (black) and GFP-E-Syt2 (yellow) fluorescence following exposure to buffers with the indicated Ca2+ concentrations.
D, E TIRF micrographs (D) and single-cell TIRF recording (E) of mCherry-E-Syt1 fluorescence in control cells after permeabilization and exposure to buffers with the indicated Ca2+ concentrations.
F, G TIRF micrographs (F) and single-cell TIRF recording (G) of mCherry-E-Syt1 fluorescence in E-Syt2 knockdown cells after permeabilization and exposure to buffers with the indicated Ca2+ concentrations.
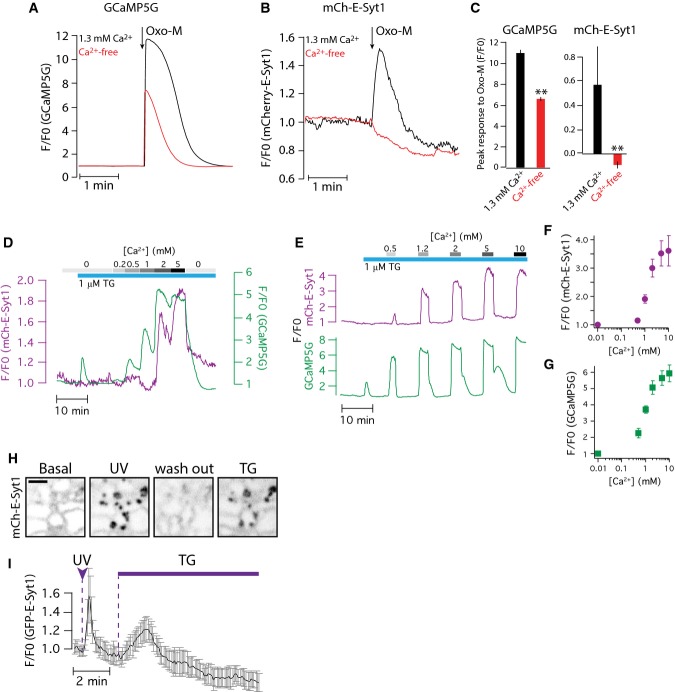
A, B TIRF microscopy recordings of GCaMP5G (A) and mCherry-E-Syt1 (B) fluorescence following stimulation with 10 μM oxo-M, in the absence (red) or presence (black) of extracellular Ca2+. The HeLa cells also overexpressed an M1 muscarinic receptor.
C Quantification of the peak Ca2+ increase (left) and E-Syt1 PM binding (right) from the experiments in (A) and (B). Data show means ± SEM for 19 cells from 3 separate experiments (**P < 0.01 for difference from 1.3 mM Ca2+).
D, E TIRF microscopy recordings of GCaMP5G (green) and mCherry-E-Syt1 (purple) fluorescence following exposure to 1 μM thapsigargin in the absence of extracellular Ca2+, followed by the addition of Ca2+ at different concentrations (0.2–10 mM).
F, G Quantification of the peak fluorescence increase in mCherry-E-Syt1 (F) and GCaMP5G (G) measured by TIRF microscopy in response to the application of the indicated Ca2+ concentration in the presence of 1 μM thapsigargin. Data show means ± SEM for 19 cells from 4 experiments.
H Confocal micrographs of mCherry-E-Syt1 fluorescence from a HeLa cell maintained in a Ca2+-containing buffer and exposed to flash photolysis of caged Ca2+ and subsequent addition of 1 μM thapsigargin (TG). Scale bar, 1 μm.
I Means ± SEM (n = 4 cells from 2 experiments) of mCherry-E-Syt1 fluorescence change at ER-PM contacts following flash photolysis of Ca2+ and subsequent addition of 1 μM thapsigargin (TG).
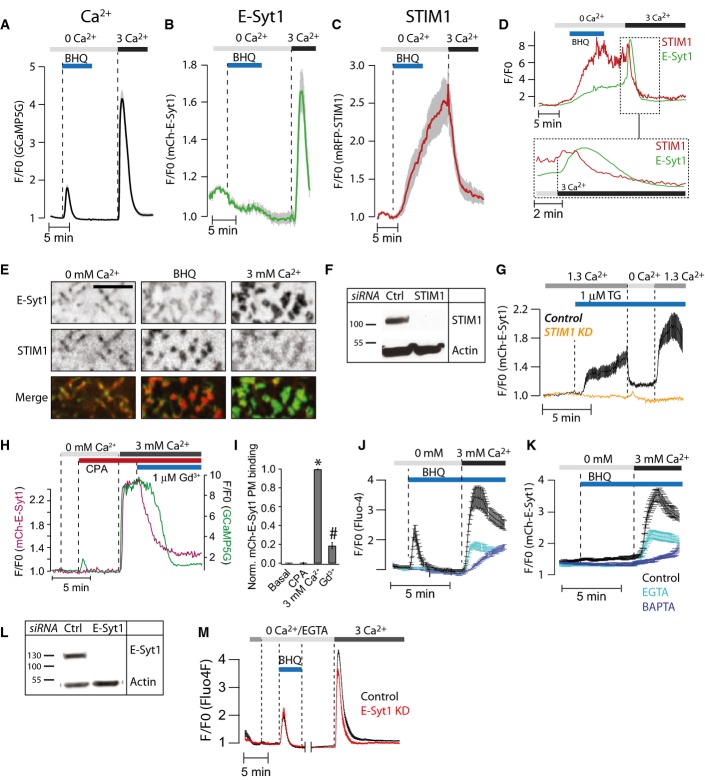
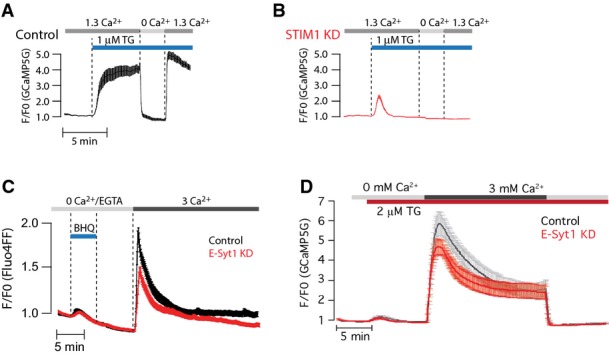
A–C TIRF microscopy recordings of GCaMP5G (A), mCherry-E-Syt1 (B), and mRFP-STIM1 (C) fluorescence change in HeLa cells in response to release of Ca2+ from the ER induced by 50 μM BHQ and subsequent activation of SOCE by the addition of 3 mM Ca2+. Data are presented as means ± SEM for 55 (GCaMP5G), 39 (E-Syt1), and 39 (STIM1) cells from 4 separate experiments.
D Simultaneous TIRF microscopy recordings of GFP-E-Syt1 and mRFP-STIM1 fluorescence from a HeLa cell during release of Ca2+ from the ER (BHQ) and activation of SOCE (3 Ca2+). The indicated region is shown below on an expanded time scale.
E TIRF microscopy images of the HeLa cell in (D). Scale bar is 2 μm.
F Immunoblot for STIM1 in control (Ctrl) and STIM1 siRNA-treated HeLa cells.
G TIRF microscopy recordings of mCherry-E-Syt1 fluorescence in response to 1 μM thapsigargin (TG) in control (black) and STIM1 siRNA-treated (yellow) HeLa cells (means ± SEM for 31 and 28 cells in 3 separate experiments).
H TIRF microscopy recording from a single HeLa cell expressing mCherry-E-Syt1 and the Ca2+ reporter GCaMP5G and exposed in sequence to the SERCA inhibitor CPA to activate SOCE and then to 1 μM Gd3+ to stop SOCE without disrupting STIM1-Orai1 contacts.
I Quantification of mCh-E-Syt1 PM binding in response to SOCE and the addition of Gd3+. Means ± SEM for 24 cells in 3 separate experiments. *P < 0.001 (vs Basal); #P < 0.01 (vs 3 mM Ca2+).
J, K TIRF microscopy recordings of GCaMP5G (J) and mCherry-E-Syt1 (K) fluorescence from HeLa cells treated with 0.1% DMSO (v/v) (control, black), 1 μM EGTA-AM (light blue), or 1 μM BAPTA-AM (dark blue) followed by activation of SOCE (means ± SEM for 43 (control), 52 (EGTA), and 51 (BAPTA) cells in 3 separate experiments).
L Immunoblot for E-Syt1 in control (Ctrl) and E-Syt1 siRNA-treated HeLa cells.
M Ca2+ recordings from control (black) or E-Syt1 siRNA-treated (red) HeLa cells loaded with Fluo-4 in response to release of Ca2+ from the ER (BHQ) and activation of SOCE (3 Ca2+) (means ± SEM for 425 (control) and 325 (E-Syt1 KD) cells in 7 separate experiments).
A, B TIRF microscopy recordings of GCaMP5G fluorescence in response to 1 μM thapsigargin (TG) in control (A, black) and STIM1 siRNA-treated (B, red) HeLa cells (means ± SEM for 31 (control) and 28 (STIM1 KD) cells in 3 separate experiments).
C Ca2+ imaging of control or E-Syt1 KD HeLa cells loaded with the low-affinity Ca2+ indicator Fluo-4FF during release of Ca2+ from the ER and activation of SOCE. Curves are presented as means ± SEM for 38 (control, red) and 33 (E-Syt1 KD, black) cells from 4 separate experiments.
D Fluorescence microscopy recordings of GCaMP5G fluorescence in control or E-Syt1 knockdown HeLa cells exposed to 1 μM thapsigargin (TG) in Ca2+-free buffer, followed by the re-addition of 3 mM Ca2+. Data are presented as means ± SEM for 21 (control) and 23 (E-Syt1-KD) cells from 3 experiments.
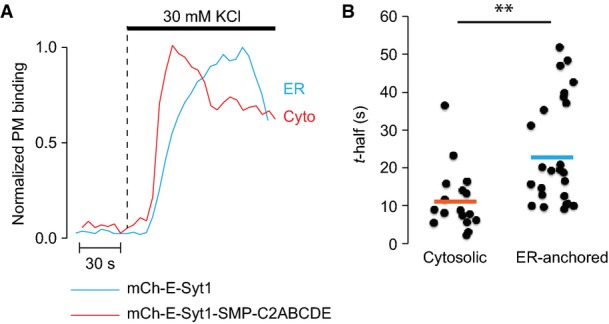
Representative TIRF microscopy recordings from two MIN6 cells expressing mCherry-E-Syt1 (blue) or mCherry-E-Syt1-SMP-C2ABCDE (red) following depolarization with 30 mM K+.
Scatter plot showing time to half-maximal PM binding for cells stimulated as in (A). N = 17 cells (mCherry-E-Syt1) and N = 24 cells (mCherry-E-Syt1-SMP-C2ABCDE) from 2 separate experiments (**P < 0.01).
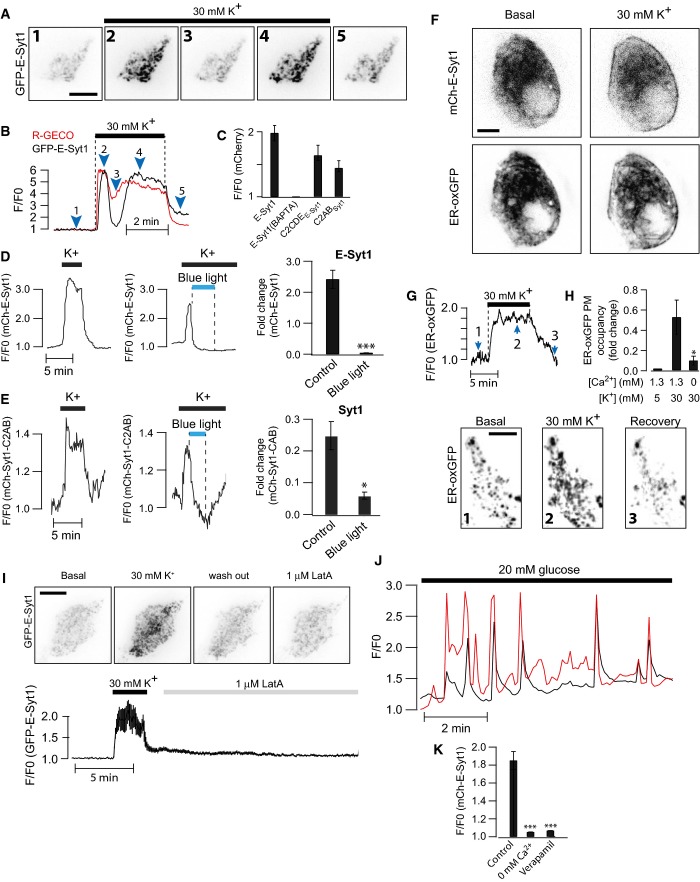
A TIRF microscopy images of a MIN6 β-cell expressing GFP-E-Syt1 (shown) and R-GECO before and during depolarization by 30 mM K+. Scale bar, 10 μm.
B TIRF microscopy recordings of the Ca2+-indicator R-GECO (red) and GFP-E-Syt1 (black) fluorescence change during depolarization of a MIN6 β-cell with 30 mM K+. Numbers correspond to images in (A).
C Means ± SEM for the peak response to 30 mM K+ for the indicated mCherry fusion proteins (n = 16 (E-Syt1), 12 (BAPTA), 16 (C2CDE), and 17 (Syt1-C2AB) cells in 2 separate experiments).
D, E TIRF microscopy recording of mCherry-E-Syt1 (D) or mCherry-Syt1-C2AB (E) fluorescence change during K+ depolarization before and after blue light-induced PI(4,5)P2 dephosphorylation. Bar graphs show means ± SEM for the peak response to 30 mM K+ in the presence or absence of PI(4,5)P2 (n = 16 and 18 cells in 3 separate experiments). *P < 0.05, ***P < 0.001.
F Confocal micrographs of a MIN6 β-cell expressing mCherry-E-Syt1 and ER-oxGFP (a luminal ER marker) 30 s before (left panel) and 30 s after (right panel) depolarization by 30 mM K+. Note the partial redistribution of E-Syt1 and ER-oxGFP to the cell periphery after depolarization. Scale bar, 5 μm.
G TIRF microscopy recordings of ER-oxGFP fluorescence from a MIN6 β-cell during K+ depolarization. Images from the time points indicated by numbers are shown below. Scale bar, 10 μm.
H Quantification of the change in PM area occupied by ER-oxGFP fluorescence for the indicated treatments (means ± SEM for 15 cells from 3 separate experiments).
I TIRF micrographs of GFP-E-Syt1 fluorescence from a MIN6 β-cell exposed to 30 mM K+ followed by 1 μM latrunculin A. Graph below shows GFP-E-Syt1 fluorescence change at the PM (means ± SEM for 15 cells from 3 separate experiments). Scale bar, 10 μm.
J Simultaneous TIRF microscopy recordings of R-GECO (red) and GFP-E-Syt1 (black) fluorescence during stimulation of a MIN6 β-cell with 20 mM glucose.
K Means ± SEM for the peak GFP-E-Syt1 response to 20 mM glucose alone, in the absence of extracellular Ca2+ or in the presence of 100 μM of the L-type Ca2+-channel inhibitor methoxyverapamil (n = 29 (Control), 30 (0 mM Ca2+), and 36 (Verapamil) cells from 3 separate experiments).
Similar articles
-
Ca2+ releases E-Syt1 autoinhibition to couple ER-plasma membrane tethering with lipid transport.EMBO J. 2018 Jan 17;37(2):219-234. doi: 10.15252/embj.201797359. Epub 2017 Dec 8. EMBO J. 2018. PMID: 29222176 Free PMC article.
-
Three-dimensional architecture of extended synaptotagmin-mediated endoplasmic reticulum-plasma membrane contact sites.Proc Natl Acad Sci U S A. 2015 Apr 21;112(16):E2004-13. doi: 10.1073/pnas.1503191112. Epub 2015 Mar 18. Proc Natl Acad Sci U S A. 2015. PMID: 25787254 Free PMC article.
-
PI(4,5)P(2)-dependent and Ca(2+)-regulated ER-PM interactions mediated by the extended synaptotagmins.Cell. 2013 Jun 20;153(7):1494-509. doi: 10.1016/j.cell.2013.05.026. Cell. 2013. PMID: 23791178 Free PMC article.
-
Homeostatic regulation of the PI(4,5)P2-Ca(2+) signaling system at ER-PM junctions.Biochim Biophys Acta. 2016 Aug;1861(8 Pt B):862-873. doi: 10.1016/j.bbalip.2016.02.015. Epub 2016 Feb 24. Biochim Biophys Acta. 2016. PMID: 26924250 Free PMC article. Review.
-
Endoplasmic Reticulum - Plasma Membrane Crosstalk Mediated by the Extended Synaptotagmins.Adv Exp Med Biol. 2017;997:83-93. doi: 10.1007/978-981-10-4567-7_6. Adv Exp Med Biol. 2017. PMID: 28815523 Review.
Cited by
-
Geometry and cellular function of organelle membrane interfaces.Plant Physiol. 2021 Apr 2;185(3):650-662. doi: 10.1093/plphys/kiaa079. Plant Physiol. 2021. PMID: 33793898 Free PMC article. Review.
-
Sticking With It: ER-PM Membrane Contact Sites as a Coordinating Nexus for Regulating Lipids and Proteins at the Cell Cortex.Front Cell Dev Biol. 2020 Jul 22;8:675. doi: 10.3389/fcell.2020.00675. eCollection 2020. Front Cell Dev Biol. 2020. PMID: 32793605 Free PMC article. Review.
-
Synaptotagmin-Associated Endoplasmic Reticulum-Plasma Membrane Contact Sites Are Localized to Immobile ER Tubules.Plant Physiol. 2018 Oct;178(2):641-653. doi: 10.1104/pp.18.00498. Epub 2018 Aug 20. Plant Physiol. 2018. PMID: 30126867 Free PMC article.
-
Mitochondria inter-organelle relationships in cancer protein aggregation.Front Cell Dev Biol. 2022 Dec 19;10:1062993. doi: 10.3389/fcell.2022.1062993. eCollection 2022. Front Cell Dev Biol. 2022. PMID: 36601538 Free PMC article. Review.
-
STIMATE reveals a STIM1 transitional state.Nat Cell Biol. 2015 Oct;17(10):1232-4. doi: 10.1038/ncb3245. Nat Cell Biol. 2015. PMID: 26419802 Free PMC article.
References
-
- Bai J, Chapman ER. The C2 domains of synaptotagmin–partners in exocytosis. Trends Biochem Sci. 2004;29:143–151. - PubMed
-
- Broad LM, Armstrong DL, Putney JW., Jr Role of the inositol 1,4,5-trisphosphate receptor in Ca(2+) feedback inhibition of calcium release-activated calcium current (I(crac)) J Biol Chem. 1999;274:32881–32888. - PubMed
-
- Brose N, Petrenko AG, Sudhof TC, Jahn R. Synaptotagmin: a calcium sensor on the synaptic vesicle surface. Science. 1992;256:1021–1025. - PubMed
-
- Chang CL, Hsieh TS, Yang TT, Rothberg KG, Azizoglu DB, Volk E, Liao JC, Liou J. Feedback regulation of receptor-induced Ca2+ signaling mediated by E-Syt1 and Nir2 at endoplasmic reticulum-plasma membrane junctions. Cell Rep. 2013;5:813–825. - PubMed
Publication types
MeSH terms
Substances
Grants and funding
LinkOut - more resources
Full Text Sources
Other Literature Sources
Molecular Biology Databases
Research Materials
Miscellaneous
