. 2015 Sep 15;309(6):F531-9.
doi: 10.1152/ajprenal.00247.2015. Epub 2015 Jul 22.

Renin expression in developing zebrafish is associated with angiogenesis and requires the Notch pathway and endothelium

Affiliations

Renin expression in developing zebrafish is associated with angiogenesis and requires the Notch pathway and endothelium

Sebastien A Rider et al. Am J Physiol Renal Physiol. .

Abstract

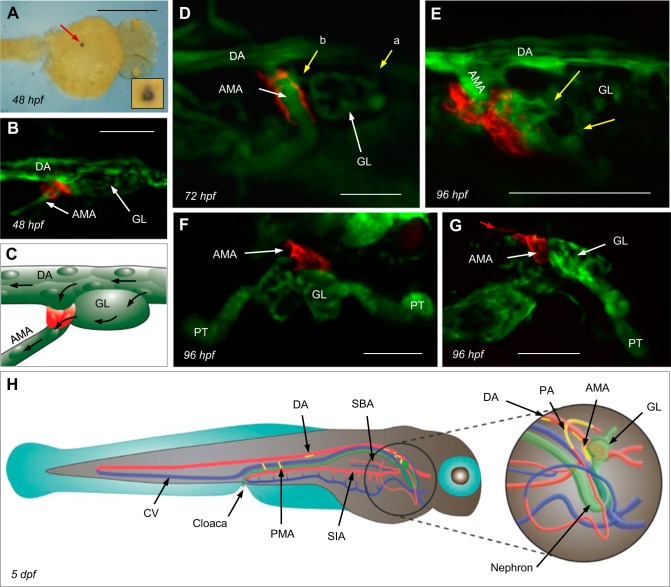
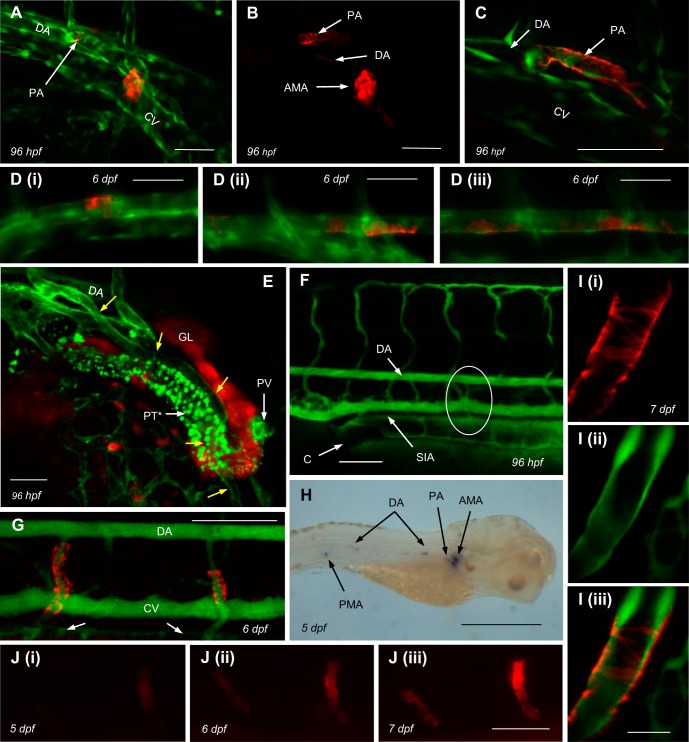
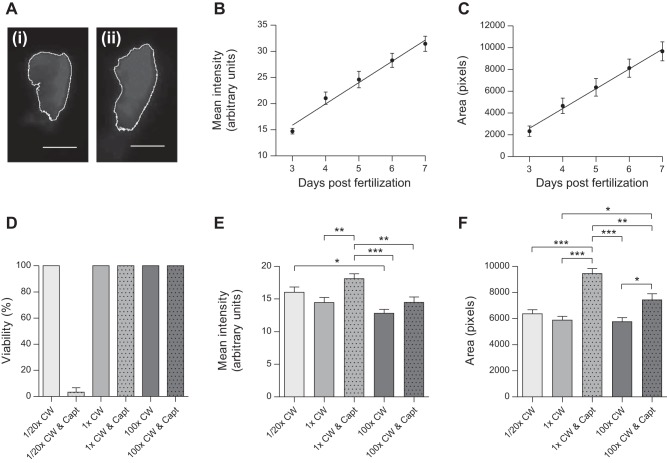
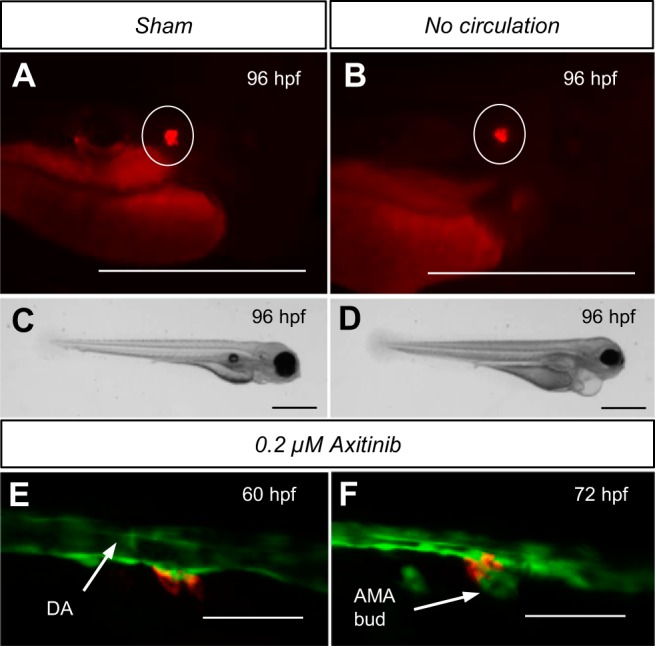
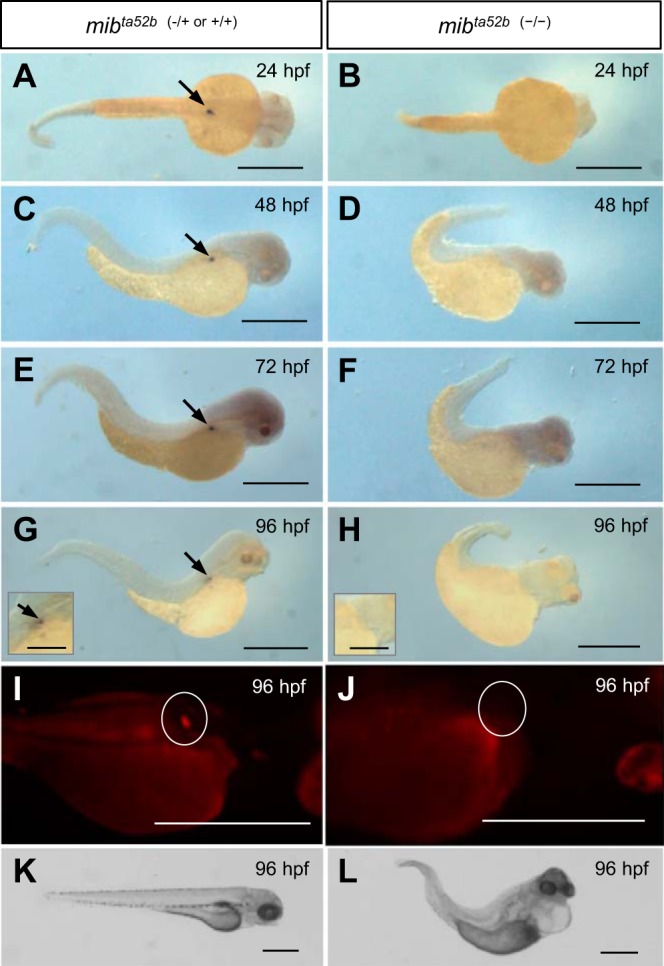
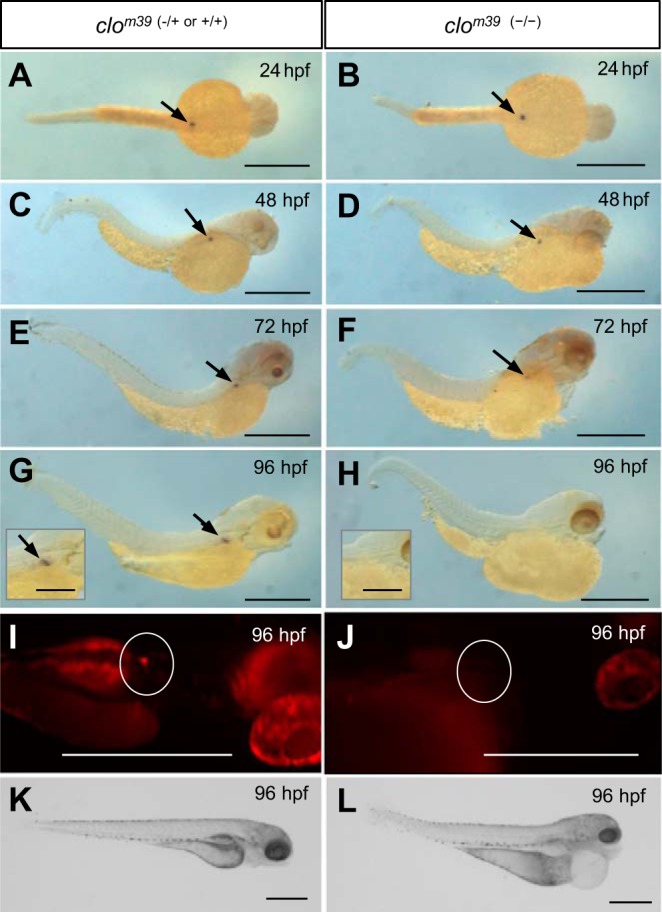
Although renin is a critical regulatory enzyme of the cardiovascular system, its roles in organogenesis and the establishment of cardiovascular homeostasis remain unclear. Mammalian renin-expressing cells are widespread in embryonic kidneys but are highly restricted, specialized endocrine cells in adults. With a functional pronephros, embryonic zebrafish are ideal for delineating the developmental functions of renin-expressing cells and the mechanisms governing renin transcription. Larval zebrafish renin expression originates in the mural cells of the juxtaglomerular anterior mesenteric artery and subsequently at extrarenal sites. The role of renin was determined by assessing responses to renin-angiotensin system blockade, salinity variation, and renal perfusion ablation. Renin expression did not respond to renal flow ablation but was modulated by inhibition of angiotensin-converting enzyme and altered salinity. Our data in larval fish are consistent with conservation of renin's physiological functions. Using transgenic renin reporter fish, with mindbomb and cloche mutants, we show that Notch signaling and the endothelium are essential for developmental renin expression. After inhibition of angiogenesis, renin-expressing cells precede angiogenic sprouts. Arising from separate lineages, but relying on mutual interplay with endothelial cells, renin-expressing cells are among the earliest mural cells observed in larval fish, performing both endocrine and paracrine functions.

Keywords: angiogenesis; endothelium; notch; renin; zebrafish.


Figures

Fig. 1.
Fig. 1.
Localization of the principal site of renin gene (ren) expression. A: dorsal view of ren mRNA within the location of the anterior mesenteric artery (AMA). The lumen is visible in the inset. Scale bar = 500 μm. hpf, hours postfertilization. B: ren-red fluorescent protein (RFP) in Tg(ren:RFP, kdrl:GFP, casper; where GFP is green fluorescent protein) becomes first visible at ∼48 hpf at the origin of the AMA, where it branches off the ventral dorsal artery (DA) immediately caudal to the glomerular primordium (GL). The exact timing of ren-RFP expression varies between individuals. Scale bar = 25 μm. C: schematic of the image in B showing renin expression (red), the AMA, DA, and GL endothelium (green), and blood flow (arrows). D: Tg(ren:RFP, casper) and FITC-dextrans showing mural ren-RFP and a patent vasculature. Afferent arterioles entering the GL (a) and an efferent arteriole draining into the AMA at 72 hpf (b) are shown. Scale bar = 50 μm. E: multiphoton projection showing details of mural cell ren-RFP and kdrl-GFP at the AMA in Tg(ren:RFP, kdrl:GFP, casper) at 96 hpf. Yellow arrows show two glomerular arterioles draining into the AMA. Scale bar = 50 μm. F and G: dorsal (F) and sagittal (G) views of Tg(ren:RFP, wt1b:GFP, casper) at 96 hpf showing juxtaglomerular ren-RFP at the AMA. At 96 hpf, faint ren-RFP expression was visible on the ventral DA immediately caudal to the AMA (red arrow). Developing proximal tubules (PTs) also express Wilms' tumor 1b (wt1b)-GFP. Scale bars = 50 μm. H: schematic showing sites of renin expression at 5 days postfertization (dpf). Mural renin cells are shown in yellow, arterial vessels are red, venous vessels are blue, and the GL, nephron, and cloaca are in green. SIA, supraintestinal artery.
Fig. 2.
Fig. 2.
Extrarenal ren expression in larval fish. A: in addition to AMA renin, Tg(ren:RFP, kdrl:GFP, capser) displayed fainter ren-RFP expression at pectoral artery (PA) origins and the anterior ventral DA. B: ren-RFP channel only of the image shown in A. Scale bars = 50 μm. C: detail of mural ren-RFP extending down the PA from its branch point with the DA in Tg(ren:RFP, kdrl:GFP, capser). Scale bar = 50 μm. D: Tg(ren:RFP, kdrl:GFP, capser) showing faint ren-RFP along the anterior (i), mid (ii), and posterior (iii) DA. E: false color image [kdrl (green) wt1b (red)] of Tg(kdrl:mCherry, wt1b:GFP, capser) at 96 hpf showing the association of the PA (yellow arrows) with the PT. *mCherry channel auto-fluorescence in PT cells. The returning pectoral vein (PV) is also immediately adjacent to the PT. Scale bar = 50 μm. F: Tg(ren:RFP, capser) and injected FITC-dextrans showing the patent posterior mesenteric artery (PMA; circled) supplying blood from the DA to the SIA at 96 hpf; ren-RFP is not expressed in PMA at this age. Scale bar = 100 μm. G: Tg(ren:RFP, casper) injected with FITC-dextrans at 6 dpf showing patent PMAs with mural ren-RFP draining into the SIA (arrows pointing to SIA). Scale bar = 100 μm. H: in situ image of ren mRNA at 5 dpf showing expression at locations consistent with the positions of the AMA, PA, ventral DA, and PMA. Scale bar = 500 μm. I: 2-μm confocal section showing detail of mural ren-RFP at the PMA at 7dpf. Scale bar = 25 μm. Mural ren-RFP displayed the characteristic banding pattern (i), but no such pattern was seen in endothelial kdrl:GFP expression (ii). Merged images are shown in iii. J: consecutive images (iiii) of increasing ren-RFP expression at the PMAs of Tg(ren:RFP, casper) between 5 and 7 dpf. Scale bar = 50 μm.
Fig. 3.
Fig. 3.
Evaluation of ren transgene expression at the AMA during development and after physiological challenge. A: representative grayscale ren-RFP images of Tg(ren:RFP, casper) used for mean RFP intensity and RFP area analysis. The white outline was based on the set color threshold for 1× conditioned water (CW; i) and 1× CW and captopril (Capt; ii). Scale bar = 20 μm. B and C: regression analysis (n = 9) showing linear increases in both mean ren-RFP intensity (R2 = 0.7096, P < 0.0001; B) and ren-RFP area (R2 = 0.5911, P < 0.0001; C) at the AMA from 3 to 7 dpf. D: 100% viability was seen across all salinity and captopril treatments except for dilute medium (1:20× CW) with the angiotensin-converting enzyme inhibitor captopril (0.1 mM), in which viability was just 3% by 96 hpf (n = 3, P <0.0001 by ANOVA). E: by 96 hpf, mean ren-RFP intensity was significantly affected by ambient salinity and captopril treatments (n = 31–35, P < 0.0001 by ANOVA). Post hoc analysis showed that 0.1 mM captopril in the control medium (1× CW) increased mean ren-RFP intensity; this effect was not significant in high salinity. Mean ren-RFP intensity was modulated by salinity alone, resulting in significantly lower RFP expression between low and high salinities. F: the area of ren-RFP expression was also significantly affected by captopril treatment (n = 31–35, P < 0.0001 by ANOVA) in both control medium and high salinity by 96 hpf. Salinity alone did not change the area of ren-RFP expression at the AMA.
Fig. 4.
Fig. 4.
Effect of hemodynamic flow on developmental ren expression and ren association with angiogenesis. The effect of renal perfusion blockade was tested. AMA ren-RFP expression (circled) was visible in both sham-injected embryos (A) and embryos lacking hemodynamic flow (B) throughout development. RFP was also visible in no-flow embryos at 5 dpf (data not shown). Areas other than those circled are autofluorescence from the yolk sac and the gastrointestinal tract. C: sham-injected embroys appeared normal and displayed no gross phenotype. D: at 96 hpf, no-flow embryos exhibited significant pericardial and peritoneal edema. VEGF receptor inhibition by 0.2 μM axitinib from 24 to 60 hpf was used to assess renin cell location before AMA angiogenesis in Tg(ren:RFP, kdrl:GFPcasper). E: with AMA angiogenesis inhibited, ren-RFP cells were present on the ventral DA at the initiation site of AMA formation. F: after washout of axitinib at 60 hpf, AMA angiogenesis proceeded, and, by 72 hpf, mural renin cells were positioned at the AMA origin. The decreased DA diameter at 72 hpf was due to diminished hemodynamic flow. Scale bars = 50 μm.
Fig. 5.
Fig. 5.
Requirement of the Notch pathway for developmental ren expression. The requirement of functional notch signaling for ren expression was tested between 24 and 96 hpf in notch-impaired mib mutants. A, C, E, and G: in situ images of “wild-type” mibta52b (−/+ or +/+) fish confirming ren expression at the AMA between 24 and 96 hpf (arrows). B, D, F, and H: ren was not detectable in mibta52b (−/−) mutants between 24 and 96 hpf. I: wild-type Tg[ren:RFP, mibta52b (−/+ or +/+)] larvae express ren-RFP (circled). J: at 96 hpf, ren-RFP was not visible in the area of the AMA (circled) in Tg[ren:RFP, mibta52b (−/−)] mutants. Areas other than those circled are autofluorescence. K: mibta52b (−/+ or +/+) larvae lacked any gross phenotype. L: at 96 hpf, mibta52b (−/−) mutants displayed pericardial edema, cerebral hemorrhage, and a malformed and pigment-free tail, and lacked blood flow. Scale bars = 500 μm (250 μm in insets).
Fig. 6.
Fig. 6.
Necessity of the endothelium for maintained ren expression. The requirement of the endothelium for ren expression was tested in avascular clo mutants. A, C, E, and G: in situ images of wild-type clom39 (−/+ or +/+) fish confirming ren expression between 24 and 96 hpf (arrows). B and D: all clom39 (−/−) mutants expressed ren mRNA between 24 and 48 hpf. F: at 72 hpf, only 54% (n = 15) of clom39 (−/−) mutants expressed ren mRNA; the remaining individuals expressed varying degrees ren mRNA. H: by 96 hpf, ren mRNA was not detectable in clom39 (−/−) mutants. I: at 96 hpf, ren-RFP (circled) was visible in Tg[ren:RFP, clom39 (−/+ or +/+)] larvae. J: by 96 hpf, ren-RFP was not visible in the area of the AMA (circled) in Tg[ren:RFP, clom39 (−/−)] mutants. Areas other than those circled are autofluorescence. K: clom39 (−/+ or +/+) larvae lacked any gross phenotype. L: at 96 hpf, clom39 (−/−) mutants displayed severe peritoneal and pericardial edemas, and lacked blood flow. Scale bars = 500 μm (250 μm in insets).

Similar articles

Cited by

References

    1. Banjo T, Grajcarek J, Yoshino D, Osada H, Miyasaka KY, Kida YS, Ueki Y, Nagayama K, Kawakami K, Matsumoto T, Sato M, Ogura T. Haemodynamically dependent valvulogenesis of zebrafish heart is mediated by flow-dependent expression of miR-21. Nat Commun 4: 1–11, 2013. - PMC - PubMed
    1. Berg AC, Chernavvsky-Sequeira C, Lindsey J, Gomez RA, Sequeira-Lopez ML. Pericytes synthesize renin. World J Nephrol 2: 11–16, 2013. - PMC - PubMed
    1. Bollig F, Mehringer R, Perner B, Hartung C, Schafer M, Schartl M, Volff JN, Winkler C, Englert C. Identification and comparative expression analysis of a second wt1 gene in zebrafish. Dev Dyn 235: 554–561, 2006. - PubMed
    1. Brunskill EW, Sequeira-Lopez MLS, Pentz ES, Lin E, Yu J, Aronow BJ, Potter SS, Gomez RA. Genes that confer the identity of the renin cell. J Am Soc Nephrol 22: 2213–2225, 2011. - PMC - PubMed
    1. Campbell DJ. Clinical relevance of local renin angiotensin systems. Front Endocrinol 5: 113–113, 2014. - PMC - PubMed

Publication types

MeSH terms

LinkOut - more resources