

Unlocking nature's treasure-chest: screening for oleaginous algae
- PMID: 26202369
- PMCID: PMC5378892
- DOI: 10.1038/srep09844
Unlocking nature's treasure-chest: screening for oleaginous algae
Abstract
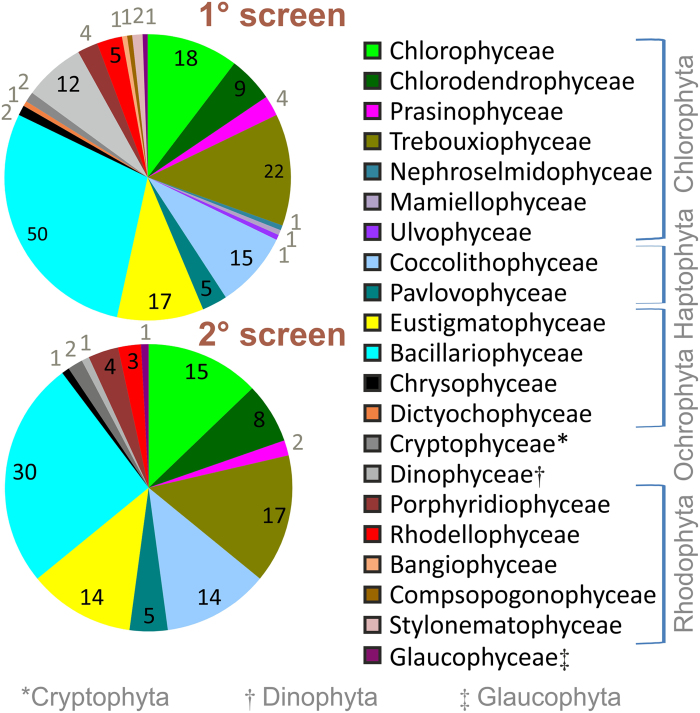
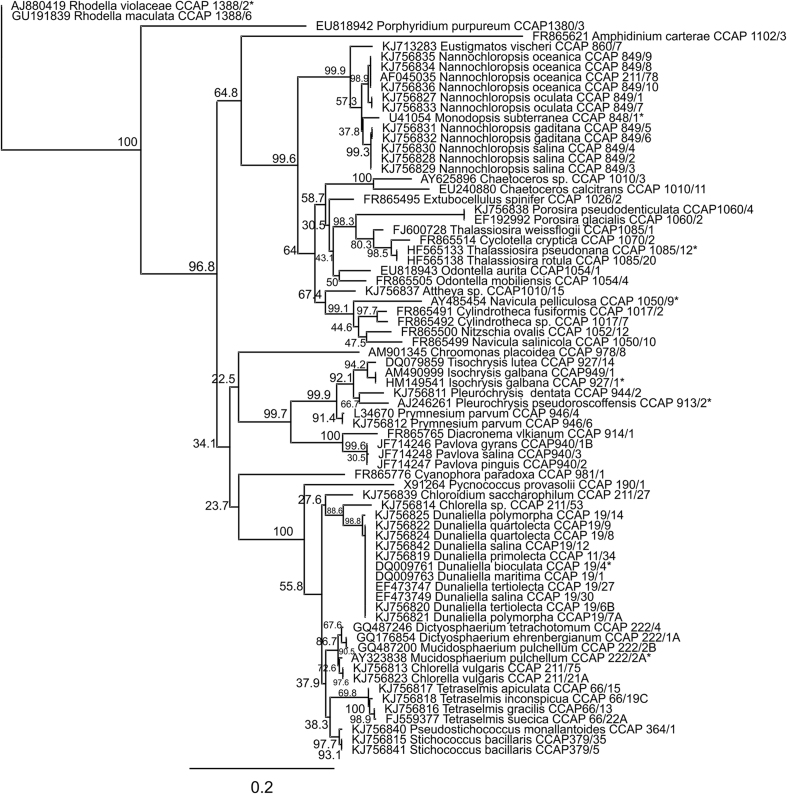
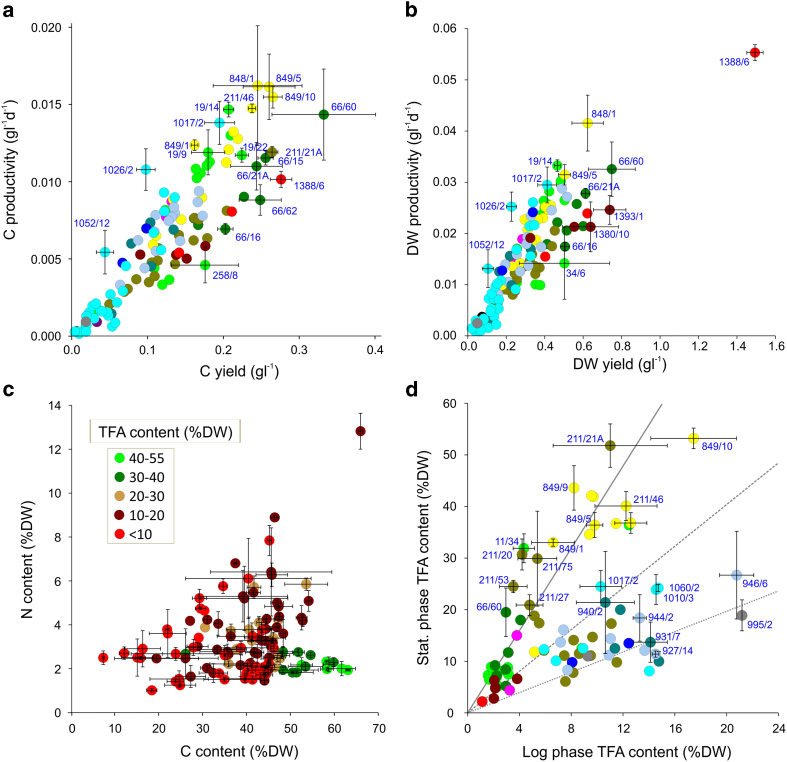
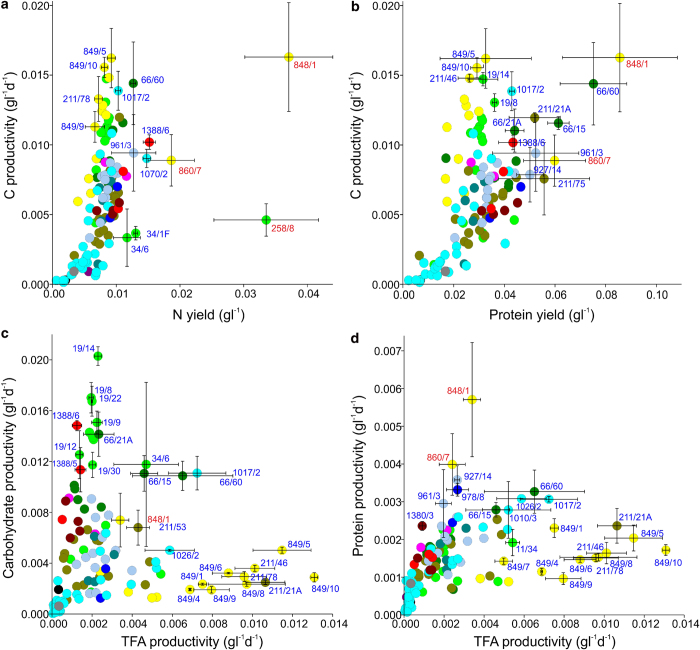
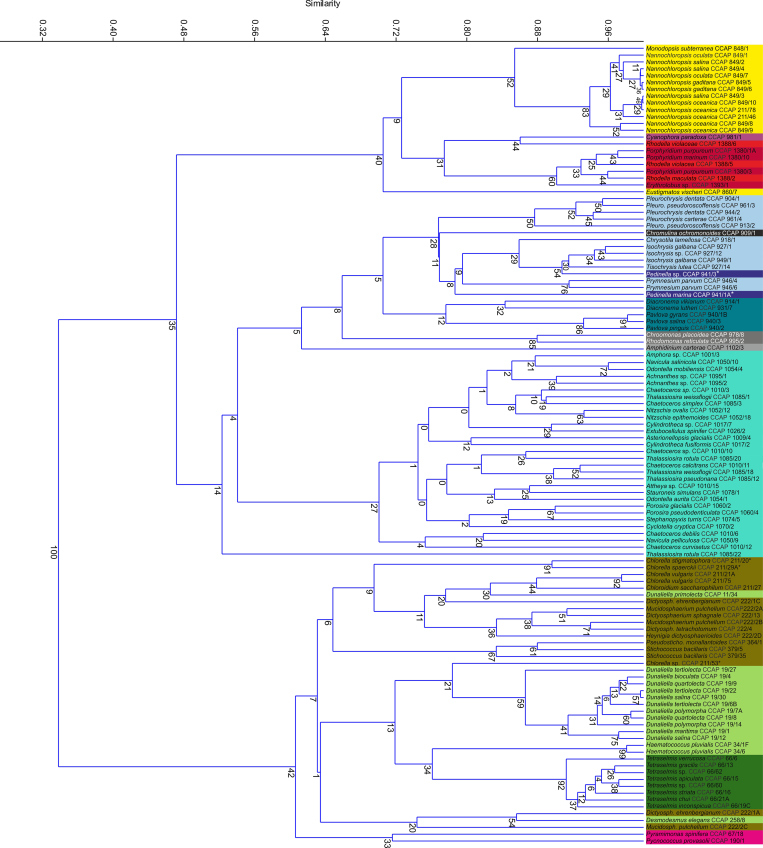
Micro-algae synthesize high levels of lipids, carbohydrates and proteins photoautotrophically, thus attracting considerable interest for the biotechnological production of fuels, environmental remediation, functional foods and nutraceuticals. Currently, only a few micro-algae species are grown commercially at large-scale, primarily for "health-foods" and pigments. For a range of potential products (fuel to pharma), high lipid productivity strains are required to mitigate the economic costs of mass culture. Here we present a screen concentrating on marine micro-algal strains, which if suitable for scale-up would minimise competition with agriculture for water. Mass-Spectrophotometric analysis (MS) of nitrogen (N) and carbon (C) was subsequently validated by measurement of total fatty acids (TFA) by Gas-Chromatography (GC). This identified a rapid and accurate screening strategy based on elemental analysis. The screen identified Nannochloropsis oceanica CCAP 849/10 and a marine isolate of Chlorella vulgaris CCAP 211/21A as the best lipid producers. Analysis of C, N, protein, carbohydrate and Fatty Acid (FA) composition identified a suite of strains for further biotechnological applications e.g. Dunaliella polymorpha CCAP 19/14, significantly the most productive for carbohydrates, and Cyclotella cryptica CCAP 1070/2, with utility for EPA production and N-assimilation.
Conflict of interest statement
The authors declare no competing financial interests.
Figures
Similar articles
-
Oil production by the marine microalgae Nannochloropsis sp. F&M-M24 and Tetraselmis suecica F&M-M33.Bioresour Technol. 2012 Jun;114:567-72. doi: 10.1016/j.biortech.2012.02.123. Epub 2012 Mar 10. Bioresour Technol. 2012. PMID: 22459965
-
The Potential of Microalgae Lipids for Edible Oil Production.Appl Biochem Biotechnol. 2016 Oct;180(3):438-451. doi: 10.1007/s12010-016-2108-6. Epub 2016 May 4. Appl Biochem Biotechnol. 2016. PMID: 27146875
-
Comparative proteomics reveals proteins impacted by nitrogen deprivation in wild-type and high lipid-accumulating mutant strains of Tisochrysis lutea.J Proteomics. 2014 Jun 13;105:107-20. doi: 10.1016/j.jprot.2014.02.022. Epub 2014 Feb 28. J Proteomics. 2014. PMID: 24583506
-
Microalgal lipids biochemistry and biotechnological perspectives.Biotechnol Adv. 2014 Dec;32(8):1476-93. doi: 10.1016/j.biotechadv.2014.10.003. Epub 2014 Oct 14. Biotechnol Adv. 2014. PMID: 25449285 Review.
-
Lipid metabolism in microalgae distinguishes itself.Curr Opin Biotechnol. 2013 Apr;24(2):300-9. doi: 10.1016/j.copbio.2012.08.008. Epub 2012 Sep 12. Curr Opin Biotechnol. 2013. PMID: 22981869 Review.
Cited by
-
Diatoms for Carbon Sequestration and Bio-Based Manufacturing.Biology (Basel). 2020 Aug 10;9(8):217. doi: 10.3390/biology9080217. Biology (Basel). 2020. PMID: 32785088 Free PMC article. Review.
-
Effect of ammonium and high light intensity on the accumulation of lipids in Nannochloropsis oceanica (CCAP 849/10) and Phaeodactylum tricornutum (CCAP 1055/1).Biotechnol Biofuels. 2018 Mar 9;11:60. doi: 10.1186/s13068-018-1061-8. eCollection 2018. Biotechnol Biofuels. 2018. PMID: 29541157 Free PMC article.
-
Behavior of the extremophile green alga Coccomyxa melkonianii SCCA 048 in terms of lipids production and morphology at different pH values.Extremophiles. 2019 Jan;23(1):79-89. doi: 10.1007/s00792-018-1062-3. Epub 2018 Oct 19. Extremophiles. 2019. PMID: 30341564
-
Improved Reference Genome for Cyclotella cryptica CCMP332, a Model for Cell Wall Morphogenesis, Salinity Adaptation, and Lipid Production in Diatoms (Bacillariophyta).G3 (Bethesda). 2020 Sep 2;10(9):2965-2974. doi: 10.1534/g3.120.401408. G3 (Bethesda). 2020. PMID: 32709619 Free PMC article.
-
Large-scale screening of natural genetic resource in the hydrocarbon-producing microalga Botrycoccus braunii identified novel fast-growing strains.Sci Rep. 2021 Apr 2;11(1):7368. doi: 10.1038/s41598-021-86760-8. Sci Rep. 2021. PMID: 33811231 Free PMC article.
References
-
- Day J. G., Slocombe S. P. & Stanley M. S. Overcoming biological constraints to enable the exploitation of microalgae for biofuels. Bioresour. Technol. 109, 245–51 (2012). - PubMed
-
- Hu Q. et al. Microalgal triacylglycerols as feedstocks for biofuel production: perspectives and advances. Plant J. 54, 621–39 (2008). - PubMed
-
- Williams, P. J. le B. & Laurens L. M. L. Microalgae as biodiesel & biomass feedstocks: Review & analysis of the biochemistry, energetics & economics. Energy Environ. Sci. 3, 554–590 (2010).
-
- Chisti Y. Biodiesel from microalgae. Biotechnol. Adv. 25, 294–306 (2007). - PubMed
Publication types
MeSH terms
LinkOut - more resources
Full Text Sources
Other Literature Sources
Molecular Biology Databases
Research Materials
Miscellaneous
